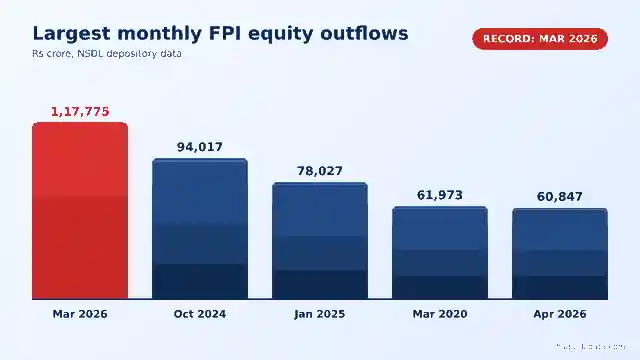
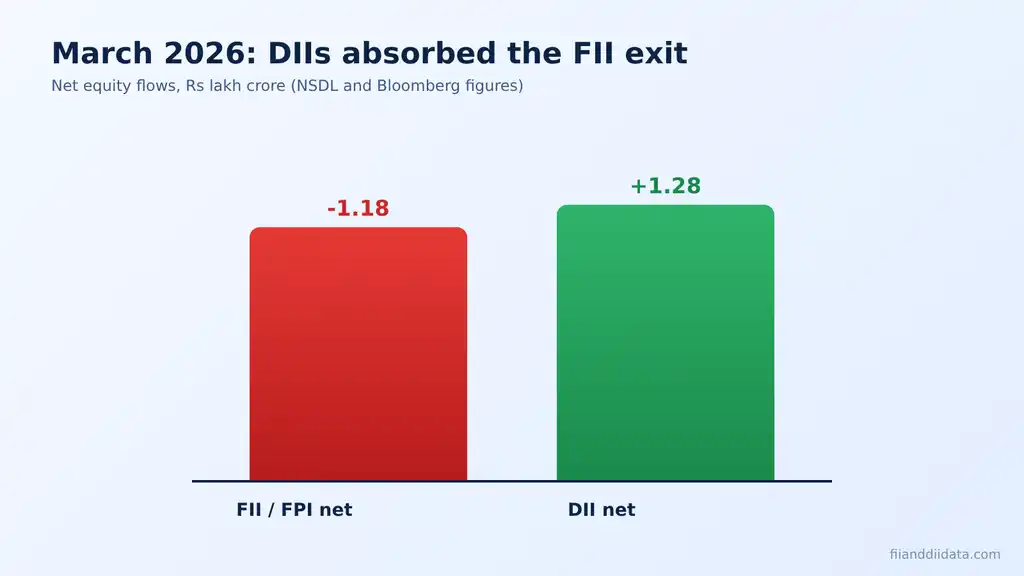
The biggest FII selling month in the data reviewed for this article is March 2026, when foreign portfolio investors pulled about Rs 1.18 lakh crore out of Indian equities, according to NSDL depository data. Domestic institutions bought roughly Rs 1.28 lakh crore in the same month. This guide ranks the five largest outflow months, explains why NSE and NSDL numbers differ, and shows how to read a month like this.
Key Takeaways
- March 2026 tops the NSDL ranking with a net FPI equity outflow of about Rs 1,17,775 crore.
- October 2024 (Rs 94,017 crore) and January 2025 (Rs 78,027 crore) follow, then March 2020 and April 2026.
- NSDL data and NSE provisional data use different methods, so a month can rank differently on each.
- DII buying was larger than FPI selling in March 2026, which cushioned the market impact of the exit.
- A record outflow describes what happened. It does not predict where the market goes next.
In this guide
- What counts as the biggest selling month
- Top five FII selling months
- March 2026 in detail
- Why NSE and NSDL numbers differ
- A worked example
- Five point checklist
- What a record month does not tell you
- Frequently asked questions
- The bottom line
What Counts as the Biggest Selling Month
A selling month is a calendar month in which foreign portfolio investors (FPIs) sold more equity than they bought. The size of the outflow is net sales: total sales minus total purchases for the month. Anything above Rs 50,000 crore is unusual. Anything above Rs 1 lakh crore is rare enough that it appears in market histories.
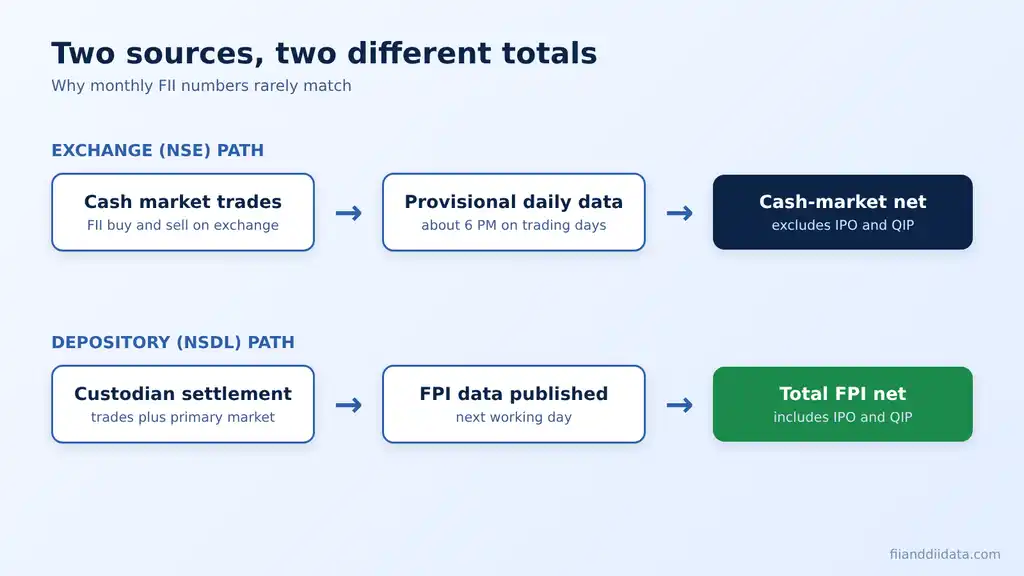
Two things change the ranking. The first is the data source. NSE publishes provisional cash market figures for FIIs and DIIs after the close, around 6 PM IST. NSDL publishes depository data for FPIs, usually the next working day, and it also counts primary market activity such as IPOs and QIPs. The second is the scope. Some lists count equity only, others add debt and hybrid flows. If you want the basics first, read our explainer on FII versus FPI before comparing numbers.
Size also needs context. Rs 61,973 crore in March 2020 was a smaller number than Rs 1.18 lakh crore in March 2026, but the Indian market was far smaller then. A rupee ranking is the usual headline, and it is the one used here, but a ranking against market capitalisation would reorder the older months. Unless stated otherwise, every figure below is the NSDL monthly net equity number for FPIs.
Top Five FII Selling Months
The table below ranks the five largest monthly FPI equity outflows in the NSDL series. Four of the five fall after September 2024, which tells you how concentrated the recent selling has been. For the full month by month record, use our FII DII monthly data page.
| Rank | Month | Net FPI equity outflow (Rs crore) |
|---|---|---|
| 1 | March 2026 | 1,17,775 |
| 2 | October 2024 | 94,017 |
| 3 | January 2025 | 78,027 |
| 4 | March 2020 | 61,973 |
| 5 | April 2026 | 60,847 |
Two details stand out. First, March 2026 beat the previous record, October 2024, by roughly Rs 23,700 crore, a gap of about one quarter. Second, April 2026 follows directly after the record month and still lands fifth, so the selling did not stop when March ended. Anyone tracking the run of outflows can follow it in our FPI outflow 2026 analysis.
Notice the spacing as well. Between October 2024 and April 2026 the table has four entries in about eighteen months, while March 2020 stands alone from an earlier cycle. That clustering matters because repeated heavy months test domestic buyers more than a single shock does. One large month can be absorbed by a burst of SIP inflows and insurer buying. Several large months in a row ask domestic investors to keep up the pace, and that is the question the DII data answers month after month.
March 2026 in Detail
March 2026 is the month to study because it pairs the largest outflow with a very large domestic response. FPIs sold about Rs 1,17,775 crore net on the NSDL count, while DIIs bought about Rs 1.28 lakh crore. Put simply, domestic mutual funds, insurers and pension money bought more than foreign investors sold. That is the single most useful fact about the month, because it cushions the price impact of even a record exit.
Sell-offs of this size rarely have one trigger. Analysts usually point to a mix of global risk aversion, a firmer dollar, pressure on the rupee and the gap between Indian valuations and cheaper markets elsewhere. The weight of each factor differs from one episode to the next, and it is better to read the original commentary than to rely on a single explanation. Our piece on why FIIs are selling Indian stocks walks through the usual drivers.
To see how the offset worked in practice, compare the two sides directly. Our FII selling versus DII buying tracker puts the monthly figures next to each other, so you can see which months DIIs matched the exit and which months they did not.
Why NSE and NSDL Numbers Differ
Readers often find two different numbers for the same month and assume one is wrong. Usually both are right, because they measure different things.
- Source: NSE data comes from trades reported by exchange members. NSDL data comes from custodians that settle FPI trades.
- Timing: NSE provisional data is out about 6 PM IST on the trading day. NSDL data usually arrives the next working day. Provisional figures are not final.
- Coverage: NSDL includes IPO, QIP and other primary market flows. The NSE cash market figure does not.
- Revisions: Custodian data is settled, so it moves less after publication than provisional numbers do.
For ranking months, the NSDL series is the cleaner choice because it is settled and complete. For judging a single trading day, the NSE figure is the practical one. Our guide to the NSE versus NSDL FII data difference covers the reconciliation in more detail, and the FII DII data today page shows the daily provisional numbers once NSE publishes them.
A Worked Example
Here is a simple illustration, using round hypothetical numbers rather than any specific month. Suppose FPIs sell Rs 3,00,000 crore of shares in a month and buy Rs 2,00,000 crore. Their net equity flow is minus Rs 1,00,000 crore. Suppose DIIs buy Rs 2,50,000 crore and sell Rs 1,40,000 crore, a net purchase of Rs 1,10,000 crore.
Combined, institutions are net buyers of Rs 10,000 crore, so the foreign exit was fully absorbed. The index could still fall, because retail investors, proprietary desks and other participants also trade, and because price moves depend on where the buying and selling happens, not only on totals. The point of the exercise is the method: always compute the FII and DII nets side by side, then ask what the combined figure says.
Apply the same arithmetic to March 2026 and the picture is clear. DII buying of about Rs 1.28 lakh crore against FPI selling of about Rs 1.18 lakh crore leaves a small positive institutional balance, even in the record selling month. Remember that the two figures come from different reporting systems, so treat the gap as indicative and not exact.
Five Point Checklist for Reading a Heavy Selling Month
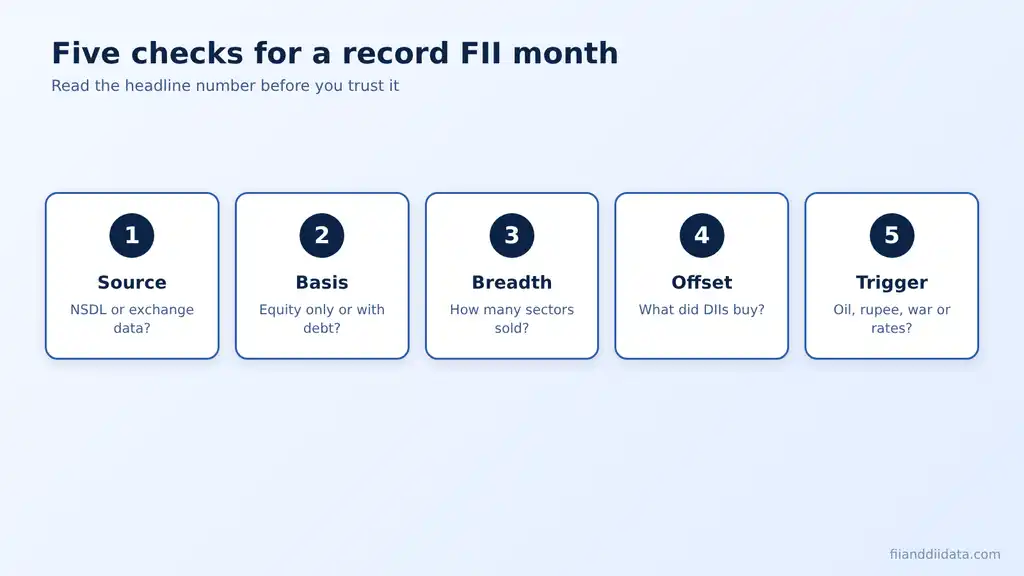
When a headline says FIIs sold a record amount, run through these five checks before drawing a conclusion.
- Source: Is the number from NSE provisional data or NSDL settled data?
- Basis: Does it cover equity only, or equity plus debt and hybrid flows?
- Breadth: Was the selling spread across many sectors or concentrated in two or three?
- Offset: How much did DIIs buy in the same period?
- Trigger: What was the stated reason, and is it a one-off event or a continuing condition?
The breadth check is worth extra attention. Selling concentrated in a few large banks or IT names has a different market impact from selling spread evenly across the index. Our FII selling by sector page shows where the money has been leaving.
What a Record Month Does Not Tell You
A record outflow is a fact about the past month. It is not a signal for the next one. Foreign selling has ended in some episodes within weeks and continued for quarters in others, and the data alone cannot tell you which case you are in. Treating the largest selling month as an automatic market bottom, or as a sign of collapse, are both guesses.
What the data does give you is context. If FPIs are selling and DIIs are buying, the market is changing hands from foreign to domestic holders, and the pace of that handover affects liquidity and volatility. If both sides are selling, the picture is weaker. Reading the two together is more informative than reading either alone, and it is the idea behind our guide on what FII selling means.
A useful habit is to track three running numbers: the monthly NSDL equity flow, the monthly DII net purchase, and the year to date total for each. A single record month looks dramatic, but the year to date line shows whether the pace is slowing or speeding up. Update your sheet after NSDL publishes its figures, and note any later revision so your history stays consistent with the source.
For retail investors the practical use is modest. Flow data helps you understand the mood of large investors, but it should sit beside valuations, earnings and your own time horizon. You can also look at the wider picture on our home page for FII and DII data, and learn the lookup steps in how to check FII DII data.
Frequently Asked Questions
What was the biggest FII selling month in India?
On the NSDL monthly equity series, March 2026 was the largest, with a net FPI outflow of about Rs 1,17,775 crore. October 2024 and January 2025 rank second and third.
Is NSE or NSDL data better for ranking FII selling months?
NSDL data is better for monthly rankings because it is settled by custodians and includes primary market flows. NSE provisional data suits single day checks, but it is released after the close and is not final.
Do DII purchases always offset FII selling?
No. In March 2026 DIIs bought more than FPIs sold, but that is not guaranteed in every month. Compare both figures for the same period before drawing a conclusion.
Does a record FII selling month mean the market bottom is near?
Not necessarily. Heavy selling has ended quickly in some periods and continued for months in others. Flow data describes what happened and does not forecast the next move.
Where can I check monthly FII data myself?
Use the NSDL FPI Monitor for monthly depository data and the NSE website for daily provisional FII and DII figures. Our monthly data page also collects the figures in one place.
The Bottom Line
March 2026 is the biggest FII selling month in the NSDL data reviewed here, at about Rs 1.18 lakh crore, and domestic institutions bought more than that. Rank months on settled NSDL data, check the DII offset, and be careful about reading a record as a forecast. For fresh numbers, use the FII DII blog and the daily data pages as NSE and NSDL publish them.
Sources: NSDL FPI Monitor, NSE India, SEBI. Figures are rounded and subject to revision.
This article is for educational purposes only and is not investment advice. Please consult a SEBI-registered advisor before making investment decisions.