DII data impact on Nifty is best understood as a cushion, not a steering wheel. Domestic institutions such as mutual funds and insurers often buy when foreign investors sell, which softens falls in the index. This guide explains how to read that effect, where the numbers come from, and how to avoid common mistakes.
Key Takeaways
- DII data impact on Nifty is mostly about absorption: DII buying can slow a fall, but it rarely reverses one by itself.
- Daily DII figures from NSE are provisional. Final depositary data arrives later, so small differences are normal.
- In 2026, reports say DIIs bought heavily while FIIs sold, yet the Nifty still fell about 11.5% by early June.
- A single day of flows says little. Weekly and monthly totals, read next to the index move, say more.
- This is education only, not advice to buy or sell anything.
Table of Contents
- What DII data impact on Nifty Means
- Where the Daily DII Numbers Come From
- How DII Buying Cushions Nifty Falls
- When DII Selling Matters
- Worked Example: One Week of DII data impact on Nifty
- Four Flow Scenarios at a Glance
- Mistakes to Avoid
- Pros and Cons of DII data impact on Nifty
- FAQ
- The Bottom Line
What DII data impact on Nifty Means
The Nifty 50 is the headline index of the National Stock Exchange. Its daily move reflects thousands of buy and sell decisions. Institutional flows are one visible part of that picture, and DII data impact on Nifty is the question of how much the domestic part of those flows shapes the index.
Institutional data is published every trading day. It splits net buying and selling into two groups, foreign and domestic. You can browse the latest figures on the home page for FII and DII data, and read broader explainers in our FII and DII articles.

Who Counts as a DII
DII stands for domestic institutional investor. The group includes mutual funds, insurance companies, banks, pension funds and similar large Indian institutions. A lot of their buying is fed by steady monthly investments from retail savers, which helps explain why DII flows can stay positive even when markets are weak. For the ownership side of the same story, see our guide to DII shareholding.
How DII data impact on Nifty Differs From FII Data
FII data tracks foreign portfolio investors, also called FPIs. Foreign money tends to move with global risk appetite, currency views and interest rate expectations. Domestic money moves with local savings and the fund managers who deploy them. The two groups often act as opposites on the same day, which is why the gap between them gets so much attention. Our piece on FII buying and selling covers the foreign side in detail.
Why DII data impact on Nifty Looks Smaller on Up Days
When the index rises on broad optimism, both groups may buy, and the DII line simply blends in. The cushioning effect only becomes obvious on weak days, when domestic buying meets foreign selling. That asymmetry is why most commentary on DII flows appears during sell-offs.
Where the Daily DII Numbers Come From
Most readers see daily figures that come from exchange-reported data. These numbers are normally released in the evening, around 6 PM IST, and they are provisional. Final foreign investor data is published by the depositary the next working day, and the two sources can differ slightly. Check the official sites, NSE India and the NSDL FPI Monitor, before relying on any single figure.
Provisional numbers can also be revised. If you track flows in a sheet, store the date, the source and whether the value was provisional or final. That one habit prevents most arguments about whose number is right. Exact timings and formats may vary; check the official site.
How DII Buying Cushions Nifty Falls
The Absorption Effect
When foreign investors sell a large block of shares, someone has to buy it. Domestic institutions are often the buyers, because they hold cash from regular inflows and have long investment horizons. Their purchases supply demand at lower prices, which slows the decline. The cushion is real, but it has limits: it reduces the speed of a fall rather than guaranteeing a floor.

What the DII data impact on Nifty Looked Like in 2026
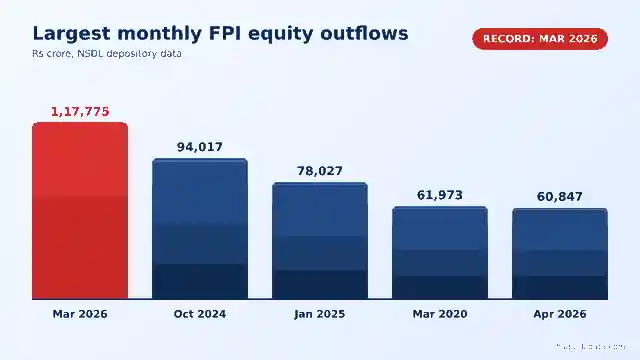
Press reports during 2026 described a year of heavy foreign selling. A Business Today report dated 31 July 2026 said record DII inflows offset a foreign selloff of about 58 billion dollars, and a Kotak Neo report dated 9 June 2026 said DIIs invested roughly 4 lakh crore rupees despite the foreign exit. These are reported figures, so treat the exact amounts with caution and confirm them against the official data.
Here is the useful lesson. Even with that domestic support, the Nifty fell about 11.5% by early June 2026, according to the index data we reviewed. So the DII data impact on Nifty was cushioning, not reversing. Domestic buying slowed the damage, but it did not outweigh the foreign exit and the wider market mood. For the foreign side of that story, read FPI investment in India.
When DII Selling Matters
The cushion works in one direction. If DIIs turn net sellers while foreign investors are also selling, there is no buyer of last resort, and weakness can run further. Reviewing November 2026 daily data from a public flow tracker, we saw a stretch where DIIs were net sellers while FIIs were net buyers, which is the mirror image of the earlier pattern. That data is provisional and may vary; check the official site.
Domestic institutions sometimes sell to book profits after a rally, to meet redemptions, or to rebalance. A single day of selling is not a signal. A multi-week run of DII selling, together with falling prices, is worth noting. It tells you the cushion is thinning.
Worked Example: One Week of DII data impact on Nifty
This is a made-up example to show the arithmetic. The numbers are not real market data. All values are net figures in rupees crore, where a minus sign means net selling.
| Day | FII net | DII net | Combined |
|---|---|---|---|
| Monday | -5,000 | +4,000 | -1,000 |
| Tuesday | -2,000 | +3,000 | +1,000 |
| Wednesday | +1,500 | -500 | +1,000 |
| Thursday | -3,500 | +4,500 | +1,000 |
| Friday | -1,000 | +2,500 | +1,500 |
| Week total | -10,000 | +13,500 | +3,500 |
Step 1: add the FII column. -5,000 – 2,000 + 1,500 – 3,500 – 1,000 = -10,000 crore.
Step 2: add the DII column. 4,000 + 3,000 – 500 + 4,500 + 2,500 = 13,500 crore.
Step 3: add the two totals. -10,000 + 13,500 = +3,500 crore. Domestic buying more than absorbed foreign selling.
Step 4: compute the cover ratio. DII buying divided by FII selling is 13,500 / 10,000 = 1.35, or 135%. On Monday alone it was 4,000 / 5,000 = 80%, so the cushion was partial that day.
Step 5: read it with the index. If the Nifty still fell in that week, the lesson is that a 135% cover ratio did not stop the decline. That is the DII data impact on Nifty in practice: it is context for the move, not a prediction of the next one.

Four Flow Scenarios at a Glance
Most trading days fall into one of four combinations. The table lists each one and the usual way to read it. These are general patterns, and exceptions are common.
| Scenario | FII | DII | Usual reading |
|---|---|---|---|
| Foreign sell, domestic buy | Net sell | Net buy | Cushion at work; fall may slow |
| Both buy | Net buy | Net buy | Broad demand; supportive backdrop |
| Foreign buy, domestic sell | Net buy | Net sell | Rotation or profit booking by domestic funds |
| Both sell | Net sell | Net sell | No cushion; weakness can extend |
Mistakes to Avoid
Treating One Day as a Trend
A single large DII purchase can be a one-off block deal or a quarter-end adjustment. Look at five days, then twenty, before drawing a conclusion.
Ignoring Which Instruments Are Counted
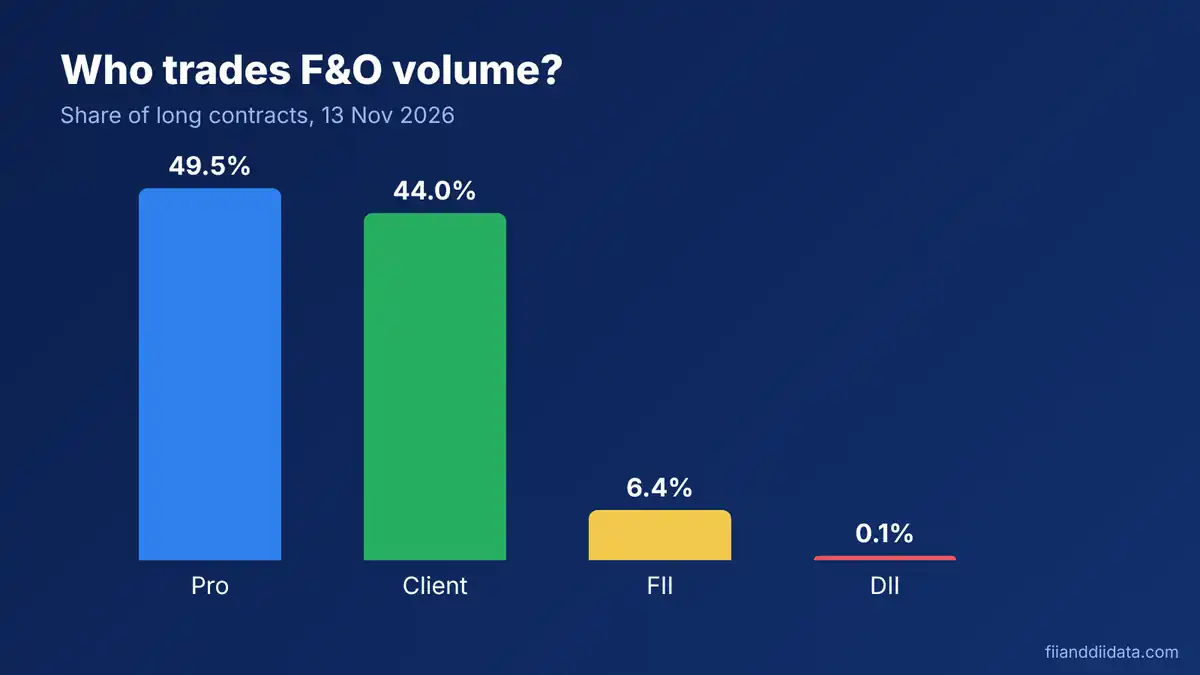
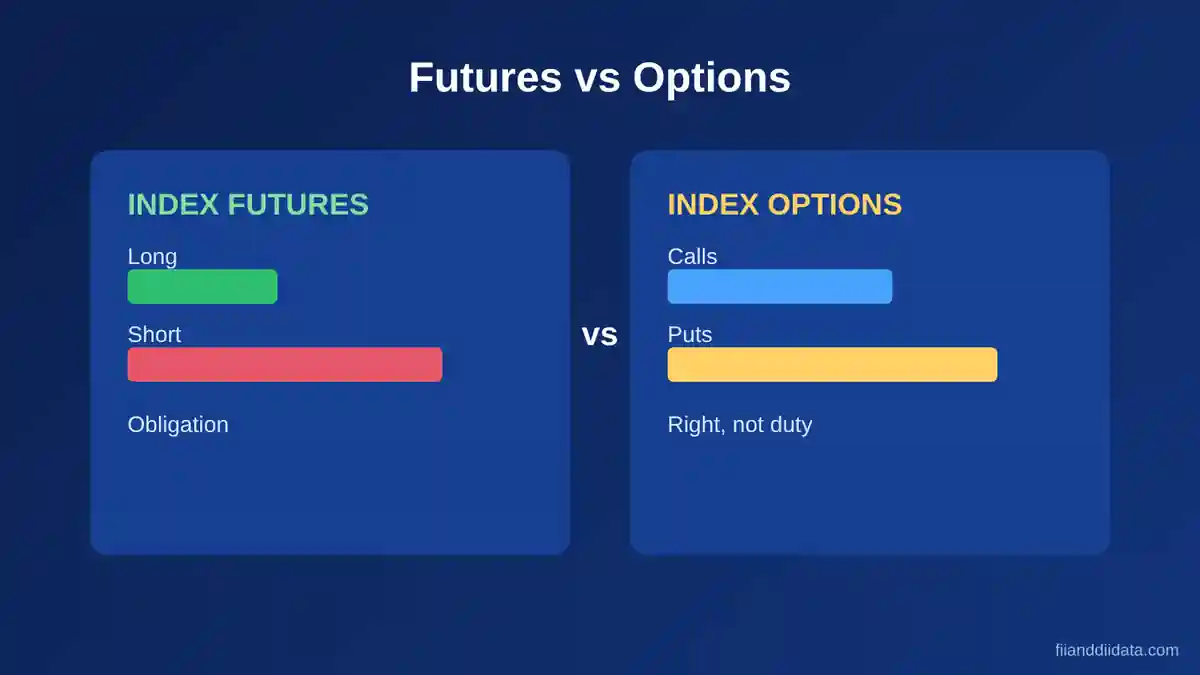
Cash market flows and derivatives positions are different things. Most headline numbers refer to the cash segment. Index futures positions by foreign investors are reported separately and tell a different story.
Assuming the Cushion Is a Guarantee
The DII data impact on Nifty is a tendency, not a rule. Domestic institutions have their own limits, and they can step back at any time.
Pros and Cons of DII data impact on Nifty
The table sets out what this kind of analysis does well and where it falls short.
| Pros | Cons |
|---|---|
| Gives quick context for why the index fell less than expected | Cannot predict the next day’s move |
| Uses free, public data from official sources | Provisional figures can be revised later |
| Shows how local savings support the market | Domestic buying can fade when inflows slow |
| Easy to track in a simple spreadsheet | Cash flows ignore derivatives positions |
| Helps separate foreign mood from domestic demand | Correlation with the index is not causation |
FAQ
What is the DII data impact on Nifty?
It is the effect that domestic institutional buying or selling has on the direction and speed of the Nifty 50. In practice, DII buying tends to soften falls when foreign investors sell, but it does not decide the trend on its own.
Do DIIs always buy when FIIs sell?
No. They often do, but not always. There are days and weeks when both groups sell. Treat the pattern as common, not guaranteed.
Where can I check the latest DII figures?
Start with the NSE India site for daily provisional data and the NSDL FPI Monitor for foreign investor data. Both may revise or finalise numbers later, so check the official site.
Can DII data impact on Nifty predict where the index will go?
No. The DII data impact on Nifty describes what already happened. It can add context, but it is not a forecast and should not be used as buy or sell advice.
How is the cover ratio calculated?
Divide DII net buying by FII net selling over the same period. For example, 13,500 crore divided by 10,000 crore is 1.35, or 135%. A ratio above 100% means domestic buying exceeded foreign selling.
The Bottom Line: DII data impact on Nifty
The DII data impact on Nifty is real but limited. Domestic institutions absorb a lot of foreign selling, which is why falls are often slower than the headlines suggest, yet the 2026 experience shows the index can still drop sharply. Read the data over weeks, pair it with the index move, and treat it as context rather than a forecast.
Sources: NSE India, NSDL FPI Monitor, SEBI, Business Today (31 July 2026), Kotak Neo (9 June 2026), and public flow data for November 2026. Figures are provisional and may vary; check the official site.
Disclaimer: This article is for education only. It is not investment advice, a recommendation or a price target. Markets carry risk, so consult a SEBI-registered adviser before making decisions.