
Skip to content
FII And DII Data
  • FII And DII Data
    • Cash Market Summary
    • F&O Activity
    • Options Activity
    • NSE Participant-Wise Open Interest
  • Quick Links
    • About us
    • Contact us
    • Privacy Policy
    • Disclaimer
    • Terms and Conditions
  • Blog

DII Buying

Infographic on SIP inflow September 2026 showing record monthly mutual fund contributions in India

SIP Inflow September 2026: Record ₹32,490 Crore Explained

Sunny Kumar
|
Published On: October 26, 2026
FII DII weekly report week ending 23 October 2026 illustration with Nifty candlestick charts on navy trading screens

Weekly FII DII Report: Week Ending Oct 23, DIIs Bought ₹10,942 Crore

Sunny Kumar
|
Published On: October 25, 2026
FPI outflow 2026 cumulative chart showing foreign portfolio investors pulling ₹3.08 lakh crore from Indian equities by October

FPI Outflow 2026: Month-wise Data Behind the ₹3.08 Lakh Crore Exit

Sunny Kumar
|
Published On: October 24, 2026
FII DII data October 2026 chart showing cumulative DII buying of ₹59,110 crore against FII selling of ₹51,466 crore

FII DII Data October 2026: DIIs Bought ₹59,110 Crore as FIIs Sold

Sunny Kumar
|
Published On: October 23, 2026
FII selling October 2026: foreign investors pulling money out of Indian stocks while DIIs buy

Why FIIs Are Dumping Indian Stocks in October 2026: 7 Reasons Behind the Record ₹3 Lakh Crore Exit

Sunny Kumar
|
Published On: October 23, 2026

Popular FII And DII Data Tools

FII And DII Data
Cash Market Daily Summary: Live Data Today
FII Options Activity

Latest Posts

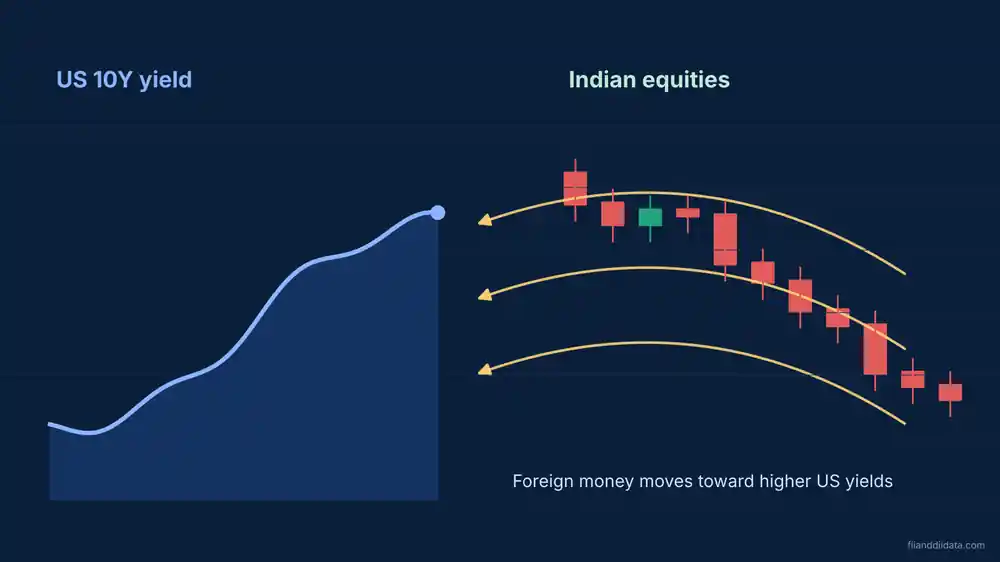
US bond yield impact on Indian market shown as foreign money moving from Indian equities toward a rising US 10-year yield

US Bond Yield Impact on Indian Market: What 5% Means for Nifty

October 26, 2026

Featured graphic on SEBI new F&O rules 2026 with a candlestick chart, a regulation shield and a balance scale

SEBI New F&O Rules 2026: 9 Changes and What They Cost Traders

October 26, 2026
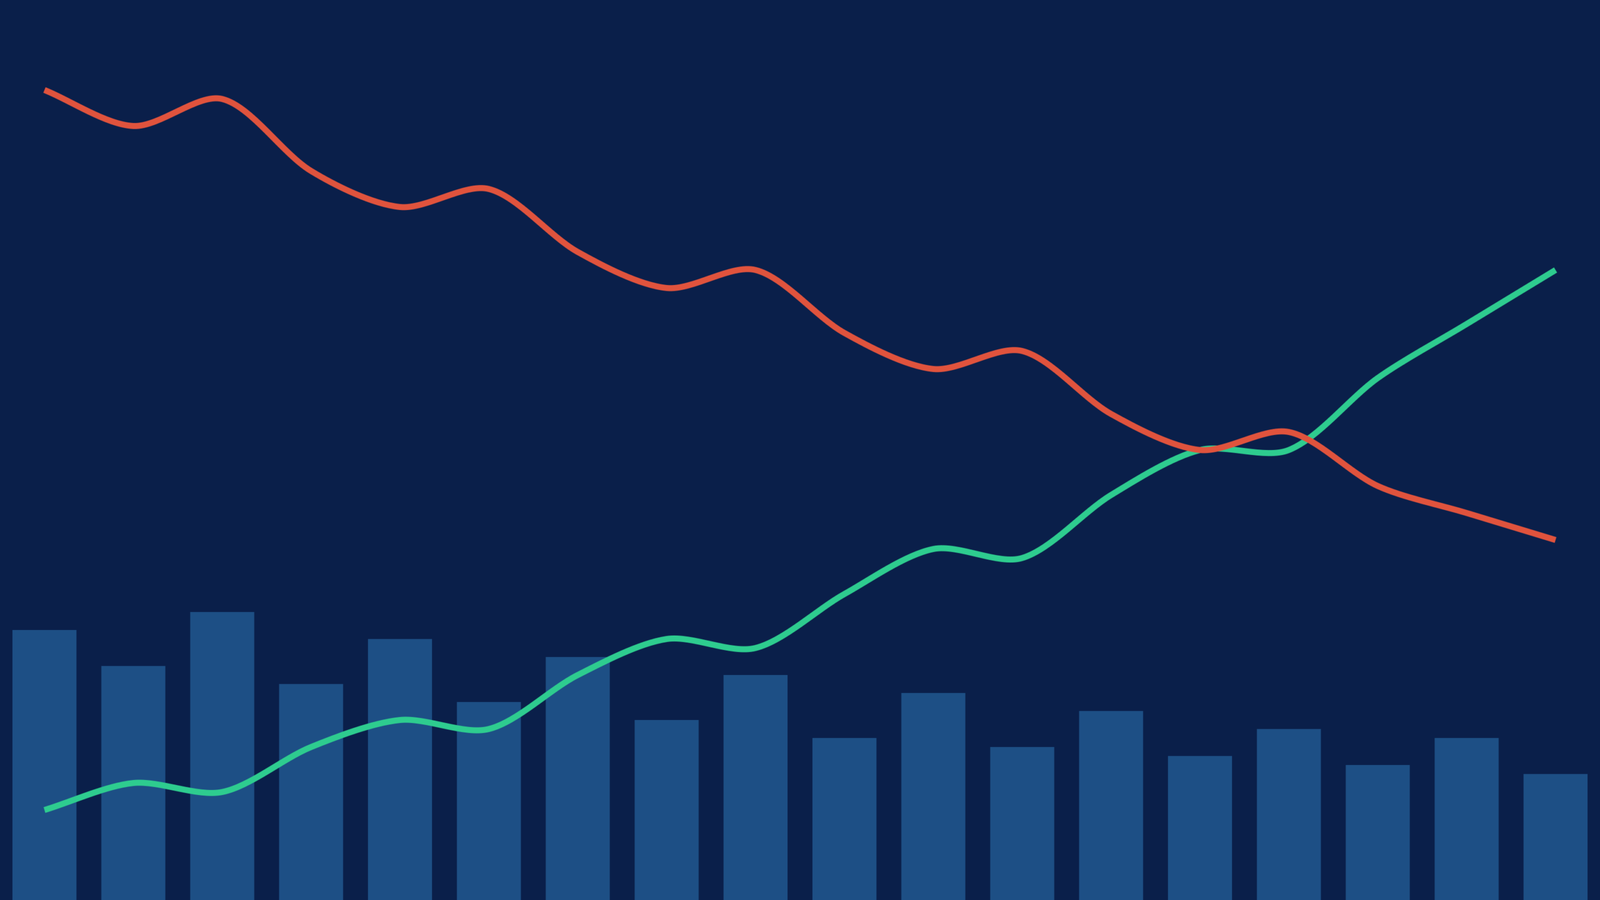
Navy editorial finance graphic with a falling red line for FPI selling in listed stocks and a rising green line for IPO demand, October 2026

FPIs Pulled ₹48,056 Crore From Indian Stocks in October, but Not From IPOs

October 26, 2026
FII DII weekly report week ending 23 October 2026 illustration with Nifty candlestick charts on navy trading screens

Weekly FII DII Report: Week Ending Oct 23, DIIs Bought ₹10,942 Crore

October 25, 2026
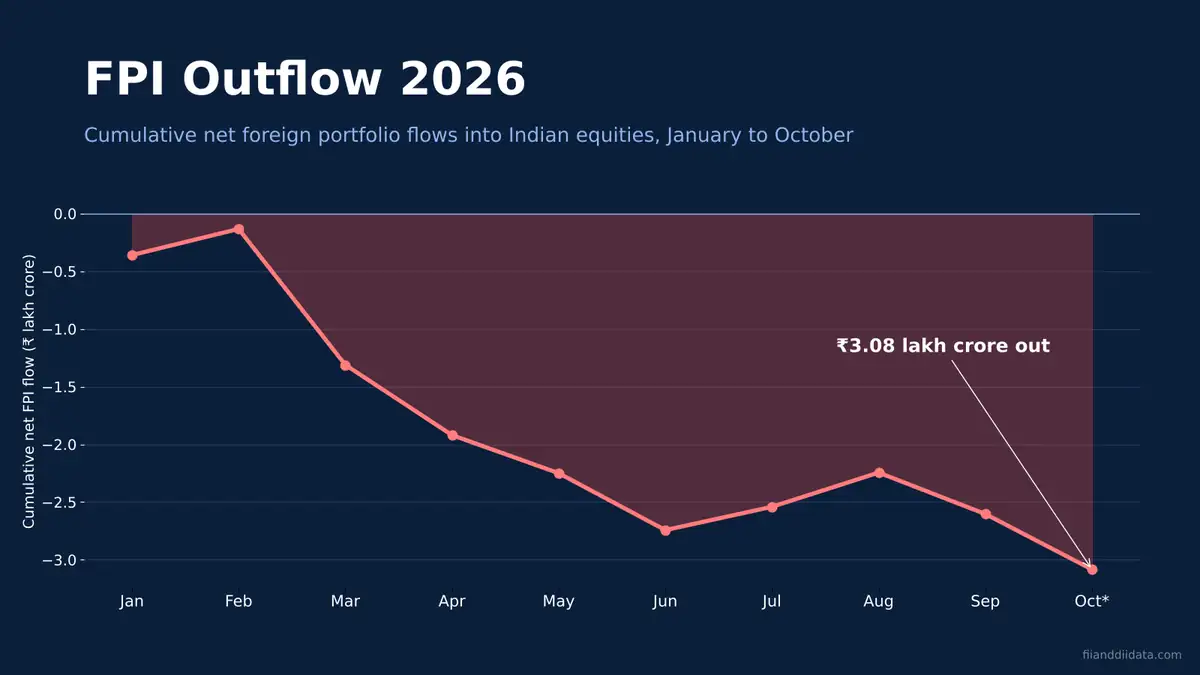
FPI outflow 2026 cumulative chart showing foreign portfolio investors pulling ₹3.08 lakh crore from Indian equities by October

FPI Outflow 2026: Month-wise Data Behind the ₹3.08 Lakh Crore Exit

October 24, 2026
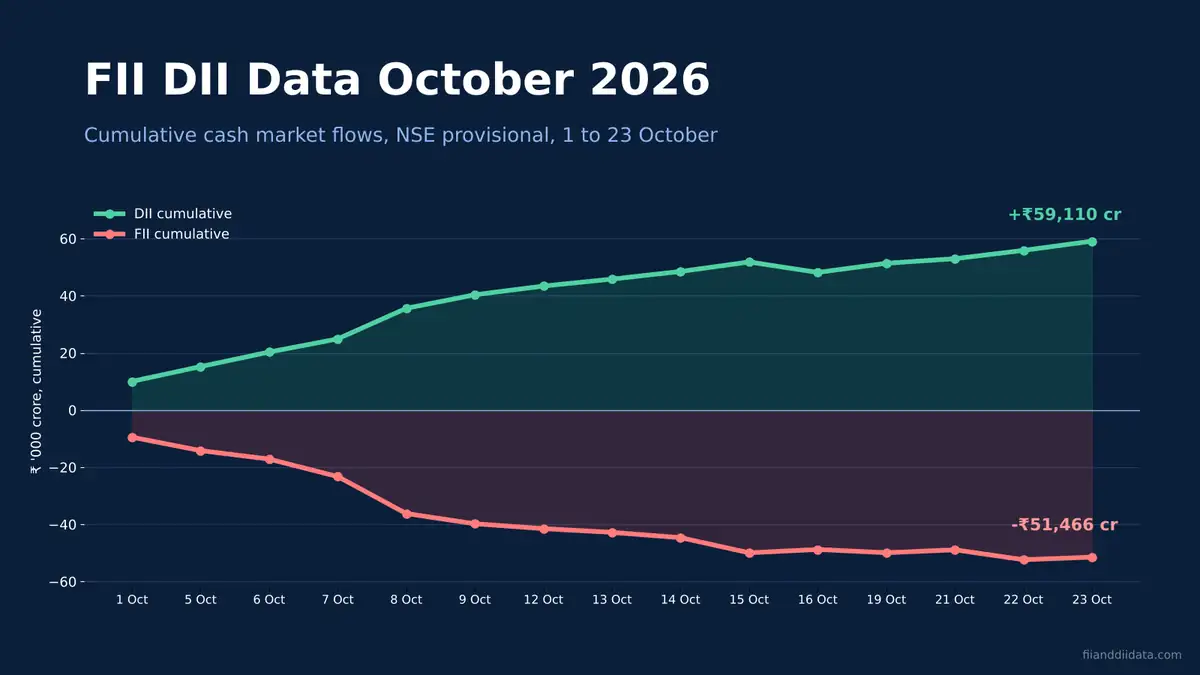
FII DII data October 2026 chart showing cumulative DII buying of ₹59,110 crore against FII selling of ₹51,466 crore

FII DII Data October 2026: DIIs Bought ₹59,110 Crore as FIIs Sold

October 23, 2026

FII And DII Data Logo

FII and DII Data is a comprehensive financial analytics platform that provides real-time and structured market insights for traders and investors. Here you can access detailed data on FII and DII activity across Cash, Futures, Options, CE (Call), and PE (Put) segments in one place.
Our platform is designed to simplify complex market data, helping users track institutional buying and selling trends, analyze market sentiment, and make informed trading decisions. With fast performance, user-friendly tools, and accurate datasets, FII and DII Data serves as an all-in-one solution for market analysis, strategy planning, and financial research.

Popular Data Tools

FII DII Data Cash Market Summary FII Options Activity

QUICK LINKS

About Us Contact Us Disclaimer Privacy Policy

© 2026 FII And DII Data. All rights reserved.

FII And DII Data Logo

  • FII And DII Data
    • Cash Market Summary
    • F&O Activity
    • Options Activity
    • NSE Participant-Wise Open Interest
  • Quick Links
    • About us
    • Contact us
    • Privacy Policy
    • Disclaimer
    • Terms and Conditions
  • Blog