The SIP inflow September 2026 figure came in at a record ₹32,490 crore, according to AMFI data released on 12 October 2026. That is up from ₹32,297 crore in August and about 10.7% higher than a year ago. Here is the month-wise trend, what the stoppage ratio says, and why it matters for FII and DII flows.
The timing is what makes this number interesting. September was another month of heavy foreign selling, with FPIs pulling out more than ₹35,000 crore from equities. Yet household money kept coming in, every month, on the same date, without anyone checking the headlines first.
SIP Inflow September 2026: The Key Numbers
These are the figures that matter from the September release, as reported by Angel One, Outlook Money and The Hans India in October 2026:
- Monthly SIP contribution: ₹32,490 crore, an all-time high.
- Contributing SIP accounts: about 10.06 crore.
- New SIP registrations: 63.26 lakh, against 66.40 lakh in August.
- SIPs discontinued or matured: 49.68 lakh, against 53.82 lakh in August.
- SIP stoppage ratio: 78.53%, down from 81.05% in August.
- SIP assets under management: ₹17.86 lakh crore, about 21.6% of total industry AUM.
Note that ₹32,490 crore is gross SIP money collected in the month. It is not the same as net inflow into equity funds, and the two should not be added together.
Month-wise SIP Inflow Trend in 2026
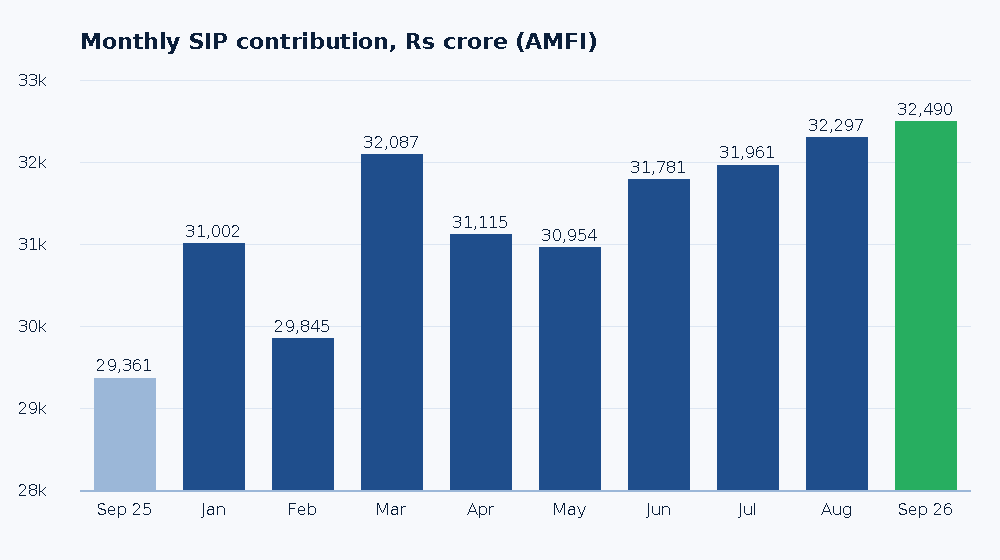
A single record month tells you little. The trend matters more, and the trend has been steady. Here is how monthly SIP contributions have moved through the middle of 2026, with September 2025 for comparison.
| Month | Monthly SIP inflow (₹ crore) | Change vs previous month |
|---|---|---|
| September 2025 | 29,361 | Base for yearly comparison |
| May 2026 | 30,954 | Not compared |
| June 2026 | 31,781 | +827 |
| July 2026 | 31,961 | +180 |
| August 2026 | 32,297 | +336 |
| September 2026 | 32,490 | +193 (record) |
The monthly increases are small, a few hundred crore at a time. That is exactly the point. SIP money does not surge or crash with sentiment. It grinds higher, and over twelve months that grind added roughly ₹3,100 crore to the monthly run rate.
How SIP Money Reaches the Stock Market

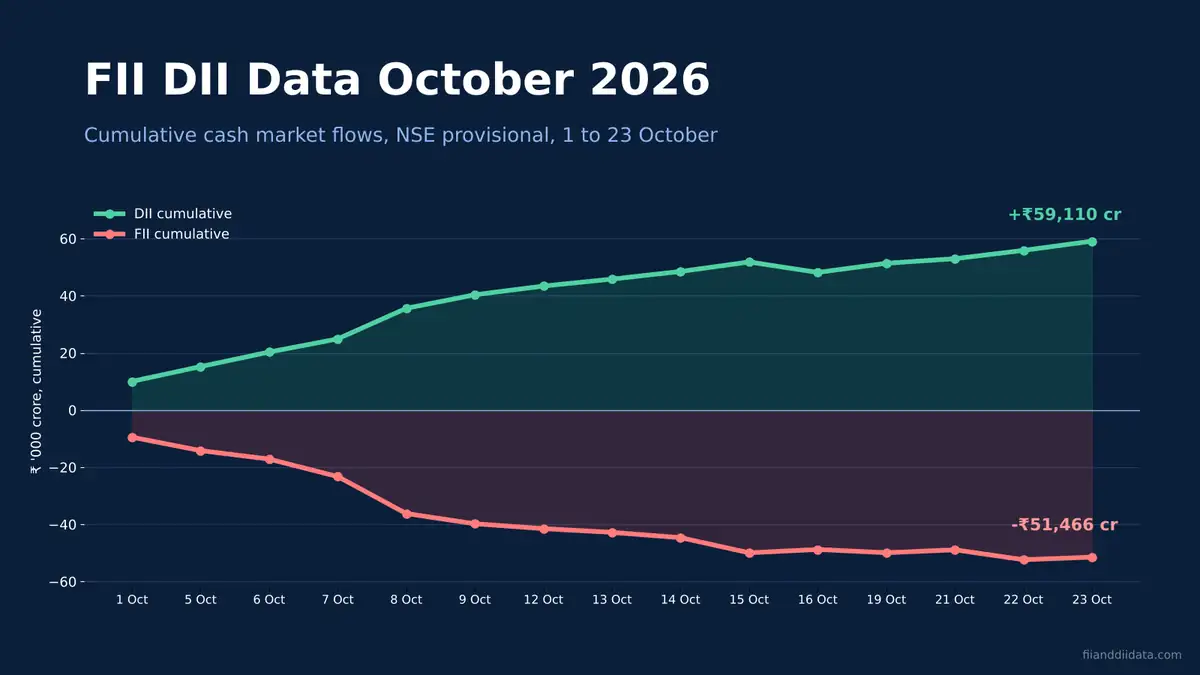
Every SIP debit lands with a mutual fund, and mutual funds are the biggest part of the DII group. When fund managers deploy that money into shares, it shows up in the DII column of the daily cash market data. This is why our guide to the difference between FII and DII describes domestic flows as more stable than foreign ones.
In September 2026, equity mutual funds took in net inflows of ₹38,307 crore, up about 30.6% from ₹29,329 crore in August, according to AMFI data reported by Outlook Money on 12 October. Gross money raised by open-ended equity schemes was ₹74,832 crore against redemptions of ₹36,525 crore.
Where the equity money went
| Category | Net inflow, September 2026 (₹ crore) | August 2026 (₹ crore) |
|---|---|---|
| Small cap | 9,038.57 | 7,097.54 |
| Mid cap | 7,834.84 | 6,989.40 |
| Flexi cap | 6,701.80 | 5,059.42 |
| Large and mid cap | 4,271.22 | 3,872.79 |
| Multi cap | 3,859.55 | 3,732.77 |
| Sectoral | 1,840.02 | -53.19 |
| Large cap | 859.47 | -1,147.36 |
| ELSS tax saver | -662.14 | Not reported |
Small and mid cap funds alone took nearly ₹16,900 crore. Investors kept chasing the riskier end of the market in a month of heavy foreign selling. Large cap funds turned positive after an outflow in August, but only just.
SIP Inflow vs FII Selling in September 2026
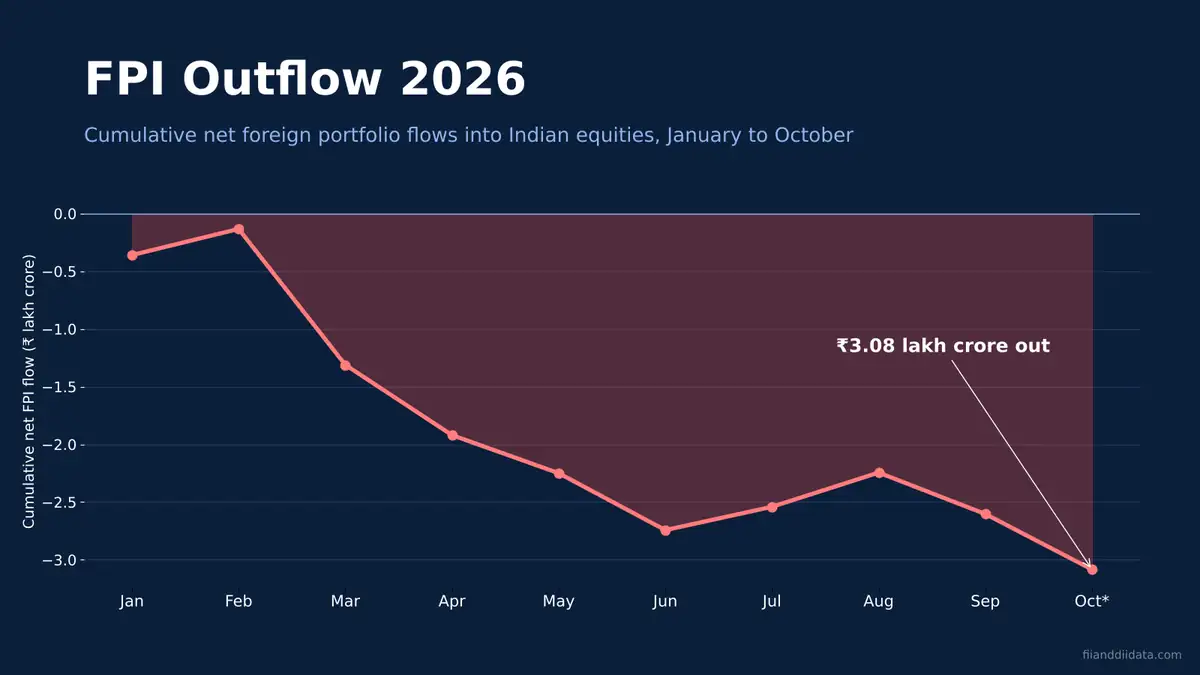
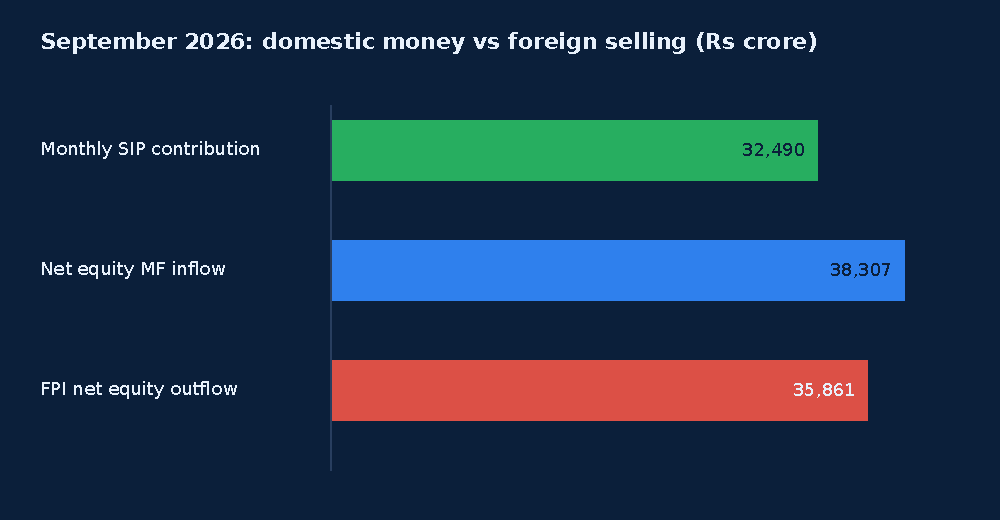
This is the comparison our readers care about most. NSDL data, as compiled by Finnovate on 7 October 2026, showed foreign portfolio investors pulled a net ₹35,861 crore out of Indian equities in September. You can see that month in context in our FPI outflow 2026 month-wise data.
Put the two side by side. SIP contributions of ₹32,490 crore covered about 91% of the FPI outflow on their own. Net equity fund inflows of ₹38,307 crore were larger than the entire foreign exit. For a closer look at how SIP inflow and FII selling line up month by month, see our FII DII monthly data page.
A worked example: one trading day
Here is a simple way to think about it. Spread ₹32,490 crore across roughly 22 trading sessions and you get about ₹1,480 crore of SIP money per day. Now picture a day where the provisional data shows FIIs sold ₹3,000 crore and DIIs bought ₹4,000 crore.
- Net institutional flow: -3,000 + 4,000 = +₹1,000 crore.
- Roughly ₹1,480 crore of the DII buying could be funded by that day’s share of SIP money.
- The remaining ₹2,520 crore of DII buying has to come from lump sum investments, insurance money, pension funds or cash already held by funds.
- If FIIs keep selling ₹3,000 crore a day for weeks, SIP money alone cannot absorb it. Other domestic sources must keep stepping in.
This is a rough average, not a precise daily figure. SIP dates cluster around the start of the month, and fund managers do not invest every rupee the same day. But it gives a realistic sense of scale.
What the SIP Stoppage Ratio Is Telling Us
The stoppage ratio divides SIPs discontinued or matured by new registrations. In September 2026 that was 49.68 lakh divided by 63.26 lakh, which gives 78.53%. A reading below 100% means more SIPs are being started than stopped.
The improvement has been sharp. Angel One reported the ratio has fallen for five straight months from 95.46% in May 2026. That said, September 2025 was lower still at 76.27%, so the ratio has only recovered to near last year’s level, not beyond it.
New registrations also slipped from 66.40 lakh in August to 63.26 lakh in September. The flow is healthy, but the pace of new investors joining has cooled slightly.
What Traders Often Get Wrong About SIP Data
The most common mistake is reading a record SIP number as a bullish signal for Nifty. It is not. SIP money supports demand, but it does not set direction. Record SIP months have arrived alongside heavy foreign selling for much of 2026, and steady domestic buying has cushioned falls rather than reversed them.
The second mistake is confusing industry AUM with SIP flows. Total mutual fund AUM fell 5.1% to ₹82.64 lakh crore in September, as reported by Equentis. That fall came mainly from about ₹1.83 lakh crore of debt fund outflows, mostly from liquid and money market funds. It says nothing about retail SIP behaviour.
The third mistake is treating SIP AUM as fresh money. The ₹17.86 lakh crore SIP AUM includes years of past contributions and market gains. Only the monthly ₹32,490 crore is new money.
A Checklist for Reading the Next SIP Release
AMFI usually releases monthly data in the second week of the following month, so October numbers should arrive in mid-November. When they do, run through these points before drawing conclusions:
- Is the monthly SIP contribution still above ₹32,000 crore?
- Is the stoppage ratio below 80%, and are new registrations holding above 60 lakh?
- Are equity fund net inflows larger than that month’s NSDL FPI outflow?
- Is money moving towards large cap funds, or still crowding into small and mid caps?
- Does daily DII buying on our FII DII cash market daily summary match the scale of fund inflows?
- Is ELSS still seeing outflows, which can signal tax-driven redemptions rather than broad nervousness?
Frequently Asked Questions
What was the SIP inflow in September 2026?
AMFI data released on 12 October 2026 showed SIP inflow of ₹32,490 crore in September 2026, the highest monthly figure on record. It was up from ₹32,297 crore in August 2026 and about 10.7% higher than the ₹29,361 crore collected in September 2025.
What is the SIP stoppage ratio for September 2026?
The SIP stoppage ratio fell to 78.53% in September 2026 from 81.05% in August. It is calculated by dividing SIPs discontinued or matured (49.68 lakh) by new SIP registrations (63.26 lakh). A figure below 100% means more SIPs were started than stopped.
How many SIP accounts are active in India?
Contributing SIP accounts stood at about 10.06 crore in September 2026, according to AMFI data reported by Angel One. SIP assets under management were ₹17.86 lakh crore, about 21.6% of the total mutual fund industry AUM.
Why did mutual fund AUM fall in September 2026 when SIP flows hit a record?
Total industry AUM fell 5.1% to ₹82.64 lakh crore mainly because debt funds saw net outflows of about ₹1.83 lakh crore, largely from liquid and money market schemes. Lower market values of equity holdings also weighed on AUM. Equity funds themselves took in ₹38,307 crore of net inflows.
Do SIP inflows show up in DII buying data?
Yes, indirectly. Mutual funds are part of the DII group, so money they invest from SIPs appears in the NSE provisional DII cash figures, usually released around 6 PM IST on trading days. The match is never exact, because fund managers can hold cash or deploy it over several days.
Key Takeaways for Traders
The SIP inflow September 2026 number is a record, but it is a quiet one. Monthly contributions grew by just ₹193 crore, the stoppage ratio improved, and more than 10 crore accounts kept paying in during a month of ₹35,861 crore foreign selling. That steady base is why domestic institutions have been able to keep buying what FIIs sell.
Our view: do not trade Nifty off SIP headlines. Use them as a background check on how much domestic support exists, then watch the daily flows for timing. For the full picture, see our weekly FII DII report for the week ending 23 October and the live numbers on the FII DII data dashboard.
Sources: AMFI monthly data as reported by Angel One (October 2026), Outlook Money (12 October 2026), The Hans India (12 October 2026) and Equentis (October 2026); NSDL FPI data as compiled by Finnovate (7 October 2026).
Disclaimer: This article is for educational purposes only and is not investment advice. Please consult a SEBI-registered advisor before making investment decisions.