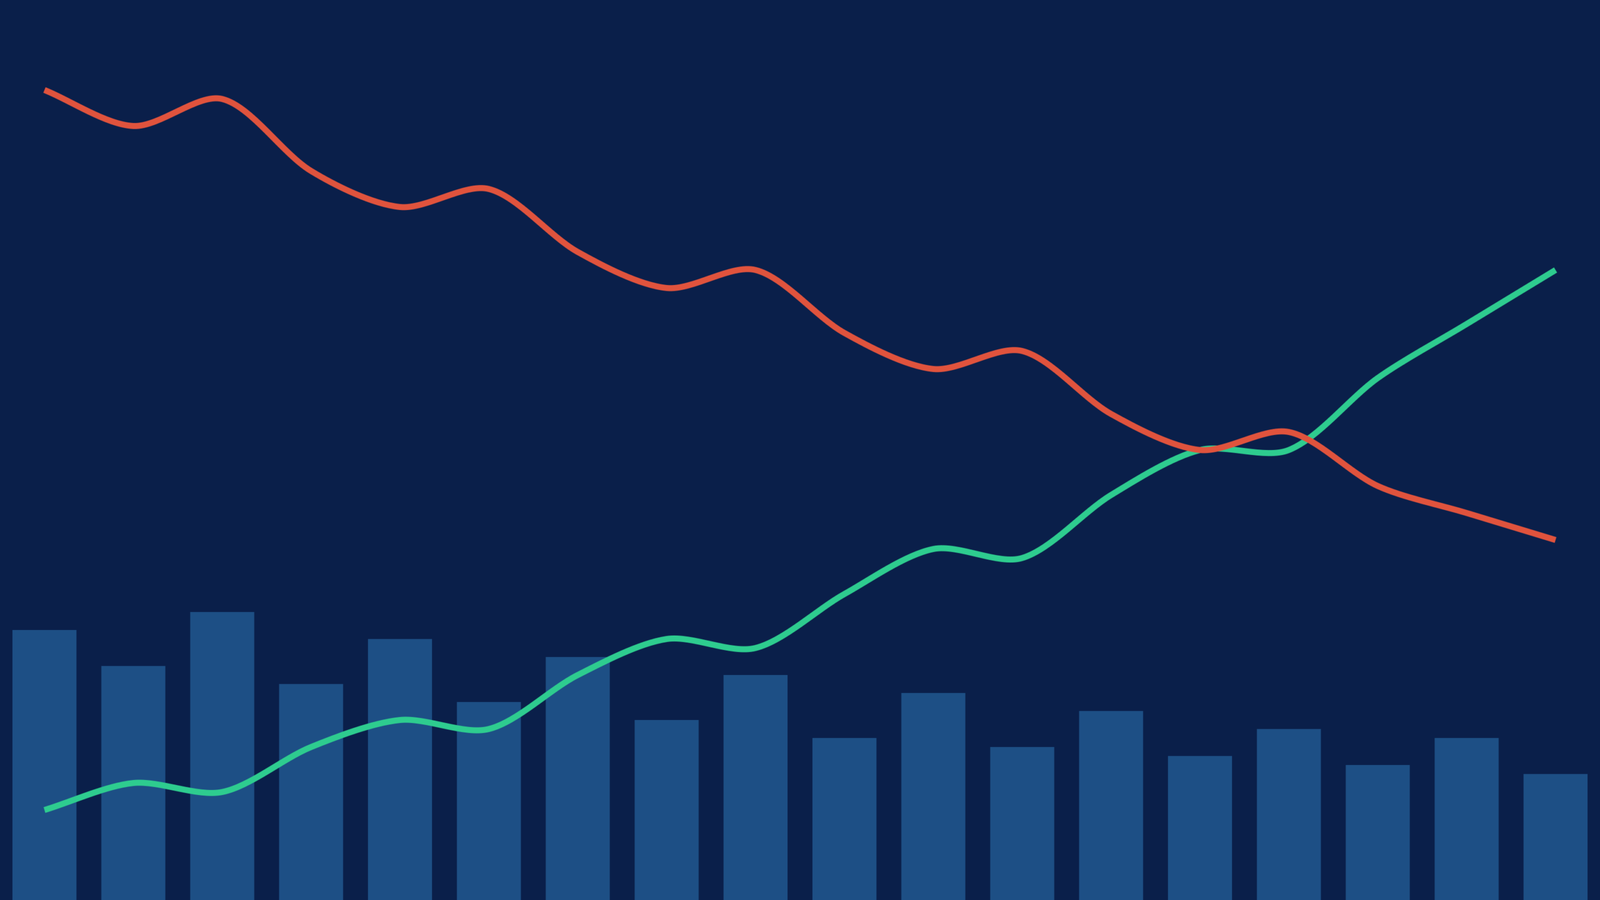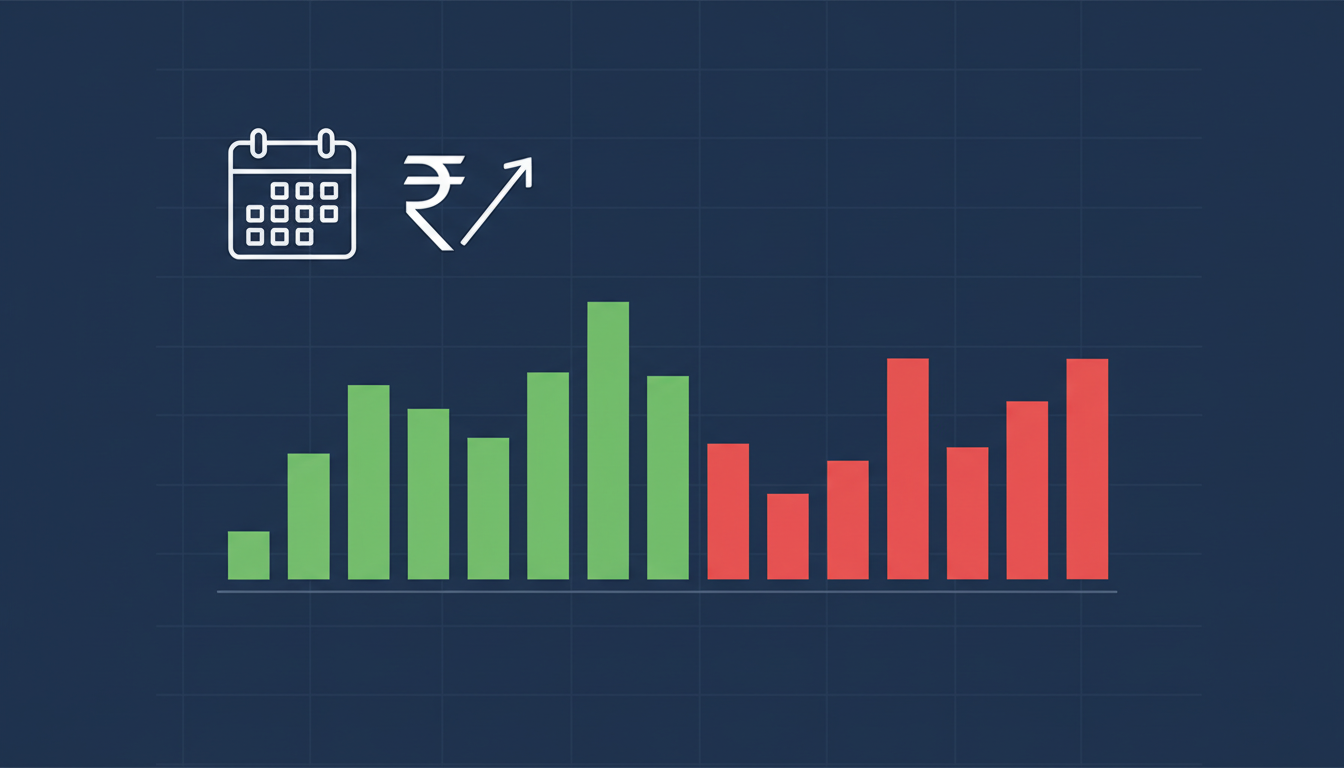
FII and DII data on a monthly basis shows the real trend that daily numbers hide. In 2026 so far (1 January to 26 October), FIIs have been net sellers of about ₹4.56 lakh crore in the cash market, while DIIs have been net buyers of about ₹7.01 lakh crore. FIIs have sold in every single month of the year, and DIIs have bought in every month.
Updated: 26 October 2026 | Data: NSE provisional cash market figures (FII/FPI and DII), compiled from NiftyTrader, Ansaar and WealthTicker
FII DII Monthly Data 2026 (Cash Market, ₹ Crore)
| Month | FII Net (₹ Cr) | DII Net (₹ Cr) | Who Won the Month |
|---|---|---|---|
| October 2026 (till 26 Oct) | -52,927 | +61,719 | DII buying larger |
| September 2026 | -44,013 | +76,030 | DII buying larger |
| August 2026 | -7,532 | +58,268 | DII buying larger |
| July 2026 | -5,779 | +35,099 | DII buying larger |
| June 2026 | -49,029 | +85,800 | DII buying larger |
| May 2026 | -55,963 | +82,669 | DII buying larger |
| April 2026 | -70,135 | +51,064 | FII selling larger |
| March 2026 | -1,22,540 | +1,42,960 | DII buying larger |
| February 2026 | -6,641 | +38,423 | DII buying larger |
| January 2026 | -41,435 | +69,221 | DII buying larger |
| 2026 total (to 26 Oct) | -4,55,994 | +7,01,253 | DIIs bought ₹2.45 lakh crore more |
For day-by-day figures, see the FII DII data today: cash market daily summary. For a detailed look at the current month, read our FII DII data October 2026 report.
What the Monthly FII and DII Data Shows in 2026
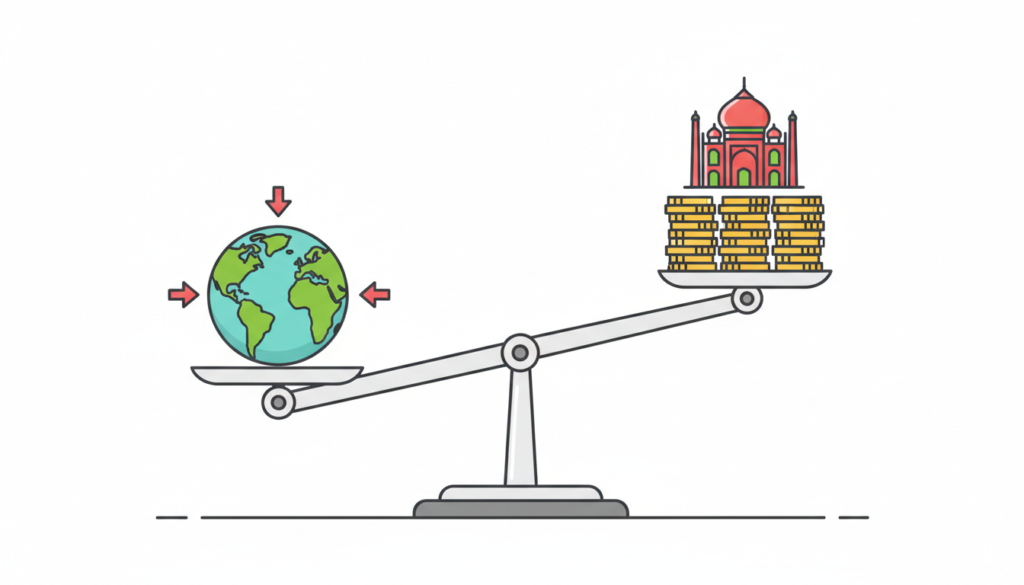
- Ten months of FII selling: FIIs have not had a single net buying month in 2026. March was the worst, with ₹1.23 lakh crore of net selling.
- A quiet patch in July and August: FII selling dropped to about ₹5,800 crore in July and ₹7,500 crore in August, the lightest months of the year, before picking up again in September and October.
- DIIs never stopped buying: DIIs bought in every month, with ₹1.43 lakh crore in March alone. Steady SIP inflows into mutual funds give them fresh money every month.
- April was the only month FIIs out-sold DIIs: FIIs sold ₹70,135 crore while DIIs bought ₹51,064 crore. In every other month DII buying was larger than FII selling.
How to Use Monthly FII DII Data
Daily FII DII numbers are noisy. A single ₹5,000 crore sell day can be a block deal or an index rebalance. Monthly totals smooth that out and show where big money is really heading.
Worked example: In March 2026, FIIs sold ₹1,22,540 crore and DIIs bought ₹1,42,960 crore. The net institutional flow was +₹20,420 crore, so domestic money more than covered foreign selling. In April, FIIs sold ₹70,135 crore and DIIs bought ₹51,064 crore, a net of −₹19,071 crore. That is the kind of month when the market comes under real pressure, because domestic buying is not enough to absorb the supply.
- Check the FII net for the month: is selling getting bigger or smaller than last month?
- Compare it with DII net: is domestic buying covering it?
- Look at FII positions in index futures with the FII long short ratio: are FIIs covering shorts?
- Confirm the daily trend in the FII DII F&O activity table before acting.
Exchange Data vs NSDL FPI Data
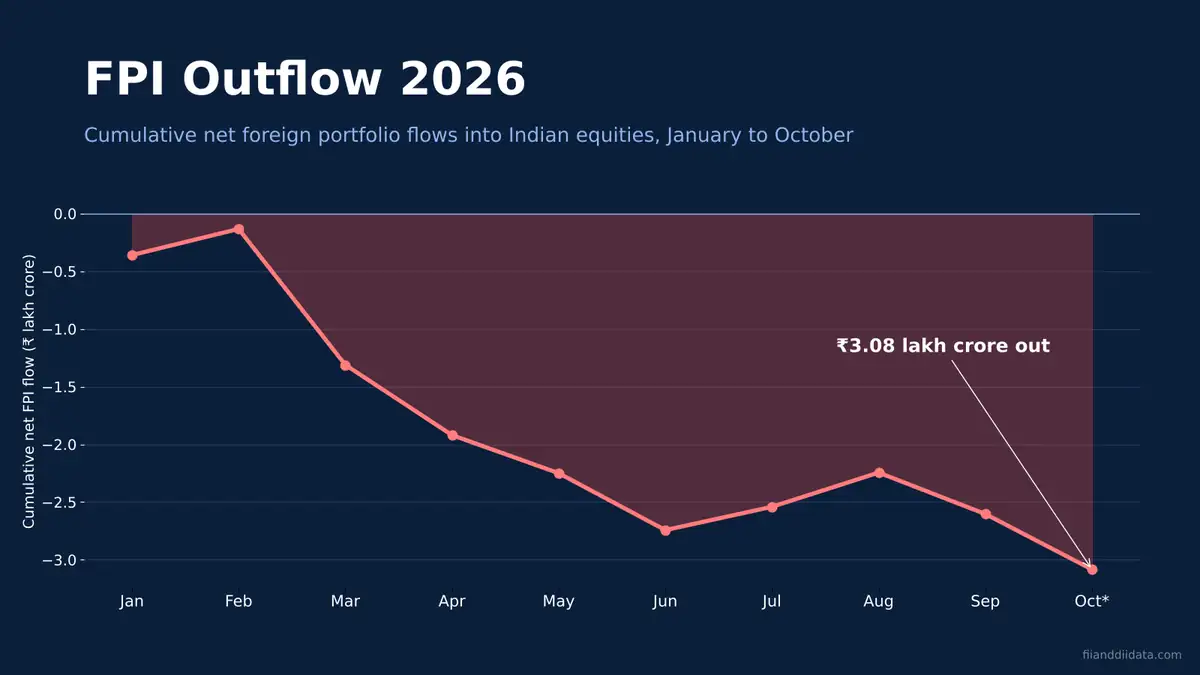
The table above uses NSE provisional cash market data. NSDL publishes its own FPI figures, which include IPO and other primary market investments and settle a day later. That is why NSDL monthly totals are often different from exchange totals. Use exchange data for market flow and NSDL for official FPI investment. Our FPI outflow 2026 report covers the NSDL side, and the FII vs FPI guide explains the two terms.
FII DII Monthly Data: FAQs
How much have FIIs sold in 2026?
From 1 January to 26 October 2026, FIIs were net sellers of about ₹4,55,994 crore in the cash market, based on NSE provisional data. DIIs were net buyers of about ₹7,01,253 crore in the same period.
Which month saw the highest FII selling in 2026?
March 2026, with net FII selling of ₹1,22,540 crore. DIIs bought ₹1,42,960 crore in the same month.
Where can I see FII DII monthly data?
This page lists month-wise FII and DII net figures for 2026 and is updated after each month ends. For daily figures, use the FII DII cash market daily summary page.
Why is NSDL FPI data different from FII DII monthly data?
NSDL FPI data includes primary market investments such as IPOs and is settled a day later, while exchange FII DII data covers only secondary market cash trades. So the two monthly totals rarely match.
Is monthly FII DII data better than daily data?
Monthly data is better for spotting the trend because single-day numbers can be distorted by block deals or index rebalancing. Daily data is better for short-term trading. Most traders use both.
Sources: NSE provisional FII/FPI and DII data via NiftyTrader, Ansaar and WealthTicker. Disclaimer: This page is for educational purposes only and is not investment advice. Please consult a SEBI-registered advisor before making investment decisions.