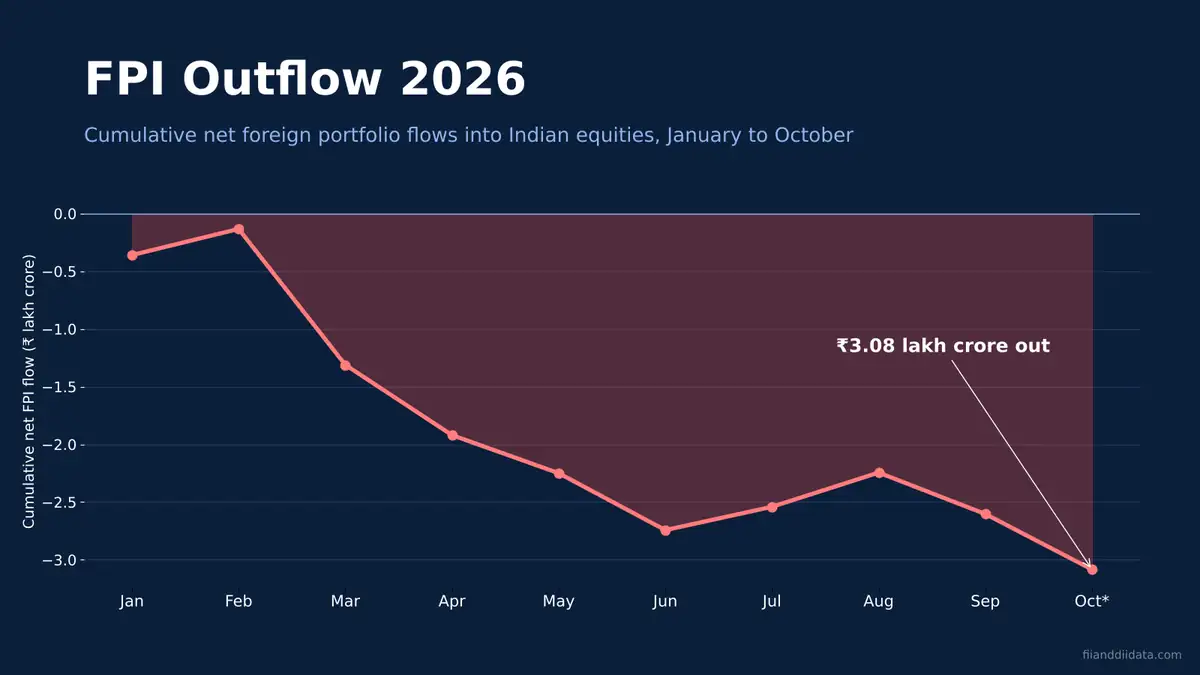
The FPI outflow 2026 stands at about ₹3.08 lakh crore, the largest yearly exit foreign portfolio investors have ever made from Indian equities. A PTI report on 25 October 2026 put October selling at ₹48,056 crore so far, after ₹35,861 crore left in September. That is almost double the ₹1.66 lakh crore that left in all of 2025. Here is the month-wise record and how to read it.
Key Takeaways
- Net FPI outflow from Indian equities in 2026 is about ₹3.08 lakh crore, a record.
- Seven of the ten months so far were outflow months; March alone lost ₹1,17,775 crore.
- Exchange selling of ₹3.64 lakh crore was partly offset by ₹56,485 crore of IPO and QIP buying.
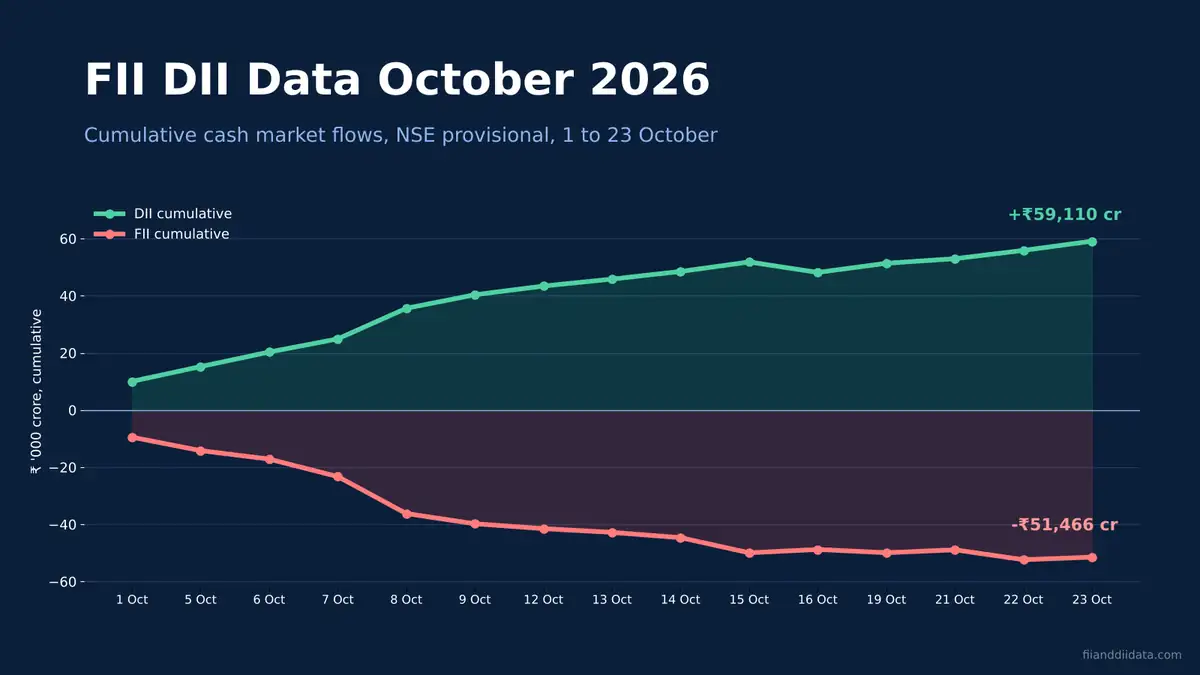
- Domestic institutions invested ₹6.83 lakh crore in 2026, more than twice the foreign exit.
- Selling slowed in the week to 23 October as US yields eased, but crude near $114 is a fresh risk.
In this article:
- FPI Outflow 2026 in Numbers
- Month-wise FPI Outflow 2026 Table
- Exchange Selling vs IPO Buying
- Why FPIs Keep Selling in 2026
- FPI Outflow vs DII Buying by Year
- Common Mistakes When Reading FPI Data
- Signs the FPI Outflow 2026 Could Slow
- FAQ
- The Bottom Line
FPI Outflow 2026 in Numbers: Where the Total Stands
FPI stands for foreign portfolio investor: overseas funds that buy listed Indian shares and bonds. Depositories NSDL and CDSL record their net flows every working day. Here are the figures that matter right now, each with the date it was reported:
- Net FPI outflow from equities in 2026 so far: about ₹3.08 lakh crore (PTI, 25 October 2026).
- Selling on stock exchanges, 1 January to 12 October: ₹3.64 lakh crore (NSDL via Business Standard, 13 October 2026).
- Money put into IPOs, QIPs and other primary deals over the same period: ₹56,485 crore.
- October 2026 so far: ₹48,056 crore of net selling, down from ₹52,100 crore reported on 18 October.
- Full-year 2025, for comparison: ₹1.66 lakh crore of net selling.
Notice that the October number shrank between 18 and 25 October. PTI reported that foreign selling moderated sharply in the week to 23 October, with FPIs net buyers on two trading days. That small improvement is the first good news in weeks, but the total is still a record.
Month-wise FPI Outflow 2026 Table
This is the month-by-month record of net FPI investment in Indian equities this year. A minus sign means foreign investors were net sellers that month.
| Month (2026) | Net FPI flow in equities (₹ crore) | Running total (₹ crore) |
|---|---|---|
| January | -35,962 | -35,962 |
| February | +22,615 | -13,347 |
| March | -1,17,775 | -1,31,122 |
| April | -60,847 | -1,91,969 |
| May | -32,963 | -2,24,932 |
| June | -49,340 | -2,74,272 |
| July | +20,200 | -2,54,072 |
| August | +29,631 | -2,24,441 |
| September | -35,861 | -2,60,302 |
| October (so far) | -48,056 | about -3,08,000 |
The running total by the end of July, ₹2,54,072 crore, matches the year-to-date figure Outlook Money reported on 1 August. Add the next three months and you land on the ₹3.08 lakh crore that PTI reported on 25 October. The numbers hold together, which matters when so many different totals circulate on social media.
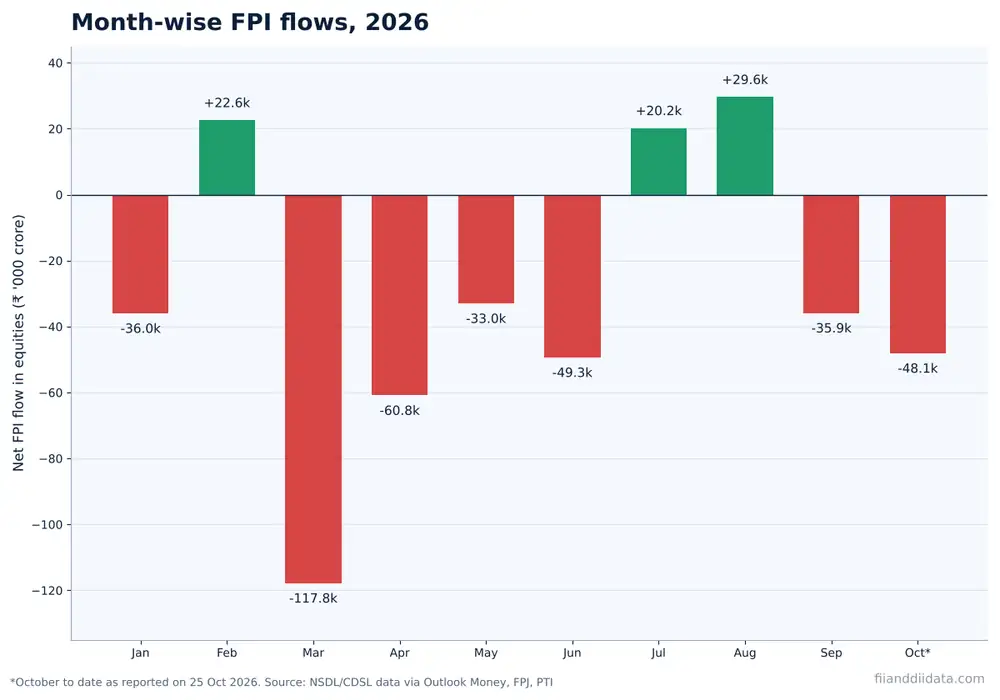
Three phases of the FPI outflow 2026
January to June was the heavy exit, with five outflow months and March as the worst. July and August brought ₹49,831 crore of buying and plenty of talk about a bottom. September and October erased that relief within about seven weeks. For the daily exchange numbers behind October, see our FII DII data for October 2026. The next question is where that money actually went.
Exchange Selling vs IPO Buying: The Split Most Reports Miss
The net figure hides two very different activities. The secondary market is where existing shares change hands on NSE and BSE. The primary market is where companies sell new shares through IPOs and QIPs (qualified institutional placements). Foreign funds have been heavy sellers in the first and steady buyers in the second.
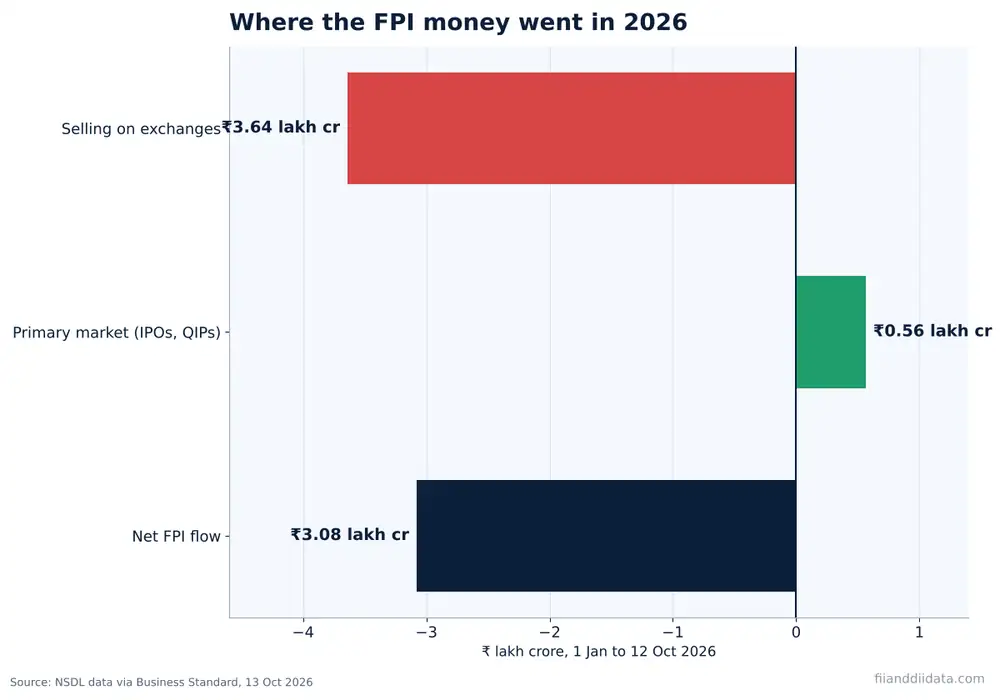
Worked example: how the FPI outflow 2026 nets out
- Exchange selling to 12 October: minus ₹3,64,000 crore.
- Primary market buying, same period: plus ₹56,485 crore.
- Net flow: -3,64,000 + 56,485 = about -₹3,07,500 crore, which rounds to the ₹3.08 lakh crore headline.
Why does this matter for a Nifty trader? IPO allotments do not lift the prices of listed index stocks. July shows it clearly: of the roughly ₹20,200 crore that came in, Outlook Money’s breakdown of NSDL data showed only ₹6,731 crore went through exchange purchases. Large new issues matter in October too: PTI noted that the ₹30,213 crore Jio Platforms IPO temporarily absorbed market liquidity, a theme we covered in FPIs selling stocks but buying IPOs in October. So what is pushing foreign money out of listed shares?
Why FPIs Keep Selling in 2026
The drivers are mostly global. Analysts quoted by PTI on 25 October 2026 and by Business Standard on 13 October pointed to the same pressures:
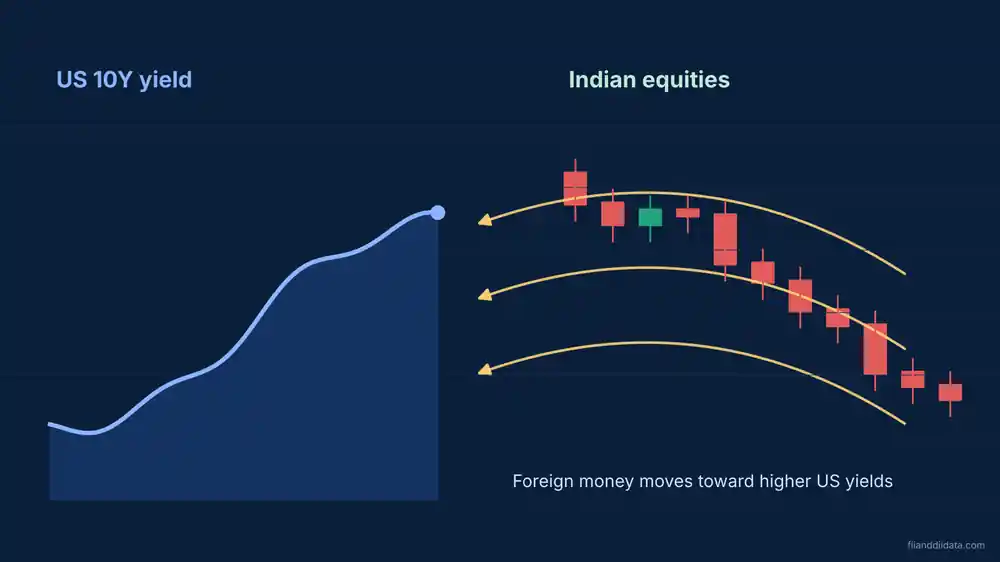
- US bond yields: The US 10-year Treasury yield climbed above 5.2% in mid-October and touched 5.36% before easing to around 5%. A safe 5% dollar return competes directly with Indian equities.
- Crude oil: Brent December futures traded near $114 a barrel on 23 October, a five-month high, which raises India’s import bill.
- The rupee: PTI reported it had firmed to 94.94 per dollar by 25 October, but a weak rupee earlier in the year cut into dollar returns.
- Earnings and the AI trade: Choice Wealth’s Dheeraj Gaur cited weak earnings, and Business Standard reported money rotating into AI and chip stocks in North Asia.
Geojit’s V K Vijayakumar linked the slower selling in late October to falling US yields, a firmer rupee and attractive large-cap valuations. We look at each driver in detail in our explainer on the reasons behind the FPI outflow in 2026. The bigger question is who has been buying all these shares.
FPI Outflow 2026 vs DII Buying by Year
Domestic institutional investors (DIIs) such as mutual funds, insurers and pension funds have absorbed the selling. The table compares the last three years.
| Year | Net FPI flow in equities | Net DII investment |
|---|---|---|
| 2024 | +₹427 crore | +₹5.26 lakh crore |
| 2025 | -₹1.66 lakh crore | +₹7.88 lakh crore |
| 2026 (to mid-October) | -₹3.08 lakh crore | +₹6.83 lakh crore |
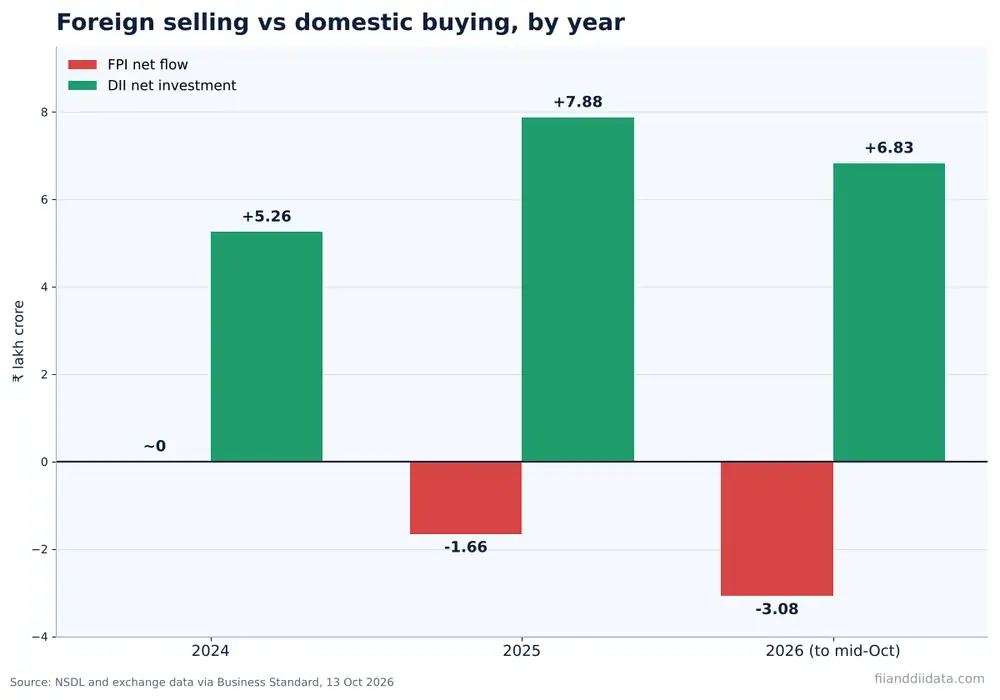
Ownership has shifted as a result. A Motilal Oswal report cited by Outlook Money said DII ownership in Nifty 500 companies reached a record 21% in June 2026, while FII ownership fell to a record low of 17%. Our guide on the difference between FII and DII explains why the two groups behave so differently.
Even so, domestic money has cushioned prices rather than lifted them. Business Standard reported the Nifty 50 down 14.4% for the year as of 13 October. That gap between flows and prices is where most reading errors begin.
Common Mistakes When Reading FPI Outflow Data
- Treating every inflow month as exchange buying. July 2026 looked positive, but two-thirds of the money went into new issues.
- Mixing NSE and NSDL numbers. NSE’s provisional FII/DII cash data comes around 6 PM IST on trading days and covers only exchange trades. NSDL’s final FPI data arrives the next working day and includes primary deals. For 1 to 12 October, NSE showed about ₹41,487 crore of FII selling while NSDL showed ₹47,417 crore. Our FII vs FPI guide explains the overlap.
- Reading one green day as a turn. FPIs were marginal buyers on 16 October, yet October still ended the week deep in the red.
- Ignoring the derivatives side. Cash selling with fresh index futures shorts is a stronger signal than cash selling alone.
You can track the full monthly picture on our FII DII monthly data page. With those traps in mind, here is what we would want to see before calling the end of the selling.
Signs the FPI Outflow 2026 Could Slow: A Trader’s Checklist
- Five or more straight sessions of net FII buying on the daily FII DII cash market summary.
- Monthly NSDL inflows driven by exchange purchases, not just IPO money.
- The US 10-year yield holding clearly below 5%.
- Brent crude falling back from the $110 to $115 zone.
- A stable or firmer rupee against the dollar.
- FIIs cutting index futures shorts in participant wise open interest data.
In the week to 23 October, two of these boxes moved the right way: yields eased and the rupee firmed. Crude went the other way. Bajaj Broking’s Pabitro Mukherjee said markets will watch the US Fed and Bank of Japan decisions, Brent crude and the earnings season next.
Frequently Asked Questions
How much is the FPI outflow 2026 so far?
A PTI report dated 25 October 2026 put the net FPI outflow from Indian equities in 2026 at about ₹3.08 lakh crore, the largest annual exit on record. The full-year outflow in 2025 was ₹1.66 lakh crore.
Which month saw the highest FPI selling in 2026?
March 2026 was the worst month, with net FPI outflows of ₹1,17,775 crore from equities. April followed with ₹60,847 crore of selling.
In which months of 2026 did FPIs buy Indian stocks?
FPIs were net buyers in only three months: February (₹22,615 crore), July (₹20,200 crore) and August (₹29,631 crore). In July, most of the money went into the primary market rather than exchange purchases.
Why is NSDL FPI data different from NSE FII data?
NSE provisional FII/DII data, released around 6 PM IST on trading days, covers only exchange trades. NSDL FPI data arrives the next working day and also includes IPOs, QIPs and other primary market deals, so the two numbers rarely match.
Who is buying the shares FPIs are selling?
Domestic institutional investors such as mutual funds, insurers and pension funds. DIIs invested ₹6.83 lakh crore in Indian equities in 2026 as of mid-October, more than double the net FPI outflow, helped by steady SIP inflows.
The Bottom Line
The FPI outflow 2026 is a record, but the month-wise data shows a long grind rather than a single crash. Seven of ten months have been outflow months, and the July and August relief disappeared quickly. Exchange selling has been even heavier than the headline suggests, because IPO buying flatters the net figure.
The cushion is real too. Domestic institutions now own more of Indian companies than foreign funds do, and they have bought more than twice what foreigners sold. Our practical next step: track the combined flow every evening on our FII DII data dashboard, and treat a run of exchange buying alongside falling US yields as the signal worth acting on.
Sources: NSDL data via Business Standard (13 October 2026); Outlook Money (1 August 2026); PTI via Free Press Journal (18 October 2026) and Millennium Post (25 October 2026); Kotak Neo market close report (23 October 2026); Motilal Oswal ownership report as cited by Outlook Money.
Disclaimer: This article is for educational purposes only and is not investment advice. Please consult a SEBI-registered advisor before making investment decisions.