Key Takeaways
- FII delivery buying means shares that foreign investors buy and actually take into their demat accounts, instead of squaring off the same day.
- Delivery percentage is delivery volume divided by total traded volume, multiplied by 100. A higher number points to conviction.
- The daily FII number on NSE is provisional cash-market data. NSDL publishes the final FPI figure later, and it includes primary-market activity.
- F&O expiry can add physical delivery to cash buying, so one big day does not always mean fresh money.
Every evening, the headline reads “FIIs bought Rs X crore”. Few readers ask the next question: was that real, lasting buying, or just trading that happened to end the day net positive? That is where FII delivery buying helps. This guide explains it the way an Indian market analyst would, with a worked example, a data-source comparison and the traps to avoid. For the day’s numbers, keep our FII and DII data page open, and check FII DII data today before you act on any reading.
Table of Contents
- What is FII delivery buying?
- How delivery percentage works
- Why delivery matters more than turnover
- NSE provisional vs NSDL final data
- How to read FII delivery buying step by step
- The F&O expiry distortion
- Common mistakes
- FAQs
- The Bottom Line
What Is FII Delivery Buying?
In the cash market, a trade ends one of two ways. It is squared off within the day (intraday), or it is settled by delivery, which means the buyer receives shares in the demat account and the seller hands them over. Delivery buying is the second kind. When we say FII delivery buying, we mean foreign portfolio investors (FPIs) accumulating shares they intend to hold, at least beyond that session.
One important caveat: exchanges publish delivery data per stock for all participants together. The public daily FII/FPI figure is a net buy or sell number. Nobody publishes “FII delivery volume” stock by stock every evening, so the phrase is used loosely. In practice, analysts combine two things: the FII net cash flow, and the delivery percentage of the stocks where foreign money is concentrated. If you are new to the basics, start with what FII and DII mean.
How Delivery Percentage Works
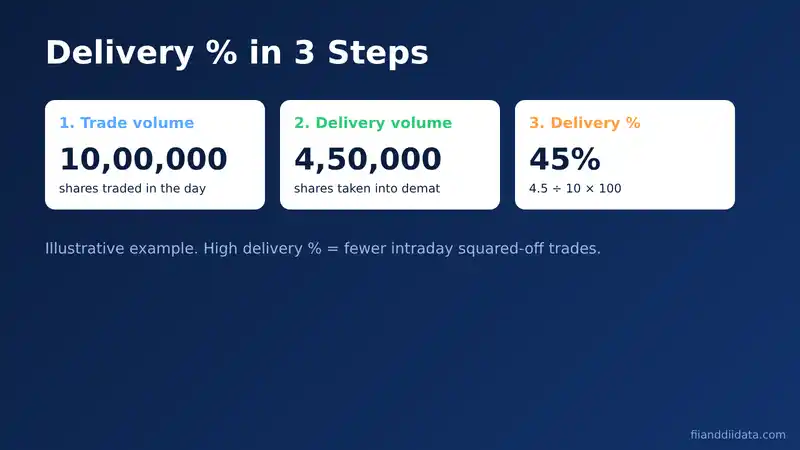
Delivery percentage = (delivery volume / total traded volume) x 100. It tells you what share of the day’s trading ended in actual share transfers.
Illustrative example: suppose a stock trades 10,00,000 shares in a session and 4,50,000 of them are marked for delivery. Delivery percentage = 4,50,000 / 10,00,000 x 100 = 45%. The other 55% was intraday churn. These are made-up round numbers to show the arithmetic, not a real stock.
Why Delivery Matters More Than Turnover
Turnover can be inflated by algorithmic and intraday traders who buy and sell the same shares many times. Delivery cannot be faked that easily, because shares must actually move between demat accounts. When a stock sees strong price gains along with a rising delivery percentage and net FII buying, the move has support from investors who intend to hold. When price rises on low delivery, it is often short-term trading.
Under SEBI’s framework, cash trades settle on a delivery basis, and settlement is netted per participant. That is why intraday positions cancel out and only the net quantity is delivered. You can read more about the regulator’s market rules on the SEBI website.
NSE Provisional vs NSDL Final Data
Two sources get mixed up constantly. NSE publishes provisional FII/DII cash-market figures in the evening, around 6 PM IST. NSDL publishes the FPI data later, usually the next working day, and its figures also cover the primary market (IPOs, block deals and similar routes). Because the scope differs, the two numbers rarely match exactly. Check the originals at NSE India and NSDL FPI Monitor.
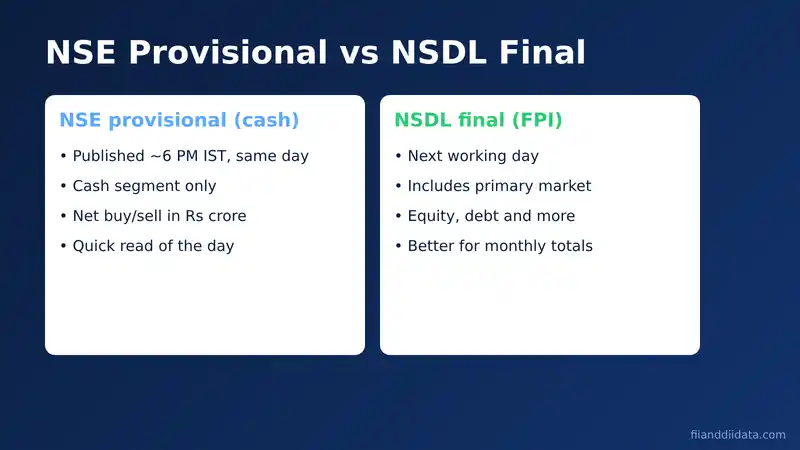
| Point | NSE provisional | NSDL final |
|---|---|---|
| Timing | Same evening, about 6 PM IST | Next working day |
| Scope | Cash market only | Includes primary market |
| Status | Provisional, can be revised | Final |
| Best use | Quick daily read | Weekly and monthly trend checks |
For a deeper look at how the cash numbers are built, see our guides to FII cash market data and FII net investment.
How to Read FII Delivery Buying Step by Step
- Start with the net number. Check whether FIIs were net buyers in the cash segment. Our walkthrough on FII buying and selling shows how.
- Look for persistence. One green day is noise. Several net-buying sessions in a row suggest accumulation.
- Check delivery percentage in index heavyweights. Banks, IT and large caps are where foreign money usually sits. A delivery percentage above the stock’s own recent average is a better sign than any fixed cut-off.
- Compare with DIIs. If DIIs are selling while FIIs buy, the market may be passing ownership from domestic to foreign hands. Our piece on DII selling explains that side.
- Cross-check with NSDL the next day. Confirm the final figure before drawing weekly conclusions.
The F&O Expiry Distortion
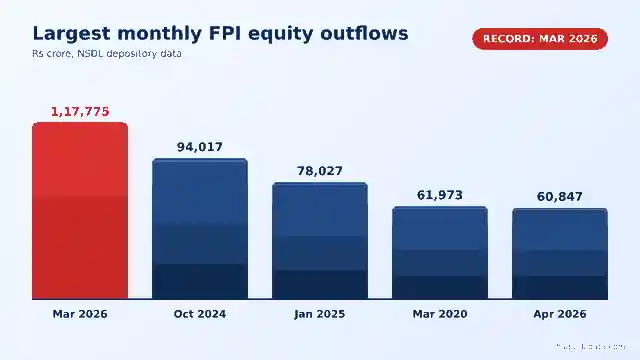
Stock derivatives in India are physically settled. If a large futures or options position is held to expiry, the shares are actually delivered, and that delivery can appear in the cash-market data as buying or selling. Press reports around expiry sessions have described cases where a single day’s FPI cash figure looked unusually large partly because of this settlement, not fresh investment. The graphic below shows the idea using a reported October 2025 example. Treat the exact figures as reported numbers and verify them on NSE before reusing them.
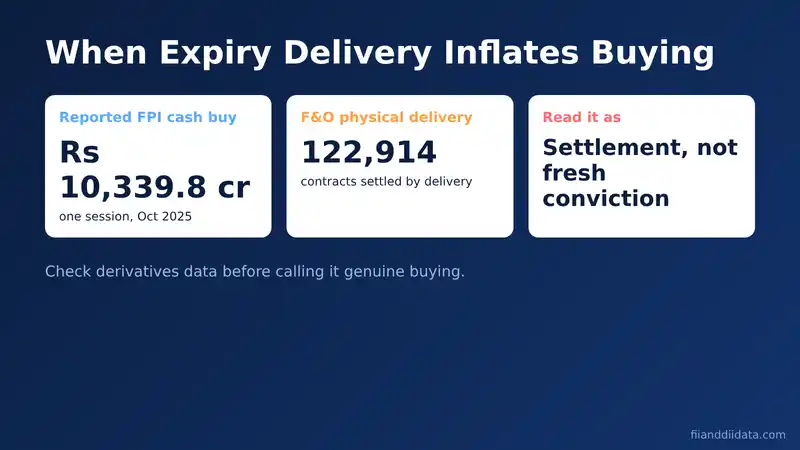
The practical lesson: on and just after monthly expiry, compare the cash number with the derivatives picture. Our guides to F&O in India and cash data vs participant-wise open interest show how to do that.
A Worked Scenario: Putting the Pieces Together
Consider a simple, hypothetical week. On Monday and Tuesday, FIIs show modest net buying in the NSE provisional data. On Wednesday the net figure is small and negative. Thursday and Friday turn positive again. A beginner sees a mixed week. An analyst asks three follow-up questions before forming a view.
- Did the buying sit in a few large stocks or spread widely? Broad participation across banks, IT and capital goods is a healthier sign than one heavyweight carrying the whole number.
- Was delivery percentage rising in those names? If a stock’s delivery percentage moves above its own recent average on net-buying days, buyers are holding, not flipping.
- Did NSDL’s final data agree? If the next-day NSDL figure shows a similar direction, the provisional read was reliable. If it differs sharply, find out whether primary-market activity explains the gap.
Only after all three checks does the week earn a label such as “steady accumulation” or “noisy trading”. This slower habit protects you from the most common error in flow analysis, which is reacting to a single headline number.
A Quick Checklist Before You Trust a Reading
- Is the figure provisional (NSE) or final (NSDL)?
- Is it a monthly expiry week, when physical settlement can distort cash flows?
- Is the same direction visible for at least three sessions?
- Do DII flows move the opposite way, and by how much?
- Does the derivatives side, such as futures and options positions, tell the same story? See FII futures data and FII options data.
What Delivery Data Cannot Tell You
Delivery figures show that shares changed hands for holding, but not who the final holder is. A delivery percentage of 60% in a stock may reflect mutual funds, insurers, retail investors or foreign funds. That is why we pair delivery with the net FII figure instead of treating either in isolation. For a sense of how large each group is, see FII vs mutual funds and DII shareholding.
Delivery data also says nothing about intent beyond the settlement date. A foreign fund can take delivery on Monday and sell on Wednesday. Over longer windows of weeks and months, persistent net buying combined with healthy delivery is more meaningful than any single day. Treat the numbers as evidence about participation and conviction, then combine them with valuations, earnings and global cues such as the dollar and US yields before you make any decision.
Finally, remember that FPI flows respond to factors you cannot see in the cash tape: currency moves, global risk appetite, index-weight changes and tax rules such as those covered in our FPI tax guide. A reading is a clue, not a conclusion, and the discipline of cross-checking is what separates a careful analyst from a headline follower.
Common Mistakes to Avoid
- Treating one big FII buying day as a trend.
- Assuming the provisional NSE figure equals the final NSDL figure.
- Ignoring expiry-day settlement effects.
- Reading a high delivery percentage as FII-only. It includes every participant.
- Using flows alone as a buy or sell signal. They are context, not advice.
FAQs on FII Delivery Buying
What is FII delivery buying?
It is foreign institutional buying where shares are taken into the demat account instead of being squared off the same day. It is read together with net FII cash flow and delivery percentage.
How is delivery percentage calculated?
Delivery percentage equals delivery volume divided by total traded volume, multiplied by 100. For example, 4,50,000 delivery shares out of 10,00,000 traded gives 45%.
Does NSE publish FII delivery data stock by stock?
No. NSE publishes delivery data for all participants combined, and a separate net FII/DII cash figure. Analysts combine the two for an informed view.
Why do NSE and NSDL FPI numbers differ?
NSE figures are provisional and cover the cash market. NSDL figures are final, come later and include primary-market activity.
Can F&O expiry inflate FII buying?
Yes. Physical settlement of stock derivatives can add delivered shares to cash-market flows, so a large expiry-day number may not be fresh investment.
The Bottom Line
FII delivery buying is best used as a quality filter. Net FII buying tells you how much; delivery percentage and persistence tell you how real. Always check the final NSDL figure and watch expiry days. Daily readings, plus our weekly FII DII report, keep the picture honest.
Sources: NSE India, NSDL FPI Monitor, SEBI.
Disclaimer: This article is for education only and is not investment advice. Markets carry risk; consult a SEBI-registered adviser before investing.