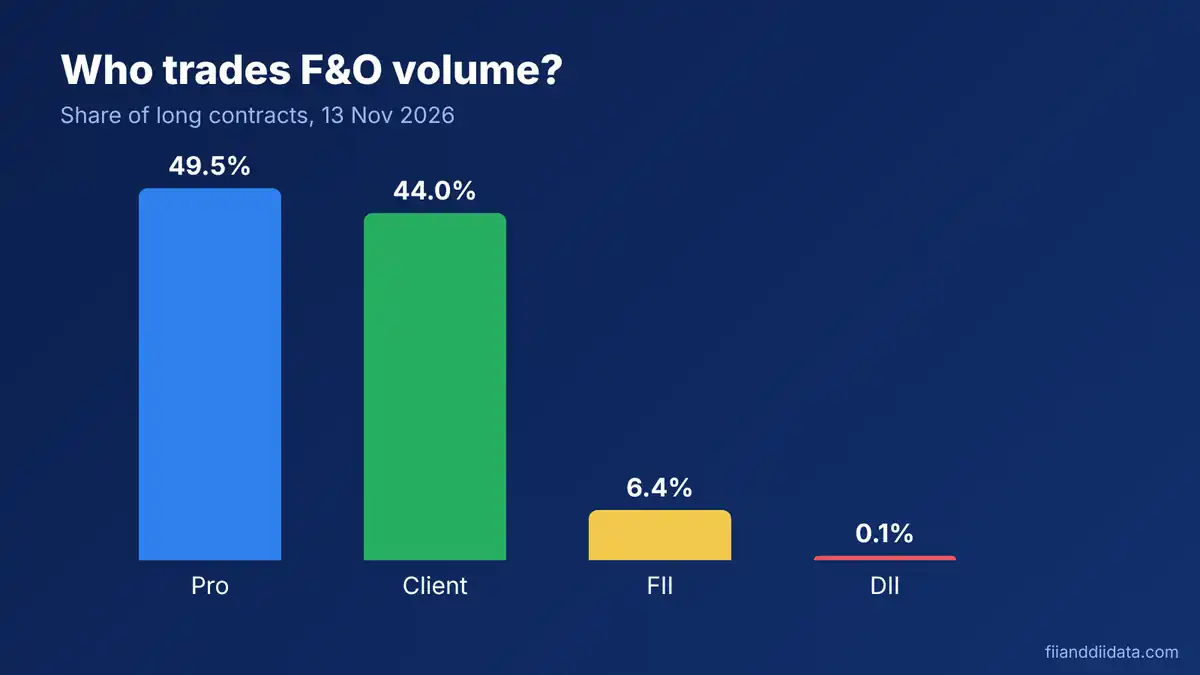
Participant wise trading volume shows how many futures and options contracts each group of traders bought and sold in a day. On 13 Nov 2026, Pro traders took 49.5% of long F&O contracts traded, Clients 44.0%, FIIs 6.4% and DIIs 0.1%, based on the NSE file. This guide explains how to read it, what it cannot tell you, and how to pair it with open interest.
Key Takeaways
- NSE splits F&O trading into four groups: Client, DII, FII and Pro.
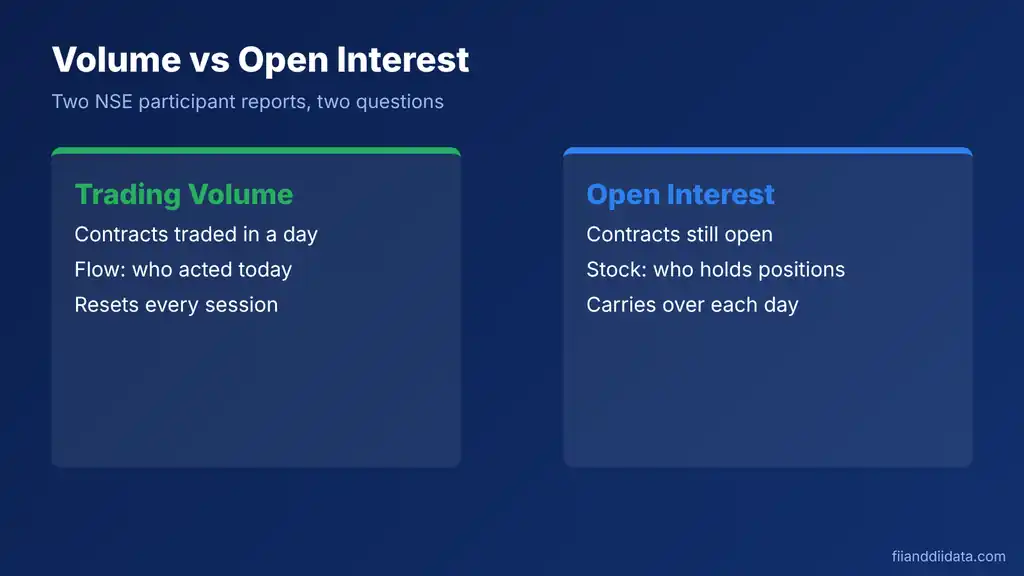
- Volume counts contracts traded in a day. Open interest counts contracts still open at the close.
- On 13 Nov 2026, FIIs held 6.4% of long F&O contracts traded but 14.0% in index futures.
- DIIs were almost absent from F&O volume at 0.1% of long contracts.
- Volume shows activity. Only open interest shows who is still holding positions.
In this guide
- What participant wise trading volume means
- Volume versus open interest
- Latest data: 13 Nov 2026
- How each group trades differently
- A worked example
- A four step daily checklist
- Common mistakes
- Using it with Nifty and Bank Nifty
- Related reports on this site
- FAQ
- The Bottom Line
What participant wise trading volume means
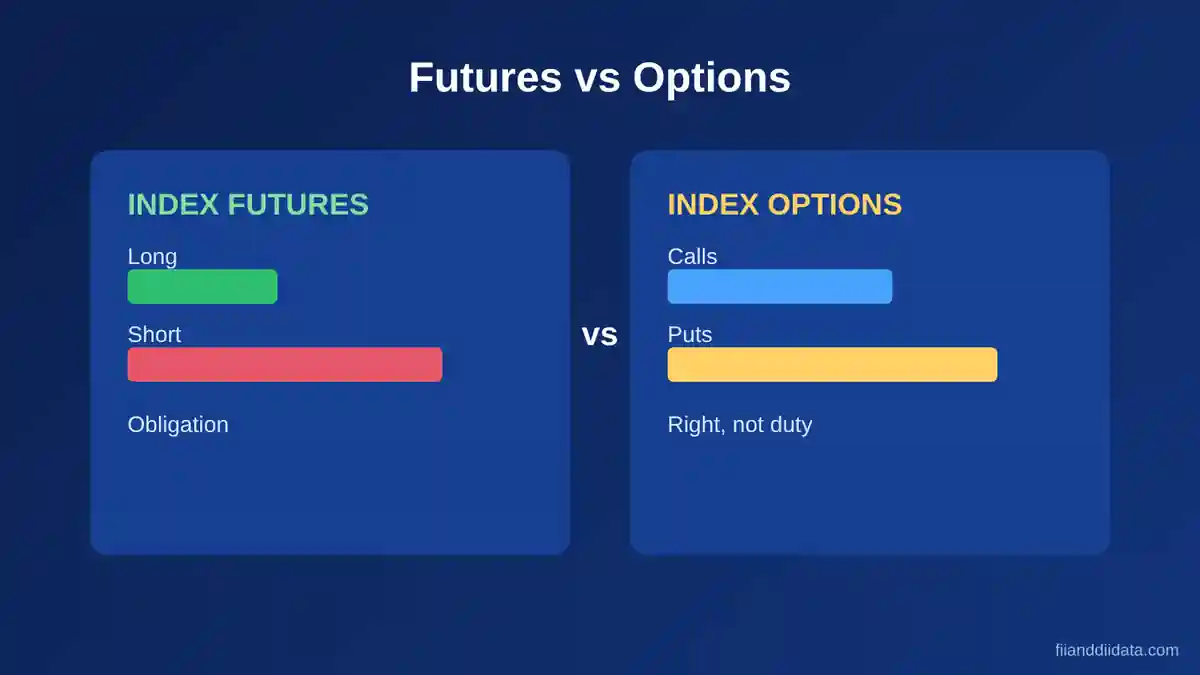
Every trading day, the National Stock Exchange (NSE) publishes a report that splits F&O activity by who is trading. The report names four participant types: Client, DII, FII and Pro. For each type, it lists the contracts bought (long) and sold (short) in index futures, stock futures, index options and stock options. Options are split further into calls and puts.
The four groups are easy to mix up, so here is what each one means in NSE data:
- Client: individual and most other investors who trade through a broker.
- Pro: proprietary traders who trade with their own money, including broker proprietary desks.
- FII: foreign institutional investors, also called foreign portfolio investors (FPIs).
- DII: domestic institutions such as mutual funds and insurers.
NSE releases the file after the market closes, so it describes the day that just ended and not the trades of the current hour. You can download it from the NSE derivatives reports page. The sections below show how to read it without getting lost in the columns.
Why the report matters for Nifty traders
The cash market report tells you what FIIs and DIIs bought or sold in shares. It says little about how they position in derivatives. The volume file fills that gap. It shows which groups drive daily F&O turnover, and it helps you judge whether a big move in Nifty or Bank Nifty came from institutions or from Pro and Client flow. Next, we separate volume from open interest, because the two are often confused.
Volume versus open interest
Volume is the number of contracts that changed hands during the day. A trader who buys and sells the same contract within an hour adds to volume twice, yet leaves no position behind. Open interest (OI) counts contracts that are still open at the close. It changes only when a new position is created or an old one is closed.
This is why the volume file alone can mislead. A group can show high volume and still end the day with a small net position. To see who actually holds exposure, read the participant wise open interest data next to the volume file. Volume tells you who was busy. OI tells you who is still holding.
Latest data: participant wise trading volume on 13 Nov 2026
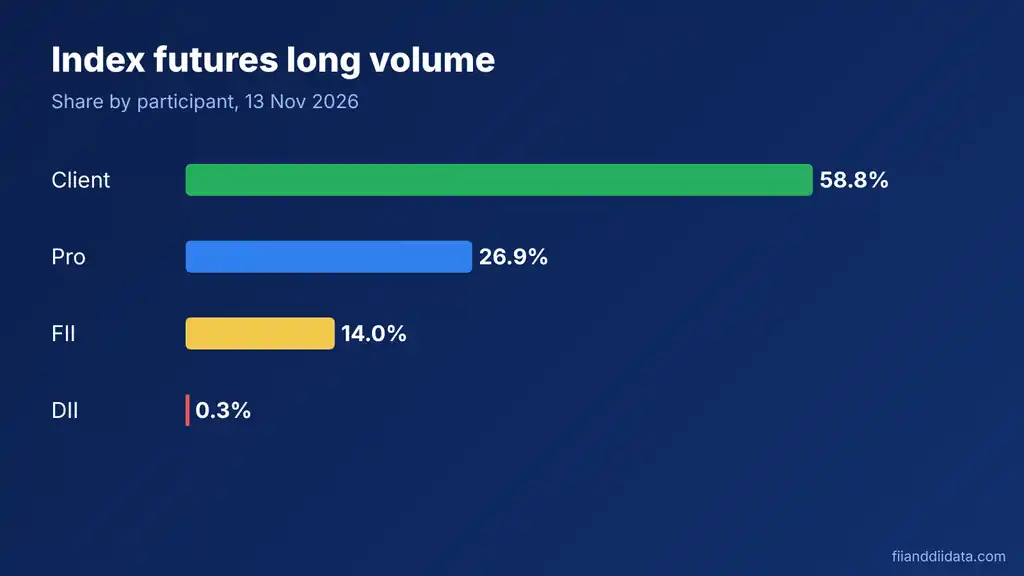
We read the NSE participant wise trading volume file for Friday, 13 Nov 2026. The table shows each group’s share of all long contracts traded, first across the whole F&O segment and then in index futures alone. Long means a contract bought. We use shares rather than raw counts so the picture is easy to compare.
| Participant | Share of long F&O contracts | Share of long index futures contracts |
|---|---|---|
| Client | 44.0% | 58.8% |
| Pro | 49.5% | 26.9% |
| FII | 6.4% | 14.0% |
| DII | 0.1% | 0.3% |
Pro traders led the full F&O segment with 49.5% of long contracts. Clients followed at 44.0%. FIIs were a small slice at 6.4%, and DIIs were close to zero at 0.1%. The picture changes in index futures, which we look at next.
Participant wise trading volume in index futures
In index futures, Clients took 58.8% of long contracts and Pro fell to 26.9%. The FII share more than doubled to 14.0%. Out of every 1,000 long index futures contracts traded on 13 Nov 2026, about 588 had a Client on the buy side and about 140 had an FII. That higher FII share fits their usual habit of using index futures to adjust overall market exposure.
For the cash side of the same session, check FII DII data today. Cash and derivatives often tell different stories on the same day.
How each group trades differently
The same file is read differently depending on the group. Treat each one as a different type of trader with a different goal.
- FIIs: large and slow to turn. They favour index futures to change exposure to the whole market, and index options to hedge. A shift in their share across several days matters more than one day.
- DIIs: a very small share of F&O volume. They mostly use derivatives sparingly, often for hedging. Their action shows up better in the cash market.
- Pro: fast and high turnover. Their volume is large because they trade in and out many times a day, so a high Pro share does not signal direction.
- Clients: the largest and most mixed group. Their share rises in index futures and options when retail interest is high.
If you follow options positioning, pair this section with the FII options activity tracker. It shows what FIIs do in calls and puts, which the share table above does not break out.
A worked example: matching volume with open interest
Net volume is simple: contracts bought minus contracts sold. A positive number means a group bought more than it sold that day. Here is a real check from our own data.
On 12 Nov 2026, the volume file showed FII net volume of +20,694 contracts. The participant wise open interest file for the same day showed their net short position getting smaller by the same 20,694 contracts. In plain words, FIIs bought 20,694 more contracts than they sold, and the open interest file shows that this buying reduced an existing short position.
This is the main reason to read both files. The volume file says FIIs were net buyers. The OI file says what that buying did: it reduced a bearish position, which is different from adding a bullish one. Net buying that only covers shorts is a softer signal than net buying that builds new longs.
A four step daily checklist
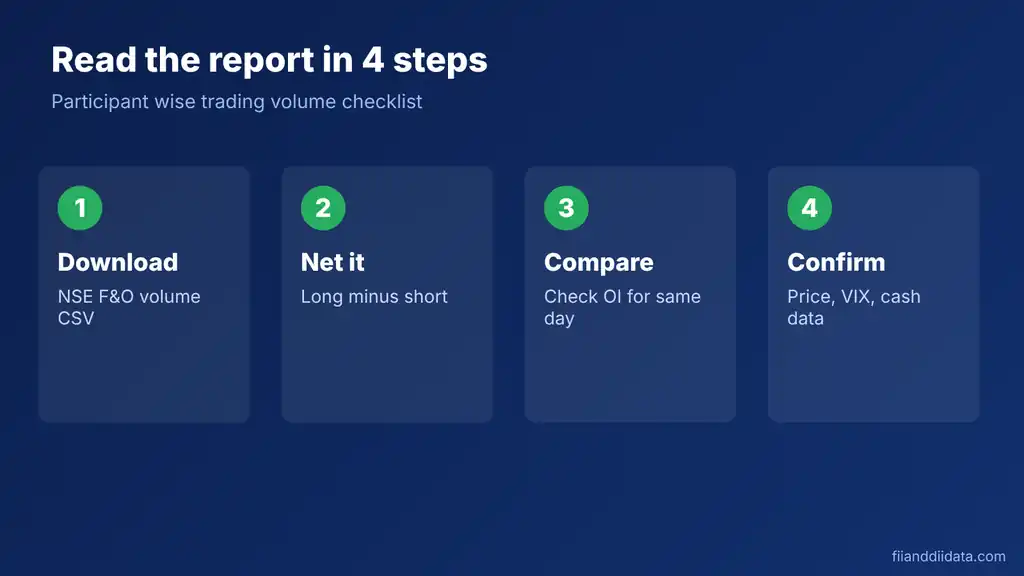
Use this routine each evening after NSE posts the files. It takes about five minutes once you know where each number sits.
- Download: get the participant wise trading volume file for the day from the NSE derivatives reports page.
- Net it: for FII and Pro, subtract short from long in index futures and index options.
- Compare: check today’s share against the last five sessions. A jump in the FII share matters more than the share itself.
- Confirm: open the participant wise OI file and check whether the net volume added positions or closed them.
Common mistakes to avoid
- Treating volume as a position. A trader who buys and sells in the same day can show large volume and hold nothing.
- Reading Pro volume as direction. Pro turnover is high by design, so a large share says little about the market view.
- Judging one day. One session can be driven by expiry or a single large trade. Compare a week of data.
- Ignoring options. Buying a put adds long contracts but is a bearish bet. Always check calls and puts, not only the long total.
- Mixing cash and F&O. FIIs can sell shares and buy index futures on the same day. The two reports answer different questions.
How to use participant wise trading volume with Nifty and Bank Nifty
One day of data is only a snapshot. The value comes from a routine that links the volume file to what the index did. Here are four common situations and how to read them.
- FII share of index futures rises and Nifty rises: check the open interest file. If FIIs added long positions, the move has institutional backing. If they only covered shorts, treat it as a weaker signal.
- Pro share jumps on an expiry day: this is usually intraday churn. It adds to volume but says little about direction.
- Client share jumps in index options: retail interest is high. Some traders treat crowded retail positioning as a caution flag, although it is not a rule.
- DII share stays near zero: this is normal. Look at the cash market report for DII activity instead.
To build your own baseline, keep a simple sheet with five columns: date, FII share of index futures, FII net volume, change in FII net open interest, and the Nifty close change. After ten sessions, you will see what a normal FII share looks like. The 14.0% recorded on 13 Nov 2026 is one data point. It becomes useful only when you compare it with your own history.
Also remember what the file leaves out. It does not show strike prices, expiry dates or whether a position is a hedge against a share portfolio. A large FII short in index futures can be a hedge on a big cash holding, not a bearish view. That is why we suggest reading it together with cash flows, open interest and options data before drawing any conclusion.
Related reports on this site
The volume file is one piece of a larger picture. Our FII and DII data home page gathers the main reports in one place. For the month-by-month view of institutional flows, see the FII DII monthly data page. For earlier dates in the cash segment, use the FII DII data archive. You can also browse our latest articles for explainers on other market terms.
FAQ
What is participant wise trading volume?
It is an NSE report that splits daily F&O contracts bought and sold by four groups: Client, DII, FII and Pro. It counts contracts traded during the day, not positions still open.
Where can I find the NSE participant wise trading volume file?
NSE posts it on its derivatives reports page after the market closes each trading day. It is released as a downloadable file, so check it in the evening and not during market hours.
What is the difference between participant wise volume and open interest?
Volume counts every contract traded in a day. Open interest counts contracts still open at the close. Volume shows activity, while open interest shows who holds positions.
Who are Pro traders in NSE data?
Pro traders are proprietary traders who trade with their own money, including broker proprietary desks. They trade in and out often, so their volume is high.
Does high FII volume mean FIIs are bullish?
Not by itself. High volume only shows activity. Check net volume, calls versus puts, and the open interest file before reading a view into it.
The Bottom Line
Participant wise trading volume tells you who is busy in F&O. On 13 Nov 2026, Pro and Client traders drove most of the long contracts, while FIIs were a small but meaningful 14.0% of index futures. DIIs barely showed up. That split alone explains why F&O volume and cash market flows can point in different directions.
The report has limits. It cannot show whether a trade opened or closed a position, and it cannot show intent. Use it as the first step, then confirm with open interest.
Your next step: tonight, download the volume and OI files side by side and run the four step checklist once. After a week, the pattern in the FII share becomes much easier to spot.
Sources: NSE derivatives reports, participant wise trading volume and open interest files for 12 and 13 Nov 2026; SEBI for participant categories and market rules.
Disclaimer: This article is for educational purposes only and is not investment advice. Please consult a SEBI-registered advisor before making investment decisions.