FII data impact on Nifty is the link people try to find between what foreign investors buy or sell each day and where the Nifty 50 closes. The link exists, but it is loose. This guide shows how to read the numbers, where they come from, and why a day of heavy foreign buying can still end with the index lower.
Key Takeaways
- FII data impact on Nifty is real but partial. Foreign flows are one input among many, so they explain some days well and others not at all.
- Daily figures from the exchanges are provisional. Final depositary data comes later, so small differences are normal.
- In a public tracker’s November 2026 data, FIIs were net buyers on 9 of the first 10 sessions, yet the Nifty still fell 0.61% on 13 November.
- Weekly and monthly totals, read next to the index move, say more than any single day.
- This is education only. It is not advice to buy or sell anything.
Table of Contents
- What FII Data Impact on Nifty Means
- Where the Daily FII Numbers Come From
- Why Foreign Flows and the Nifty Do Not Always Move Together
- What November 2026 Data Shows
- How to Read FII Data Step by Step
- Worked Example: One Week of FII Flows and Nifty Moves
- Mistakes to Avoid
- Pros and Cons of FII Data Impact on Nifty
- FAQ
- The Bottom Line
What FII Data Impact on Nifty Means
The Nifty 50 is the headline index of the National Stock Exchange. Its daily move comes from thousands of buy and sell decisions. Foreign institutions are one large group among them, and the question behind FII data impact on Nifty is simple: how much of the index move can their net buying or selling explain?
Flow figures are published every trading day and split into a foreign group and a domestic group. You can browse the latest numbers on the home page for FII and DII data, and read more explainers in our FII and DII articles.
Who Counts as an FII
FII stands for foreign institutional investor. Most overseas funds now register with SEBI as foreign portfolio investors, or FPIs, and people often use the two terms for the same flows. Global mutual funds, pension funds and sovereign funds are examples of the kind of institution involved. For the wider background, read our guide on how FII affects the stock market.
How Foreign Flows Differ From Domestic Flows
Foreign money tends to follow global risk appetite, currency views and interest rate expectations. Domestic institutions such as mutual funds and insurers follow local savings and their own mandates. The two groups often take opposite sides on the same day, which is why the gap between them gets so much attention. Our companion piece on DII data impact on Nifty covers the domestic side.
Why the Same Number Can Mean Different Things
A net purchase of a few thousand crore rupees means one thing on a quiet day and another on a day of record turnover. Always read a flow figure against the size of the market that day, and against what the index did.
Where the Daily FII Numbers Come From
Most readers see daily figures that come from exchange-reported data. They are normally released in the evening, around 6 PM IST, and they are provisional. Final foreign investor data is published by the depositary on the next working day, and the two sources can differ slightly. Check the official sites, NSE India and the NSDL FPI Monitor, before you rely on any single figure. Exact timings and formats may vary; check the official site.
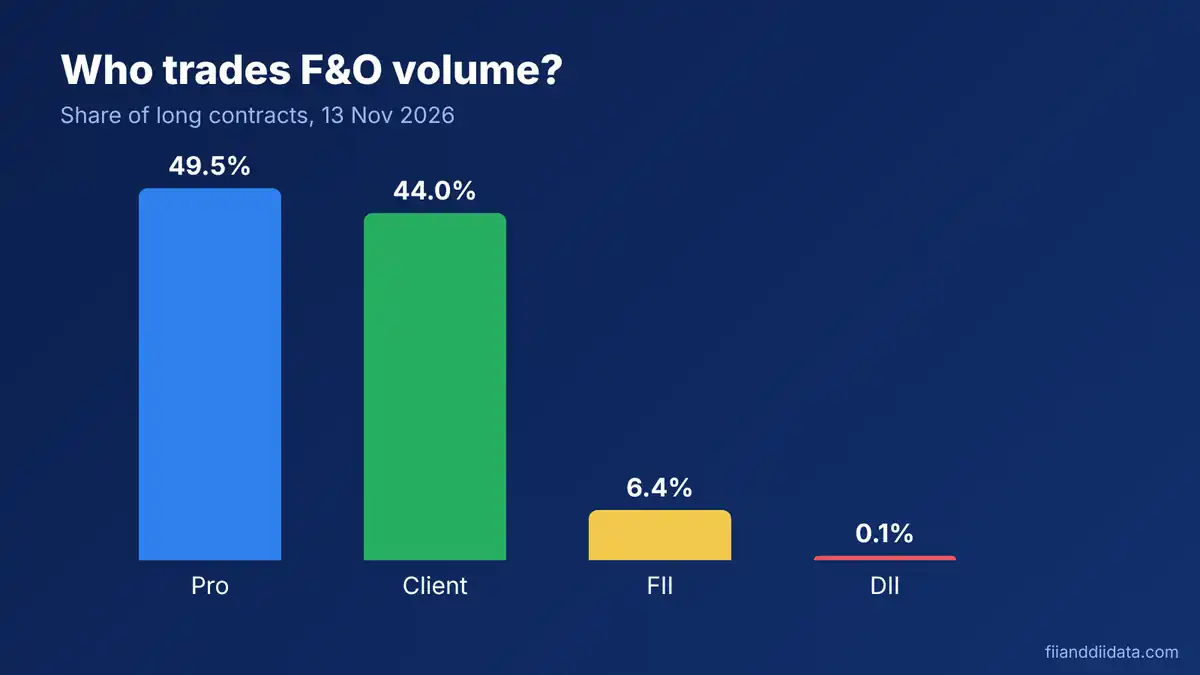
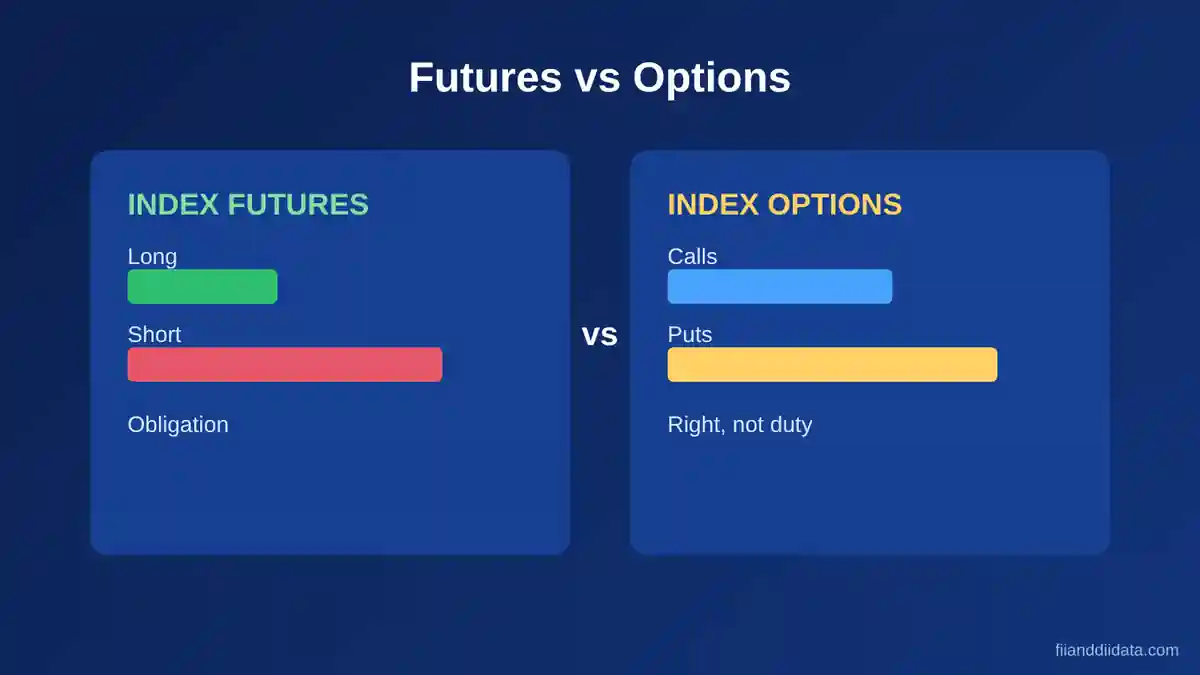
Most headline numbers refer to the cash segment, meaning shares bought and sold for delivery or intraday. Index futures and options positions are reported separately. Our page on FII cash market data explains the cash side, and the FII DII data today summary lists the latest daily figures.
If you track flows in a sheet, store the date, the source and whether the value was provisional or final. That one habit prevents most arguments about whose number is right.
Why Foreign Flows and the Nifty Do Not Always Move Together
Correlation Is Not Causation
When foreign buying and the index both rise, it is tempting to say the buying caused the rise. It may have. But both can also react to the same news, such as a change in global mood. Foreign investors can also buy after a rally has started, so the flow follows the price rather than leading it. That is why FII data impact on Nifty can look stronger in hindsight than it was. Researchers do not agree on one fixed rule, and the pattern can change from one period to the next.
Other Forces That Move the Index
The Nifty also responds to domestic institutions, monthly investments from retail savers, crude oil prices, the rupee, inflation data, interest rate expectations and company results. On any given day, one of these can outweigh foreign flows. For the foreign side in detail, see FII buying and selling.
Cash Buying Can Be Hedged in Futures
A foreign fund can buy shares in the cash market and short index futures at the same time. That pairing leaves little net market exposure, even though the cash flow headline looks bullish. This is one reason FII data impact on Nifty cannot be judged from cash flows alone.
What November 2026 Data Shows
Real numbers make the point better than theory. The table below lists daily net cash-market flows for the first 10 sessions of November 2026, taken from a public flow tracker. A plus sign means net buying and a minus sign means net selling, in rupees crore. The values are provisional and may vary; check the official site.
| Date | FII/FPI net | DII net | Combined |
|---|---|---|---|
| 2 Nov 2026 | +3,114.68 | -392.20 | +2,722.48 |
| 3 Nov 2026 | +6,836.81 | -3,678.85 | +3,157.96 |
| 4 Nov 2026 | +7,284.03 | -3,712.23 | +3,571.80 |
| 5 Nov 2026 | +14,974.68 | -10,444.54 | +4,530.14 |
| 6 Nov 2026 | +13,749.82 | -5,968.70 | +7,781.12 |
| 8 Nov 2026 | -0.25 | -700.31 | -700.56 |
| 9 Nov 2026 | +7,212.22 | -7,172.53 | +39.69 |
| 11 Nov 2026 | +12,563.33 | -8,434.53 | +4,128.80 |
| 12 Nov 2026 | +7,830.60 | -6,331.17 | +1,499.43 |
| 13 Nov 2026 | +5,736.55 | -2,253.58 | +3,482.97 |
| Total (10 sessions) | +79,302.47 | -49,088.64 | +30,213.83 |
Two things stand out. FIIs were net buyers on 9 of the 10 sessions, with 8 November showing a tiny net sale of 0.25 crore. DIIs were net sellers on all 10. That is the reverse of the pattern many readers expect, and it shows why you should read the data before assuming a story.
The 13 November Test Case
On 13 November 2026, the table shows provisional FII net buying of about 5,737 crore rupees. If FII data impact on Nifty were simple, the index would have risen. A HDFC Sky market close report for that day instead says the Nifty fell 0.61% to 25,144.30. The same report mentioned crude oil near 95.7 dollars a barrel and October inflation at 6.09%, which are the kind of pressures that can outweigh foreign buying. Treat these report figures with care and confirm them against official sources.
The lesson is not that FII data impact on Nifty is zero. It is that one day of foreign buying cannot overrule oil prices, inflation worries and domestic selling in the same session.
How to Read FII Data Step by Step
A short routine keeps you from over-reading a single number when you study FII data impact on Nifty. Follow these five steps each week.
- Note the date, the source and whether the figure is provisional or final.
- Add up five sessions of FII net flows to get a weekly total.
- Write down the Nifty’s weekly percentage change next to it.
- Check the DII line for the same days, because domestic selling or buying changes the picture.
- Look at index futures positions before you decide the cash flow tells the whole story.

Worked Example: One Week of FII Flows and Nifty Moves
This is a made-up example to show the arithmetic. Suppose a week looks like the table below. The numbers are not real market data. FII net is in rupees crore, and the last column asks whether the flow and the index moved in the same direction that day.
| Day | FII net (crore) | Nifty change | Same direction? |
|---|---|---|---|
| Monday | +2,000 | +0.4% | Yes |
| Tuesday | -1,500 | -0.3% | Yes |
| Wednesday | +3,000 | -0.2% | No |
| Thursday | -2,500 | +0.5% | No |
| Friday | +1,000 | +0.1% | Yes |
Step 1: add the FII column. 2,000 – 1,500 + 3,000 – 2,500 + 1,000 = +2,000 crore of net buying for the week.
Step 2: find the weekly index change. Adding the daily moves gives 0.4 – 0.3 – 0.2 + 0.5 + 0.1 = 0.5%. Compounding them properly, 1.004 x 0.997 x 0.998 x 1.005 x 1.001 = 1.00498, which is a gain of about 0.498%.
Step 3: count the days where the flow and the index agreed. Monday, Tuesday and Friday agreed, so 3 of 5 days, or 60%.
Step 4: interpret it carefully. A 60% match is only a little better than a coin toss, and five days is far too small a sample. On Wednesday, 3,000 crore of buying came with a falling index, which is exactly the kind of day that shows FII data impact on Nifty is not a rule. The honest conclusion is that this week was mildly positive on both measures, and nothing more.

Mistakes to Avoid
Treating One Day as a Trend
A single large purchase can come from a block deal or an index rebalance. Look at five days, then twenty, before drawing a conclusion.
Mixing Provisional and Final Data
Exchange figures and depositary figures are collected differently. Compare like with like, and label each number in your notes.
Ignoring the Domestic Side
Foreign buying of 5,000 crore with domestic selling of 5,000 crore nets to zero. Always look at both lines together.
Using Flows as a Trading Signal
FII data impact on Nifty describes what already happened. It is context for a move, not a forecast of the next one.
Pros and Cons of FII Data Impact on Nifty
The table sets out what the study of FII data impact on Nifty does well and where it falls short.
| Pros | Cons |
|---|---|
| Gives quick context for why the index moved | Cannot predict the next day’s move |
| Uses free, public data from official sources | Provisional figures can be revised later |
| Shows how global money views Indian shares | Cash flows ignore futures hedges |
| Easy to track in a simple spreadsheet | Domestic flows and oil prices can outweigh it |
| Helps separate foreign mood from domestic demand | Correlation with the index is not causation |
FAQ
What is the FII data impact on Nifty?
It is the effect that foreign institutional buying or selling has on the direction and size of the Nifty 50 move. The effect is real but partial, because domestic flows, oil prices, inflation and global mood also move the index.
Does FII buying always push the Nifty up?
No. In public data for early November 2026, FIIs were net buyers on most sessions, yet the Nifty still fell on 13 November. Treat the link as a tendency, not a guarantee.
Where can I check the latest FII figures?
Start with the NSE India site for daily provisional data and the NSDL FPI Monitor for foreign investor data. Both may revise or finalise numbers later, so check the official site.
Can FII data impact on Nifty predict tomorrow’s move?
No. The data describes what already happened. It can add context, but it is not a forecast and should not be used as buy or sell advice.
How do I calculate the direction match rate?
Count the days when the FII flow and the Nifty moved the same way, then divide by the number of days. For example, 3 matching days out of 5 is 3 divided by 5, which is 60%.
The Bottom Line: FII Data Impact on Nifty
The FII data impact on Nifty is a piece of context, not a signal. Foreign flows can help explain a week, but the first 10 sessions of November 2026 show they can run one way while the index goes the other. Read the numbers over weeks, check the domestic line and the futures data, and keep the figures labelled as provisional or final.
Sources: NSE India, NSDL FPI Monitor, SEBI, a HDFC Sky market close report (13 November 2026), and public flow tracker data for November 2026. Figures are provisional and may vary; check the official site.
Disclaimer: This article is for education only. It is not investment advice, a recommendation or a price target. Markets carry risk, so consult a SEBI-registered adviser before making decisions.