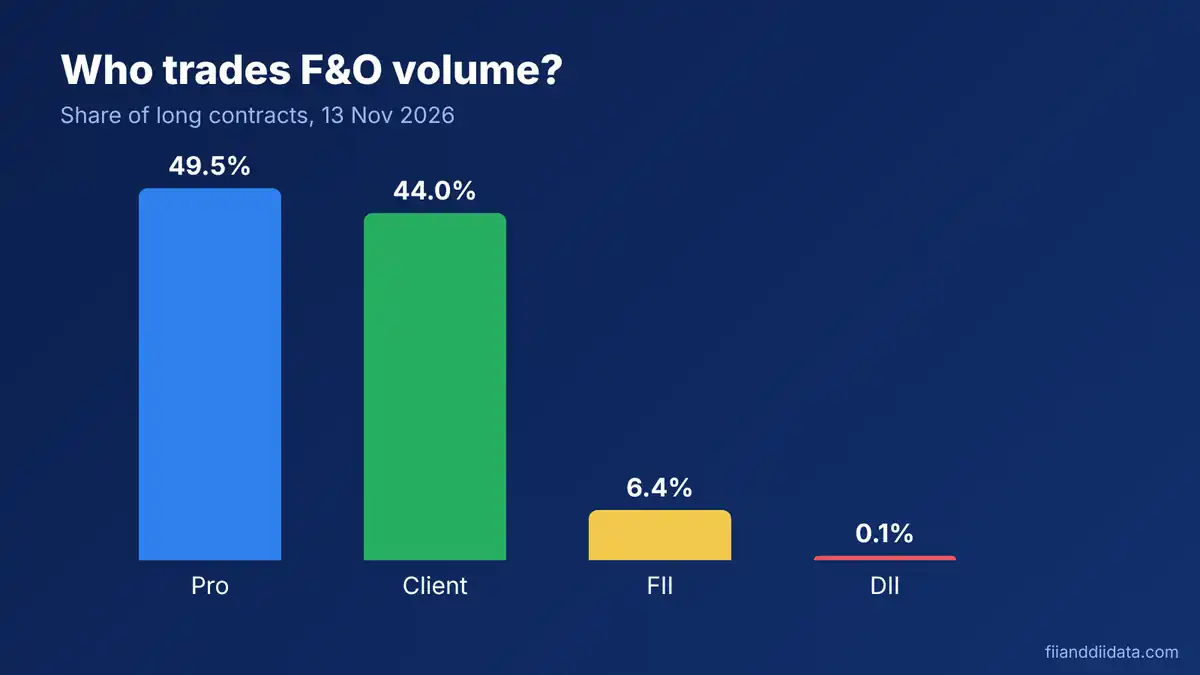
FII index futures vs index options is the comparison that tells you whether foreign investors are hedging, betting or both. Futures show a firm long or short stance, while options show how much they pay for protection or upside. Below, you will read both from NSE data and see what the 12 Nov 2026 positions say.
Key Takeaways
- Index futures are a firm obligation, so FII long and short numbers show direction and size.
- Index options give a right, not a duty, so call and put numbers show protection and conviction.
- On 12 Nov 2026, FIIs held a 37.0% long share in index futures, a net short of 49,719 contracts.
- The net short was 2,40,753 contracts on 30 Oct, so the bearish bet has shrunk fast.
- Read futures, calls and puts together, and compare several days before drawing a conclusion.
Contents:
- Futures vs options: the core difference
- Where the data comes from
- Worked example: reading one day
- Futures vs options comparison
- What the 12 Nov 2026 data shows
- Hedge or directional bet?
- A 4-step reading method
- Common mistakes
- Pros and cons of each signal
- FAQs
- The bottom line
Futures vs options: the core difference
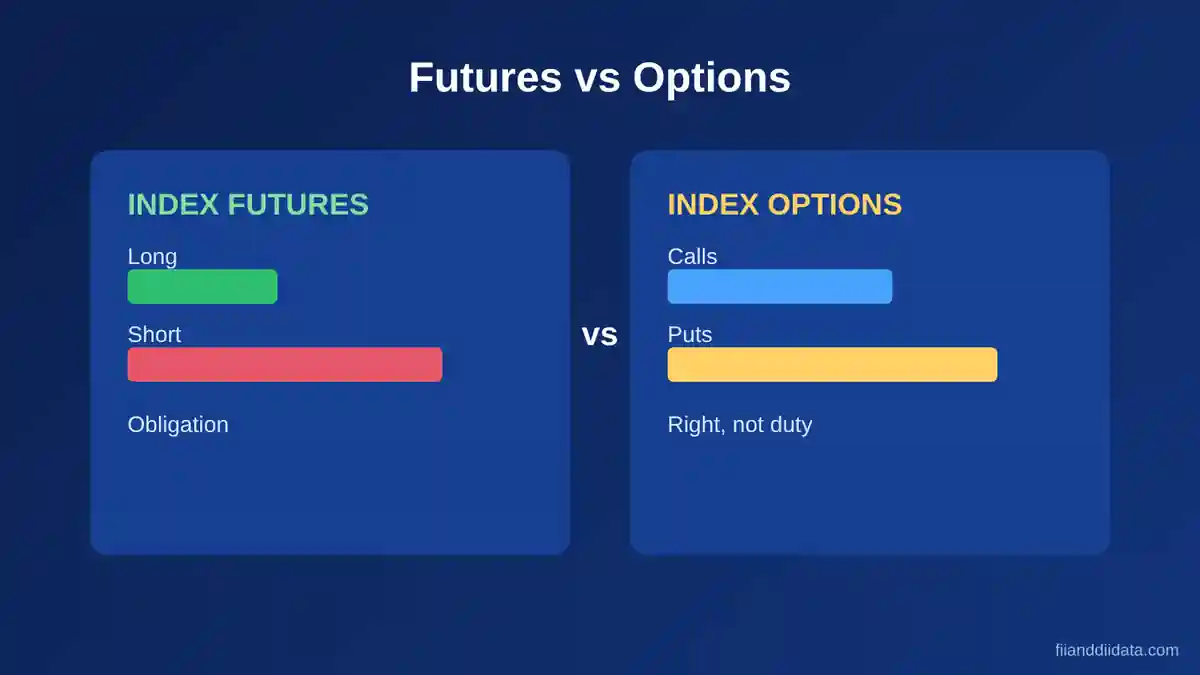
An index future is a contract to buy or sell an index at a set price on a set date. Both sides must honour it, so a foreign institutional investor (FII) that is long futures gains when the index rises and loses when it falls. Short futures work the opposite way. This makes futures a clean read on direction.
An index option gives the buyer the right, but not the duty, to trade at a fixed strike. A call gains when the index rises, and a put gains when it falls. The buyer pays a premium for that right, while the seller collects the premium and takes the risk. So option positions show both direction and how much protection FIIs are paying for.
For the wider picture of how foreign investors use derivatives, see our guide to F&O meaning in India. Our FII and DII data hub carries the daily numbers.
Where the data comes from
NSE publishes participant-wise open interest after each trading day, split into Client, DII, FII and Pro categories. For the FII row you get index futures long and short, index options calls and puts long and short, and stock futures and options. Open interest counts contracts still open, not contracts traded in a day.
This is different from cash market flows, which show rupees bought and sold in shares. We explain the gap in FII DII cash data vs participant-wise OI. You can verify any figure on the NSE derivatives reports page.
Worked example: reading one day
The numbers below are illustrative, to show the method. Suppose an FII holds shares worth ₹1,000 crore and shorts index futures worth ₹500 crore. Half the portfolio is hedged, so a fall in the index is partly offset. The futures row alone shows a net short, which looks bearish, yet the investor may simply be protecting gains.
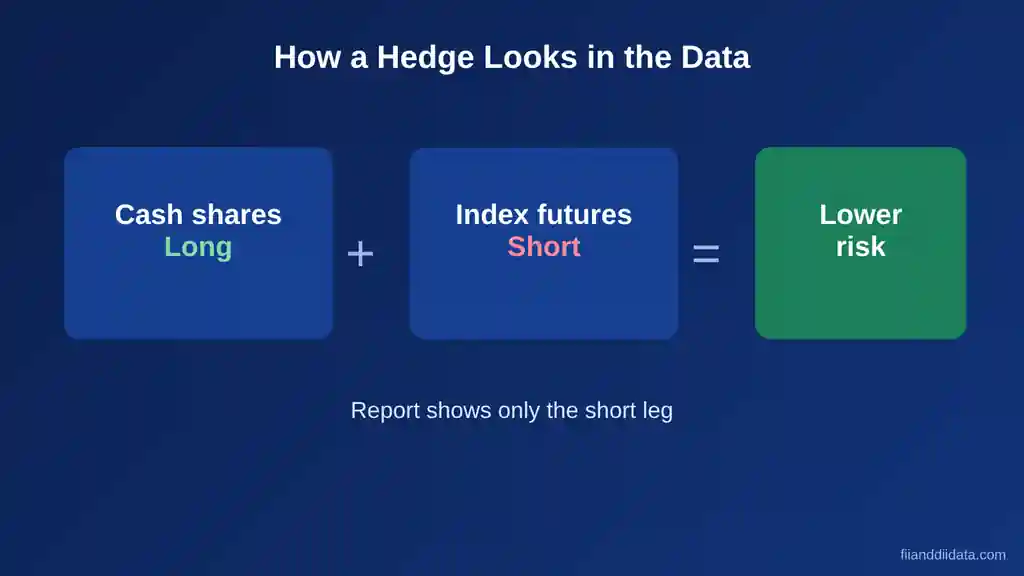
Now add options. If the same investor also buys index puts, the cost is the premium, and the loss is capped if the market rallies. Combined, a short future plus long puts is a heavier protection stack than either alone. That is why one row never tells the full story.
Two quick formulas help. Long share is long contracts divided by long plus short contracts. Long-short ratio is long divided by short. A 37.0% long share means about 63% of futures contracts are short, a ratio near 0.59.
Why do FIIs use both? Futures are cheap to hold because only margin is blocked, and they hedge a whole portfolio in one trade. Options cost a premium, but they cap the loss. A fund that fears a sharp fall may buy puts for a defined cost, while a fund that expects a mild dip may simply short futures. The mix of the two reveals how worried the fund is and how much risk it will carry.
Timing matters as well. Futures positions roll every month at expiry, and weekly options expire even faster. Open interest can therefore drop sharply around expiry without any change in view. Compare the same point in successive series, and avoid reading a number from an expiry day as a new trend.
Size also needs context. A net short of 49,719 contracts sounds large, but it was 2,40,753 only two weeks earlier. Always judge a position against its own recent history, not against zero. The change in position often carries more information than the level itself.
Futures vs options comparison
| Feature | Index futures | Index options |
|---|---|---|
| Obligation | Both sides must honour the contract | Buyer has a right, seller has a duty |
| Upfront cost | Margin only | Premium paid by the buyer |
| Loss for buyer | Can exceed margin | Limited to the premium |
| What FII data shows | Long, short and net direction | Calls, puts and protection demand |
| Best used to read | Direction and size of the bet | Hedging cost and conviction |
| Main risk of misreading | Hedge looks like a bearish view | Long and short legs hide net intent |
What the 12 Nov 2026 data shows
As per NSE participant-wise open interest for 12 Nov 2026, FIIs held a 37.0% long share in index futures, with a net short of 49,719 contracts. In index options, FIIs were net long 3,78,895 puts and net short 2,08,109 calls. The full table is in our participant-wise open interest report for 12 November 2026.
| Date (2026) | FII net short, index futures (contracts) |
|---|---|
| 30 Oct | 2,40,753 |
| 5 Nov | 1,37,438 |
| 9 Nov | 90,741 |
| 11 Nov | 70,413 |
| 12 Nov | 49,719 |
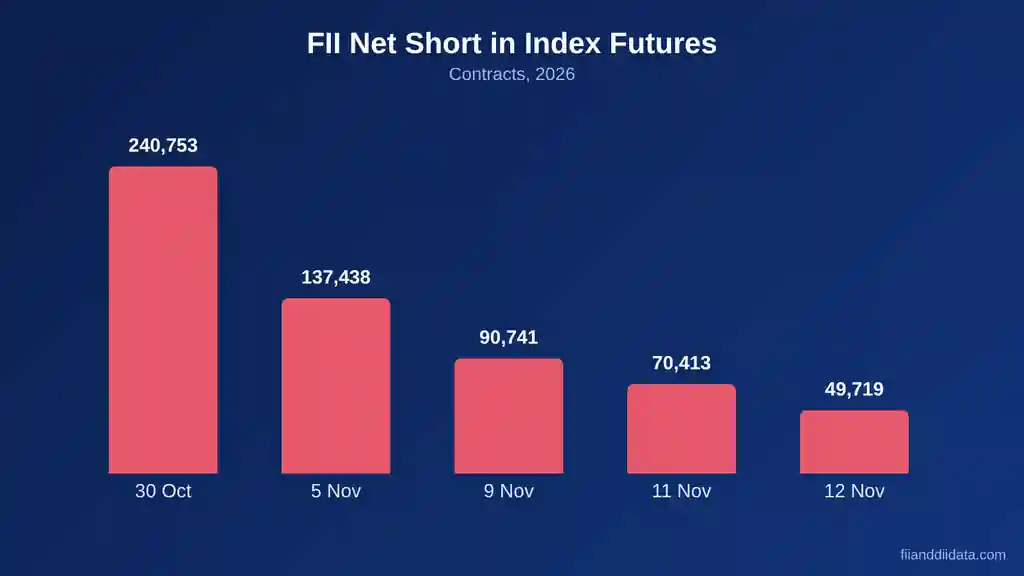
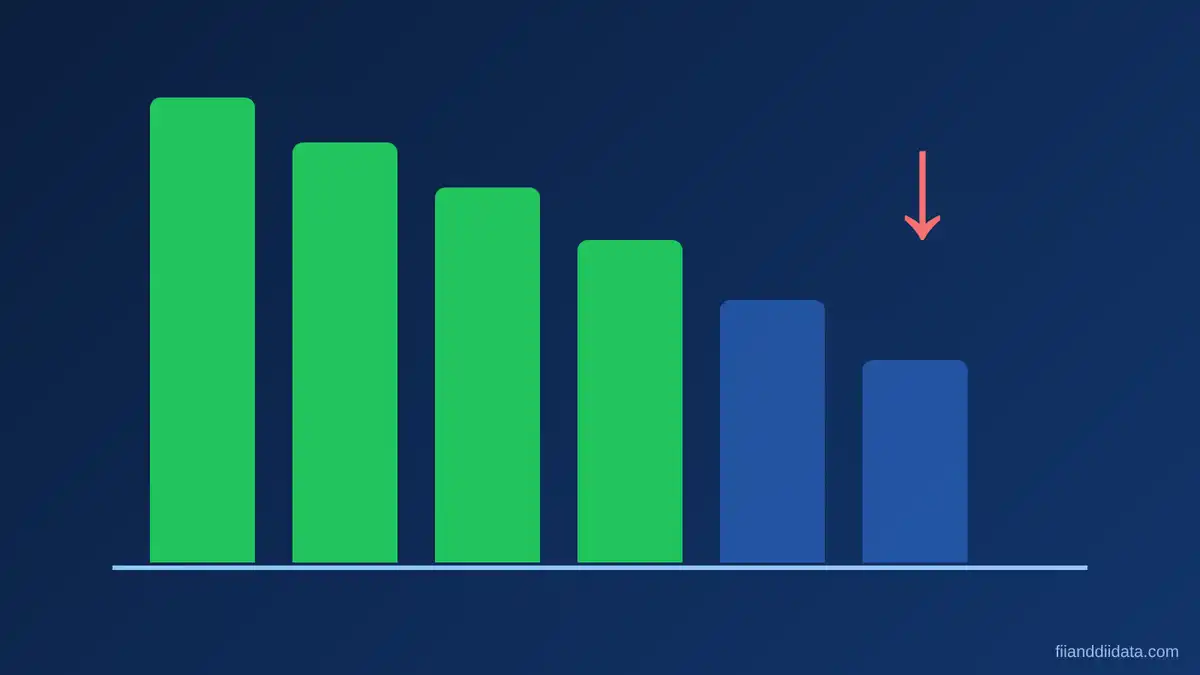
The futures net short has shrunk by roughly four-fifths in two weeks. That fits a pattern of short covering, which we cover in FII short covering. Yet the options row still shows net long puts, so protection demand has not vanished. Futures say pressure is easing, while options say caution remains.
Here is how to read the options row from that day. Net long puts of 3,78,895 contracts means FIIs hold more purchased downside protection than they have sold. Net short calls of 2,08,109 contracts means they have sold more upside than they have bought. Both lean cautious, yet neither proves a falling market, because sold calls can also be a yield strategy when the market is calm.
Putting the pieces together, futures show a shrinking short, puts show lingering protection, and calls show limited upside appetite. A balanced reading is that FIIs are reducing outright bearish bets while keeping insurance in place. If cash buying continues in coming sessions, the case for a more positive stance strengthens; if cash turns to selling, the protection may prove justified.
Hedge or directional bet?
A net short in futures does not prove a bearish view. FIIs that hold large cash portfolios often short index futures to hedge. To separate the two, check the cash market too. Our FII DII data today page gives daily cash flows, and the FII futures data and FII options data guides cover each derivatives row in detail.
- Likely hedge: cash buying continues while futures stay short.
- Likely bearish bet: cash selling and a rising futures short at the same time.
- Likely recovery: the futures short falls while cash flows turn positive.
Beginners often ask which row to check first. Start with futures, because direction is simplest there, then move to puts, then calls. Spend a minute on the change from the previous day for each row. A rising put position with a rising futures short is a stronger bearish sign than either alone, while falling numbers in both rows suggest relief.
A 4-step reading method
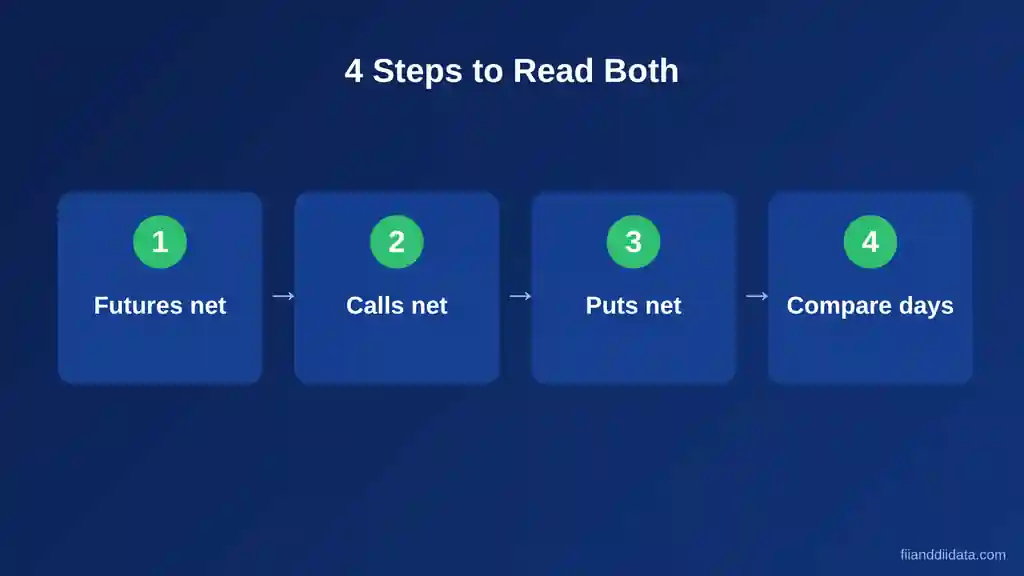
- Futures net: note long share and net position for the FII row.
- Calls net: check whether FIIs are net long or net short calls.
- Puts net: check the same for puts and compare it with the call side.
- Compare days: look at five sessions, not one, and match with cash flows.
For a full trading workflow, read how to use FII DII data for trading. The put call ratio adds market-wide context.
A practical habit is to keep a small log. Each evening, note the FII long share, the futures net, the call net and the put net, and add the cash flow figure from the same day. After two weeks the log shows turning points that a single day hides. Look for days when the futures short falls while puts also fall; that mix usually signals reduced fear, not just profit booking.
Remember that FII data covers foreign portfolio investors only. Domestic institutions, proprietary desks and retail traders hold the other side of every contract. A fall in FII shorts means someone else took the opposite position, so treat the FII row as one voice in the market, not the whole market.
Common mistakes
- Reading a single day as a trend.
- Treating every futures short as a bearish call.
- Ignoring that option sellers also appear in the data.
- Mixing cash market rupee figures with open interest contract counts.
- Overlooking expiry days, when positions roll and numbers jump.
Pros and cons of each signal
| Signal | Pros | Cons |
|---|---|---|
| Index futures | Clear direction, easy long-short ratio | Hedges look like bets |
| Index options | Shows cost of protection and conviction | Harder to net out, long and short legs mix |
FAQs
What is the difference between FII index futures and index options?
Index futures are binding contracts, so FII long and short numbers show direction. Index options give a right, so call and put numbers show protection demand and conviction.
Where can I find FII index futures and options data?
NSE publishes participant-wise open interest daily on its derivatives reports page. The FII row lists index futures, index options and stock derivatives separately.
Does an FII net short in futures mean they are bearish?
Not always. FIIs often short index futures to hedge a large cash portfolio, so check cash flows and options before calling it a bearish view.
What was the FII index futures long share on 12 Nov 2026?
As per NSE data, the long share was 37.0%, with a net short of 49,719 contracts, down from 2,40,753 on 30 Oct 2026.
Which is a better signal, futures or options?
Neither is enough alone. Futures show direction and size, options show hedging and conviction, so use both with cash market flows.
The bottom line
Futures tell you which way FIIs lean, and options tell you what they pay to stay safe. On 12 Nov 2026 the futures net short had fallen to 49,719 contracts while puts remained net long. Read both, compare several sessions, and check cash flows before drawing a conclusion. Track the latest numbers on FII and DII data.
Sources: NSE participant-wise open interest; SEBI for derivatives rules.
Disclaimer: This article is for information and education only and is not investment advice. Derivatives carry high risk. Consult a SEBI-registered adviser before trading.