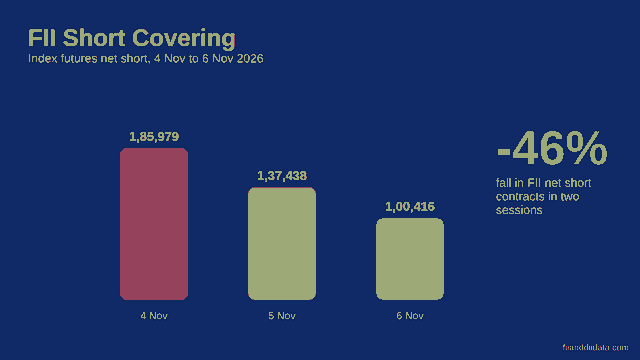
FII short covering happens when foreign institutional investors buy back index futures contracts they sold earlier, which shrinks their net short position. The latest participant-wise data from NSE shows a clear example. FII net short in index futures fell from 3,02,391 contracts on 5 October 2026 to 1,00,416 contracts on 6 November 2026, a drop of about 67 percent, while the Nifty 50 closed the period at 25,030.35.
This guide explains what the term means, how the November 2026 numbers look, how covering differs from a short squeeze or fresh long buying, and how you can check it yourself using open data. If you follow FII and DII data every day, this is one of the more useful derivatives signals to understand.
Key Takeaways
- FII net short in index futures fell from 3,02,391 contracts (5 October) to 1,00,416 contracts (6 November 2026).
- In the two sessions of 5 and 6 November, net short dropped by 85,563 contracts while the Nifty 50 rose 1,069.75 points.
- FIIs are still net short at 1,00,416 contracts, so covering is a reduction in bearishness, not a switch to a bullish stance.
- Falling open interest with rising prices points to covering. Rising open interest with rising prices points to fresh long buying.
In this article
- What is FII short covering?
- What the November 2026 numbers show
- Short covering vs short squeeze vs fresh long buying
- How price and open interest separate the patterns
- Where to find the data
- A four step checklist
- Common mistakes to avoid
- Frequently asked questions
What is FII short covering?
A short position in index futures is a bet that the market will fall. The seller agrees to sell at today’s price and hopes to buy back later at a lower price. Short covering is the buy-back step. When foreign institutional investors close these positions, they buy futures contracts, and that buying adds demand to the market even though no new bearish or bullish view may be involved.
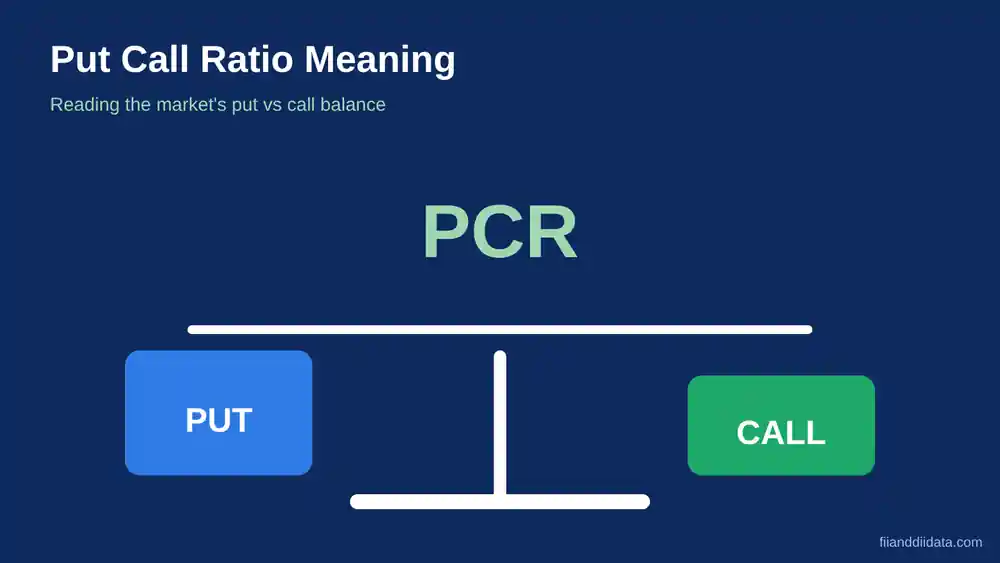
FII positions are tracked through the participant-wise open interest report that NSE publishes after the close of trade. The report splits open interest across four groups: Client, DII, FII and Pro. For FIIs, the number to watch is net short or net long in index futures, which is long contracts minus short contracts. You can read the basics of that report in our guide to participant wise OI.
Two things make FII positioning worth watching. First, foreign investors hold large index futures positions, so their changes are big enough to show up in the data clearly. Second, they often use index futures as a hedge against their cash market holdings, so a change can reflect risk management as much as a market view. That is why the size of the move and what the price did on the same day both matter.
What the November 2026 numbers show
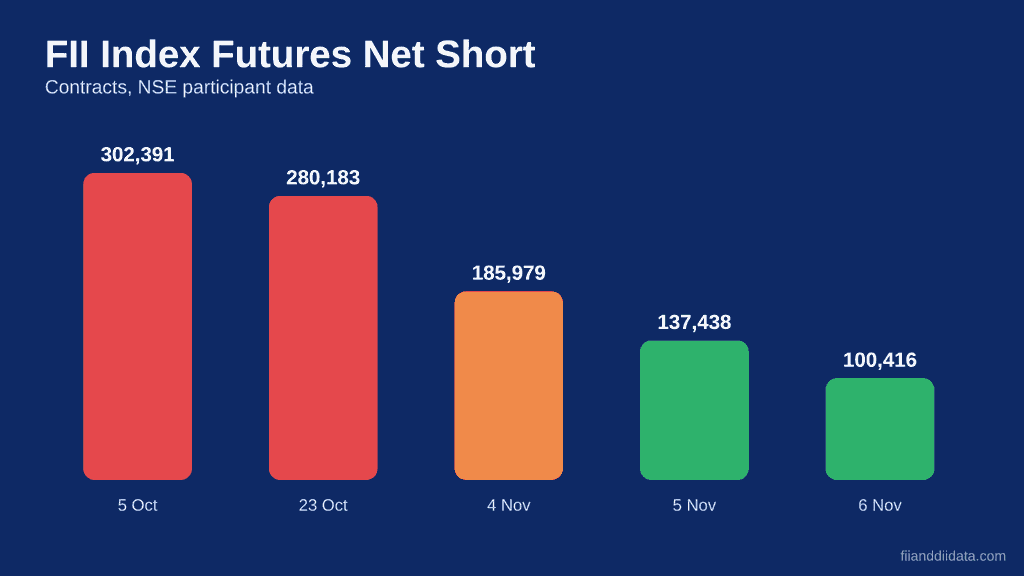
NSE participant-wise open interest shows FIIs carried a very large net short in index futures at the start of October. By the first week of November that position had shrunk sharply. The table below lists the net short on the dates we verified.
| Date (2026) | FII index futures net short (contracts) |
|---|---|
| 5 October | 3,02,391 |
| 23 October | 2,80,183 |
| 4 November | 1,85,979 |
| 5 November | 1,37,438 |
| 6 November | 1,00,416 |
Between 5 October and 23 October the net short eased by only 22,208 contracts. The real change came after that. From 23 October to 4 November the position fell by another 94,204 contracts, and in the next two sessions it fell by 85,563 more. In total, the net short is down by 2,01,975 contracts, or about 66.8 percent, from the 5 October level.
The last two sessions are the most telling because the Nifty 50 moved up at the same time.
| Date (2026) | FII net short (contracts) | Fall in net short | Nifty 50 close | Nifty change |
|---|---|---|---|---|
| 4 November | 1,85,979 | NA | 23,960.60 | NA |
| 5 November | 1,37,438 | 48,541 | 24,536.60 | +576.00 (2.40%) |
| 6 November | 1,00,416 | 37,022 | 25,030.35 | +493.75 (2.01%) |
Over those two sessions the index gained 1,069.75 points, or about 4.46 percent, and FIIs bought back 85,563 contracts of net short. The two moved together, which is the pattern you would expect when large holders cover shorts into a rising market. The data shows the timing, but it does not prove one caused the other. Other buyers were also active in the same sessions.
One more point matters. After all this covering, FIIs still hold a net short of 1,00,416 contracts. They have reduced bearishness, not turned bullish. You can follow the weekly view in our FII DII weekly report for 6 November 2026.
Short covering vs short squeeze vs fresh long buying
These three terms are often mixed up in market commentary, but they describe different things.
Short covering is any buy-back of short positions. It can be planned and calm. A fund may close shorts because its view changed, because the position reached its target, or because a hedge is no longer needed.
A short squeeze is forced and fast. Prices rise sharply, shorts take losses, and many are pushed to buy back at the same time, which pushes prices higher still. The key features are speed and urgency, often with a large single-day jump.
Fresh long buying means new buy contracts are being opened. The participant’s long position grows, and total open interest usually rises.
The 5 and 6 November sessions look more like steady covering than a squeeze. The net short fell by 48,541 and then 37,022 contracts, and the Nifty rose about 2 percent a day. That is strong, but it is spread over two sessions, and the net short fell on both days in a similar range.
How price and open interest separate the patterns
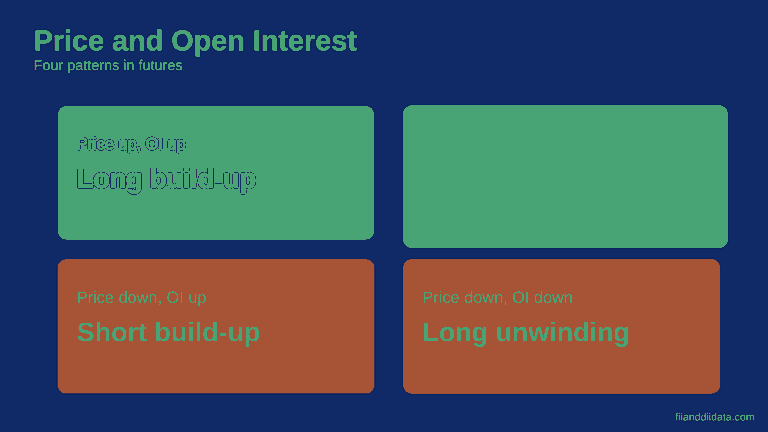
Price alone cannot tell you which of these is happening. You need to read price together with open interest. The rule is simple: open interest rises when new positions are opened and falls when positions are closed. The four standard combinations are below.
- Price up, open interest up: long build-up. New buyers are entering.
- Price up, open interest down: short covering. Sellers are closing out.
- Price down, open interest up: short build-up. New sellers are entering.
- Price down, open interest down: long unwinding. Buyers are closing out.
Apply this to the FII data itself. If FII long contracts stay flat while FII short contracts fall, the net short narrows because of covering. If FII long contracts rise at the same time, part of the improvement is fresh buying. For the market as a whole, you can read the basics in our explainer on open interest, and for how FII positions compare with proprietary traders, see Pro vs Client open interest.
Where to find the data
All the numbers in this article come from the NSE F&O participant-wise open interest report. NSE publishes it as a CSV file after the market closes each trading day, under the F&O reports section. The file lists long and short contracts for each participant across index futures, stock futures, index options and stock options.
To measure covering, take the FII row for index futures and calculate long minus short for each day. A shrinking net short over several sessions is the covering signal. Our page on NSE participant wise open interest data collects these figures in one place, and the FII long short ratio page shows the same position as a ratio, which makes day to day changes easier to compare.
Keep in mind that the cash market and futures market are reported separately. Cash market flows are published by NSE as provisional figures around 6 PM IST, and NSDL releases final data the next working day. For the daily cash numbers, see FII DII data today. Cash buying and futures covering are different things, so check both before drawing a conclusion. If you are new to these sources, how to check FII DII data walks through each one step by step.
A four step checklist
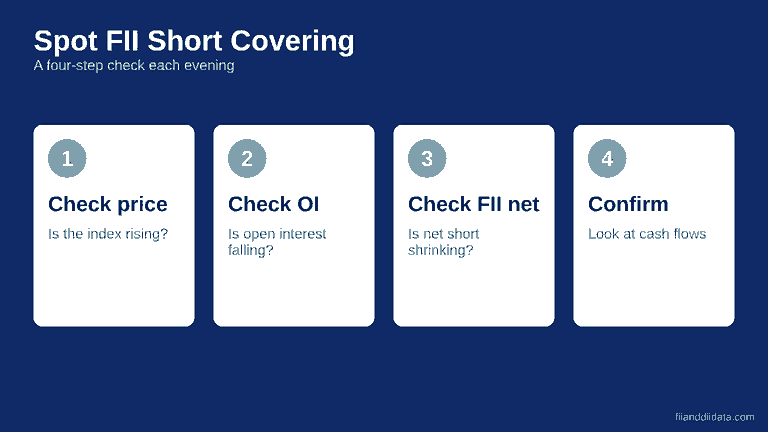
When the FII net short falls, run through these four checks before treating it as a bullish signal.
- Check open interest. Is total index futures open interest falling while price rises? That fits covering.
- Check price. Did the index rise on the same days the shorts fell? If price was flat or falling, the reduction may be a hedge adjustment.
- Check the size of the net short. A fall from 3,02,391 to 1,00,416 is large, but the position is still net short. Note where the level ends, not only the change.
- Check the cash market and options. Look at cash flows and at option positioning. The FII options activity tracker shows whether options data supports the same story.
Common mistakes to avoid
Reading one day as a trend. A single session of covering can reverse the next day. The pattern in this article built up over about a month, with the sharpest part in the last two sessions. Look at several sessions before forming a view.
Ignoring the level. A net short of 1,00,416 contracts is still a bearish tilt. Covering means the tilt is easing, not that it has flipped.
Assuming it is a prediction. Covering describes what has already happened in positions. Markets can keep rising after covering ends, or fall back if new shorts are opened. Treat the data as context for your own analysis, not as a forecast.
Mixing up cash and futures. FIIs can sell in the cash market while covering shorts in futures on the same day. The two sets of numbers answer different questions. The FII DII monthly data page helps you see the cash trend across the whole month.
Frequently asked questions
What does FII short covering mean?
It means foreign institutional investors are buying back index futures contracts they sold earlier, so their net short position shrinks.
Is FII short covering bullish for the Nifty?
It can support prices in the short term because it adds buying demand, but it is not a bullish view by itself. In November 2026 FIIs were still net short by 1,00,416 contracts.
How do I check FII net short in index futures?
Download the F&O participant-wise open interest CSV from the NSE reports section after market close, then subtract FII short contracts from long contracts for index futures.
What is the difference between short covering and a short squeeze?
Short covering is any buy-back of shorts and can be gradual. A short squeeze is a fast, forced rush to buy back that pushes prices up sharply.
Disclaimer: This article is for information and education only and is not investment advice. Derivatives trading carries high risk. Please consult a SEBI registered adviser before making any decision. Data is based on NSE participant-wise open interest and Nifty 50 closing values as of 6 November 2026.