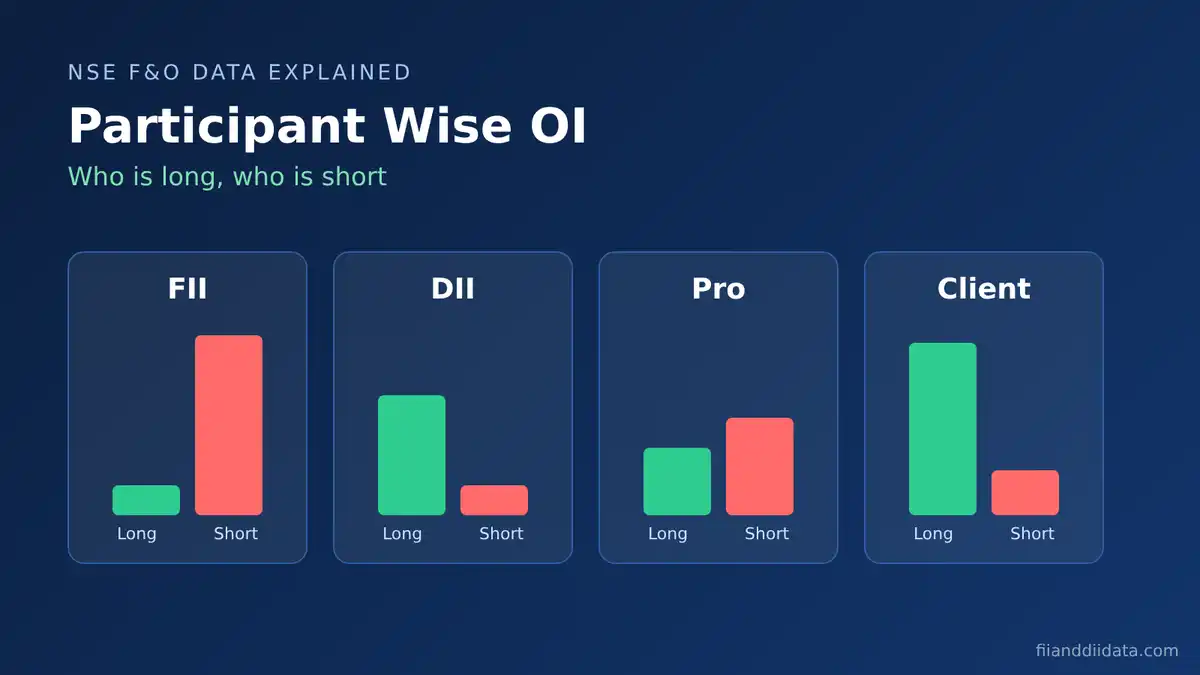
The participant wise OI meaning is simple: it is NSE’s daily count of open futures and options contracts held by four groups of traders, FIIs, DIIs, Pros and Clients, split into long and short positions. On 27 October 2026, that file showed FIIs net short 2,21,057 index futures contracts while Clients were net long 1,94,426. This guide explains what those numbers mean and how to read them yourself.
Key Takeaways
- Participant wise OI shows who holds open F&O contracts: FII, DII, Pro or Client.
- Net position is long contracts minus short contracts for one group and one instrument.
- Index futures are the cleanest read on direction; options mix bets, hedges and income trades.
- On 27 October 2026, an expiry day, FIIs cut their index futures net short by 56,048 contracts.
- The file is published once a day after market close, so read trends over 5 to 10 sessions.
In this guide:
- Participant Wise OI Meaning in Simple Words
- Who Are FII, DII, Pro and Client?
- What the NSE File Shows
- How to Read It: Worked Example
- Latest Data: 27 October 2026
- How Traders Use It: Daily Checklist
- Common Mistakes
- Participant OI vs Other FII Data
- FAQs
- The Bottom Line
Participant Wise OI Meaning in Simple Words
Open interest (OI) is the number of derivative contracts that are still open, meaning they have not been squared off or expired. If one trader buys a Nifty future and another sells it, one contract of open interest is created. When either side closes the trade and nobody replaces them, that open interest falls.
The normal option chain tells you how much open interest exists. It does not tell you who holds it. The participant wise OI report fills that gap. It splits the total for the whole market into four groups and shows how many contracts each group is long (betting on a rise) and short (betting on a fall, or hedging).
One rule makes the whole report easier to read. Every futures contract has a buyer and a seller, so total longs always equal total shorts. On 27 October 2026, all four groups together held exactly 3,58,464 long and 3,58,464 short index futures contracts. If FIIs are heavily short, someone else must be long. That is why the report is really about who is on which side. Next, the four groups themselves.
Who Are FII, DII, Pro and Client in Participant Wise OI?
| Participant | Who it includes | How it usually trades F&O |
|---|---|---|
| FII | Foreign portfolio investors: overseas funds, pension funds, sovereign funds, hedge funds | Directional bets plus hedges on their large share portfolios |
| DII | Indian mutual funds, insurers, banks and other domestic institutions | Mostly hedging and arbitrage; small directional exposure |
| Pro | Brokers and trading members trading their own money | Fast, active trading, market making and arbitrage |
| Client | Everyone else: retail traders, HNIs, corporates and other non-institutional accounts | Largest group by headcount; mostly option buying and futures longs |
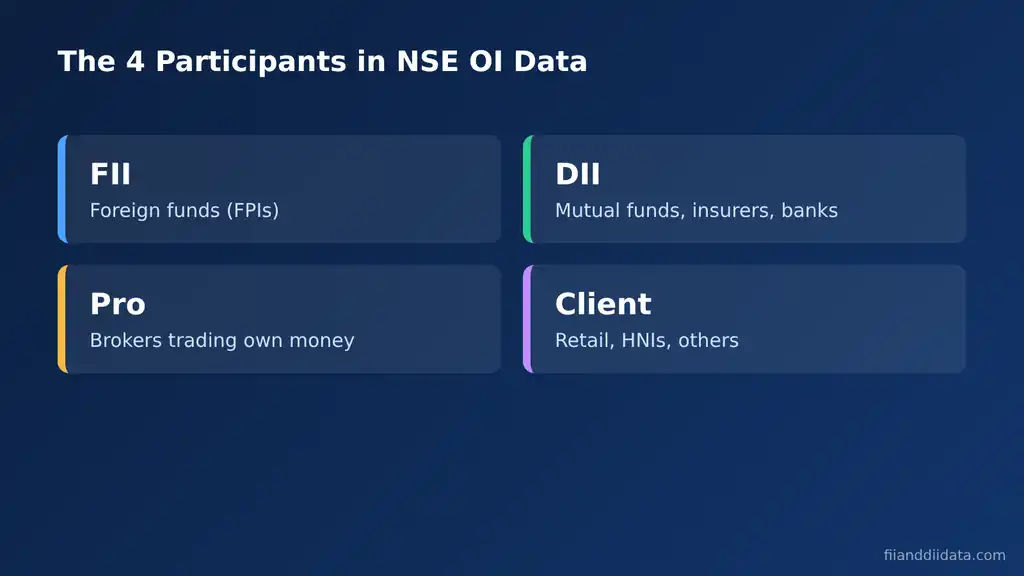
Two points are easy to miss. First, NSE still uses the label “FII” even though SEBI merged FIIs into the Foreign Portfolio Investor (FPI) category in 2014. Second, “Client” is not only small retail traders. It is a mixed bucket that also holds HNIs and corporates, so treat it as “non-institutional money” rather than “beginners”.
SEBI’s study of FY25 trading found that over 91% of individual traders lost money in equity derivatives, with net losses of ₹1,05,603 crore after costs, as reported by Business Standard on 7 July 2025. That is one reason traders watch what the institutional groups are doing. Now let us open the file itself.
What the NSE Participant Wise OI File Shows
NSE publishes a CSV file every trading day on its derivatives reports page, named in the format fao_participant_oi_DDMMYYYY.csv. Each row is one participant group, plus a total row. The columns are:
| Column group | Long side | Short side | What it tells you |
|---|---|---|---|
| Future Index | Future Index Long | Future Index Short | View on Nifty, Bank Nifty and other indices |
| Future Stock | Future Stock Long | Future Stock Short | Positions across all single-stock futures |
| Option Index Call | Call Long (bought) | Call Short (written) | Upside bets or call writing |
| Option Index Put | Put Long (bought) | Put Short (written) | Downside hedges or put writing |
| Option Stock Call and Put | Long | Short | Same idea for stock options |
| Total | Total Long Contracts | Total Short Contracts | Sum of all of the above |
All figures are numbers of contracts, not rupees. A long put and a short call are both bearish, so the “Total” columns mix bullish and bearish positions and are of little use on their own. Most analysts focus on index futures first, then index options. If you want the numbers already worked out, our participant wise open interest data page updates them every evening. With the columns clear, here is how to turn them into a view.
How to Read Participant Wise OI: A Worked Example
We will use the real FII index futures numbers from 26 and 27 October 2026.
Step by Step: FII Index Futures on 27 October 2026
- Net position: 33,588 long minus 2,54,645 short = -2,21,057 contracts. A minus sign means net short.
- Previous day: on 26 October, FIIs held 46,522 long and 3,23,627 short, a net of -2,77,105.
- Daily change: -2,21,057 minus (-2,77,105) = +56,048. The net short shrank by about 20%.
- Why it shrank: shorts fell by 68,982 while longs fell by only 12,934. FIIs closed far more shorts than longs.
- Long ratio: 33,588 ÷ (33,588 + 2,54,645) × 100 = 11.7%. On 26 October it was 12.6%, so the long share actually slipped, because longs shrank faster in percentage terms (28%) than shorts (21%).
Step 5 shows why you should look at more than one measure. The net short improved sharply, yet the share of long positions slipped. Both are true at once. The net number tells you the size of the bet; the ratio tells you how one-sided it is. Our guide to the FII long short ratio covers the second measure in depth.
Participant Wise OI Meaning on Expiry Days
27 October 2026 was the monthly expiry for NSE index derivatives. Total index futures open interest fell from 4,48,757 contracts to 3,58,464 that day, a drop of about 20%, as October contracts settled. So a large part of the FII “short covering” was simply October shorts expiring without being rolled into November. On expiry days, treat changes in OI as partly mechanical. The cleaner signal comes one or two sessions later, once the new series settles. Now let us look at the full picture for all four groups.
Latest Participant Wise OI Data: 27 October 2026
| Participant | Index futures long | Index futures short | Net | Change vs 26 Oct |
|---|---|---|---|---|
| FII | 33,588 | 2,54,645 | -2,21,057 | +56,048 |
| Client | 2,51,789 | 57,363 | +1,94,426 | -13,156 |
| DII | 47,790 | 8,410 | +39,380 | -1,132 |
| Pro | 25,297 | 38,046 | -12,749 | -41,760 |
| Total | 3,58,464 | 3,58,464 | 0 | 0 |
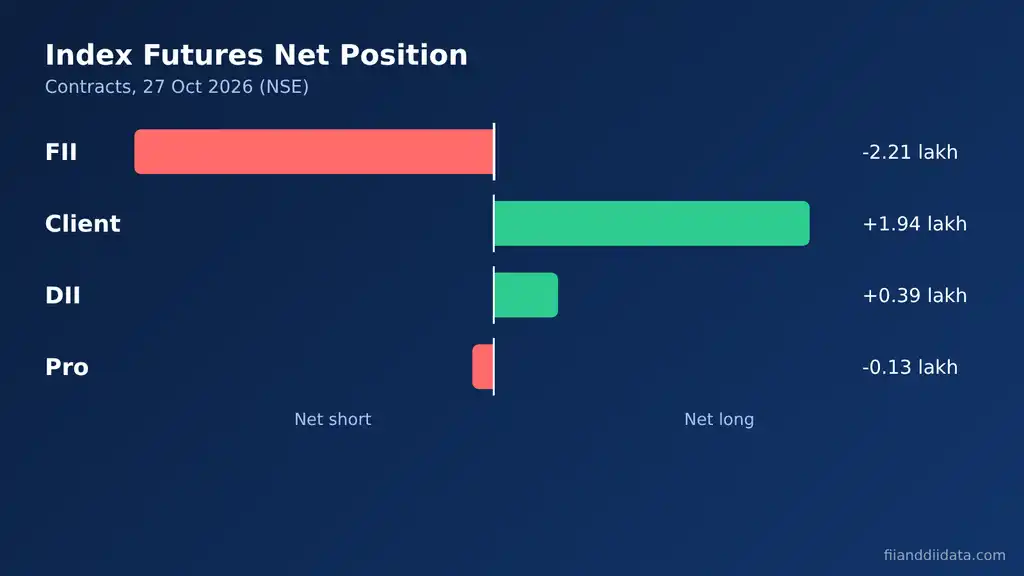
Three things stand out. FIIs hold 71% of all short index futures, while Clients hold 70% of all longs. That has been the pattern for most of 2026. The biggest daily move came from Pros, who swung from a net long of 29,011 to a net short of 12,749. And DIIs stayed small and net long, as usual.
Index Options and Stock Futures on the Same Day
| Participant | Index calls net | Index puts net | Stock futures net |
|---|---|---|---|
| FII | -2,93,075 | +5,67,926 | +8,64,452 |
| Client | +1,84,733 | -6,28,899 | +30,34,406 |
| DII | +2,738 | +1,02,061 | -43,20,296 |
| Pro | +1,05,605 | -41,089 | +4,21,438 |
FIIs were net put buyers (+5.68 lakh contracts) and net call sellers (-2.93 lakh). Both lean bearish or protective, which fits with their futures short. Clients, on the other hand, were net put sellers, collecting premium on the view that the market will not fall much. The DII stock futures number looks alarming at -43.2 lakh contracts, but it mostly reflects arbitrage funds that buy shares in the cash market and sell the matching futures. It is not a bet against Indian stocks. Knowing the numbers is one thing; using them well is another.
How Traders Use Participant Wise OI: A Daily Checklist
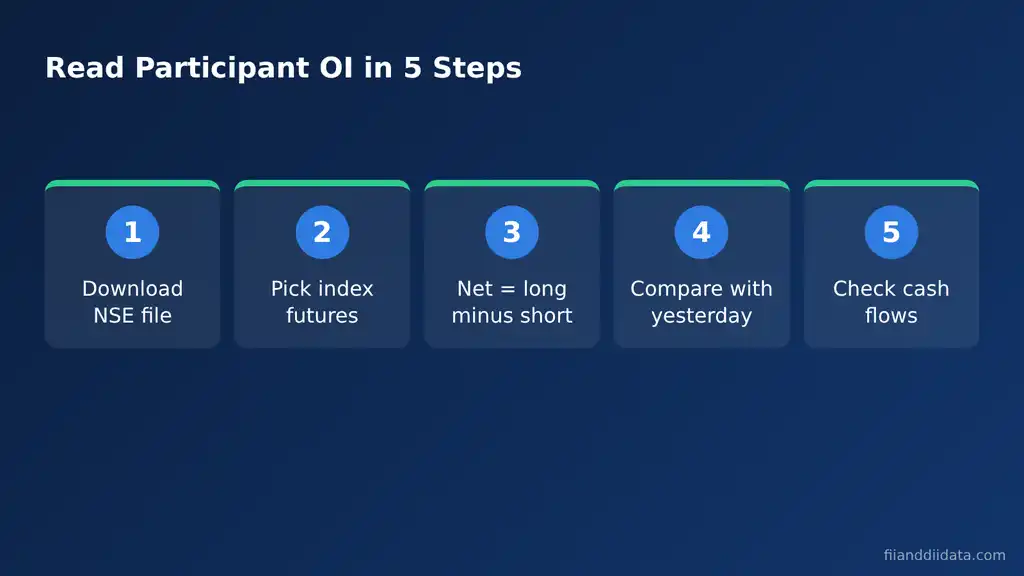
- After the evening release, note the FII, Client and Pro net index futures position.
- Write down the daily change and add it to a 10-session log. Look for runs of five or more days in one direction.
- Check whether longs or shorts drove the change. Fresh shorts added is different from longs closed.
- Compare with index options: FII put buying plus call writing confirms a defensive stance; FII put writing hints that they see a floor. Our FII options activity tracker logs this daily.
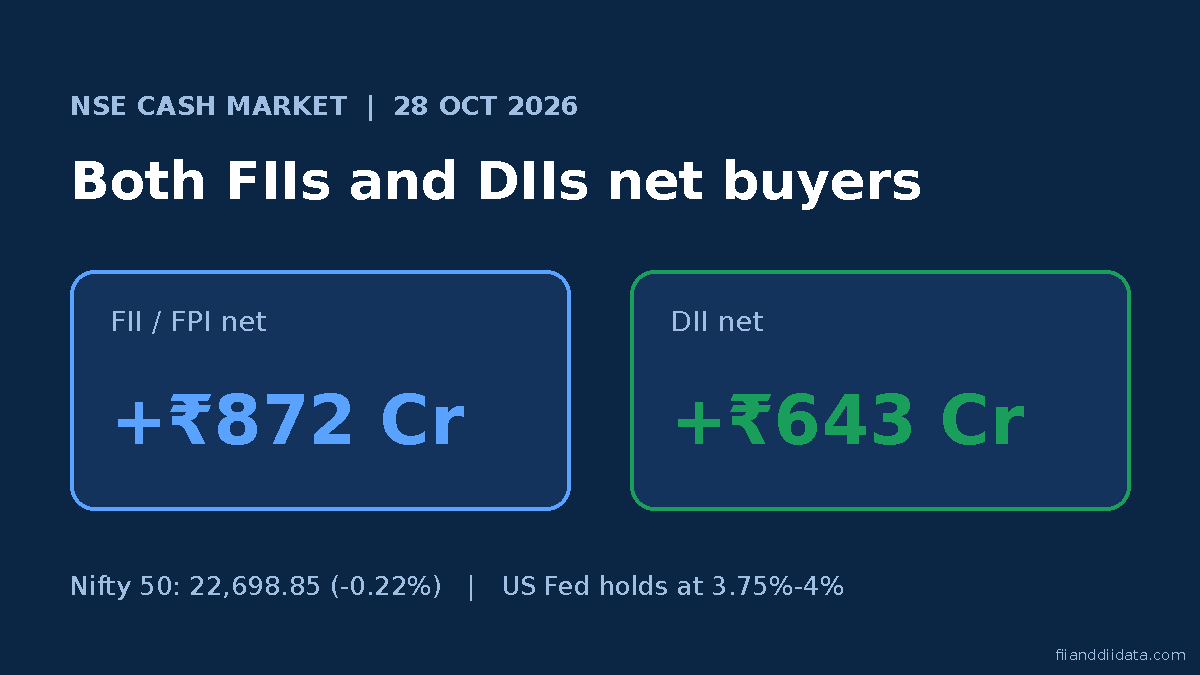
- Match it with cash flows. On 27 October 2026, FIIs bought a net ₹4,240 crore in the cash market while cutting futures shorts, a combination covered in our 27 October FII DII report.
- Flag expiry days and the session after, and give their changes less weight.
- Only then form a view, and keep your own stop-loss. The data describes positions; it does not predict the next candle.
A pattern traders watch closely: when FII shorts fall for several sessions while FIIs also buy in the cash market, the odds of a short covering rally rise. When FIIs add shorts and sell cash at the same time, rallies tend to fade. Even with a checklist, traders keep making the same errors.
Common Mistakes When Reading Participant Wise OI
- Treating it as intraday data. NSE publishes the file once, after the close. Intraday shifts are not visible.
- Reading the Total columns. They add bullish and bearish positions together and hide the real stance.
- Assuming every FII short is a bet on a fall. Part of it hedges large share holdings, and part is arbitrage.
- Ignoring expiry. As 27 October showed, open interest can drop 20% in a day for purely mechanical reasons.
- Comparing contract counts across years. Lot sizes change. SEBI raised the minimum contract value for index derivatives in November 2024, which made lots bigger, so 1 lakh contracts today is not the same exposure as 1 lakh contracts in 2022.
- Calling the Client group “dumb money”. It includes HNIs and corporates; extreme Client positioning is a caution sign, not an automatic contrarian signal.
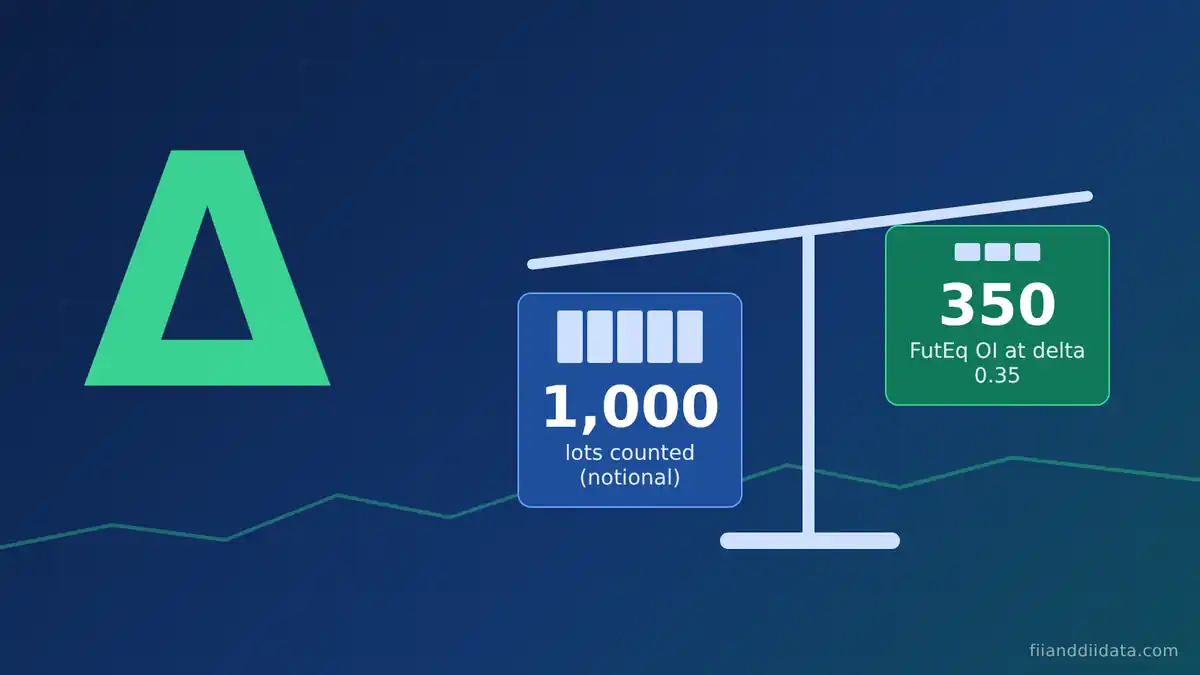
Position limits also matter. SEBI now measures many limits using delta based open interest rather than raw contract counts, explained in our guide to delta based open interest and FutEq OI. Finally, it helps to know where participant OI sits next to the other datasets traders use.
Participant OI vs Cash FII DII Data vs Option Chain
| Feature | Participant wise OI | Cash FII DII data | Option chain OI |
|---|---|---|---|
| What it measures | Open F&O contracts by group | Net buying or selling of shares by value | Open contracts by strike and expiry |
| Unit | Contracts | ₹ crore | Contracts |
| Shows who holds it | Yes, four groups | Yes, FII and DII only | No |
| Shows strikes | No | Not applicable | Yes |
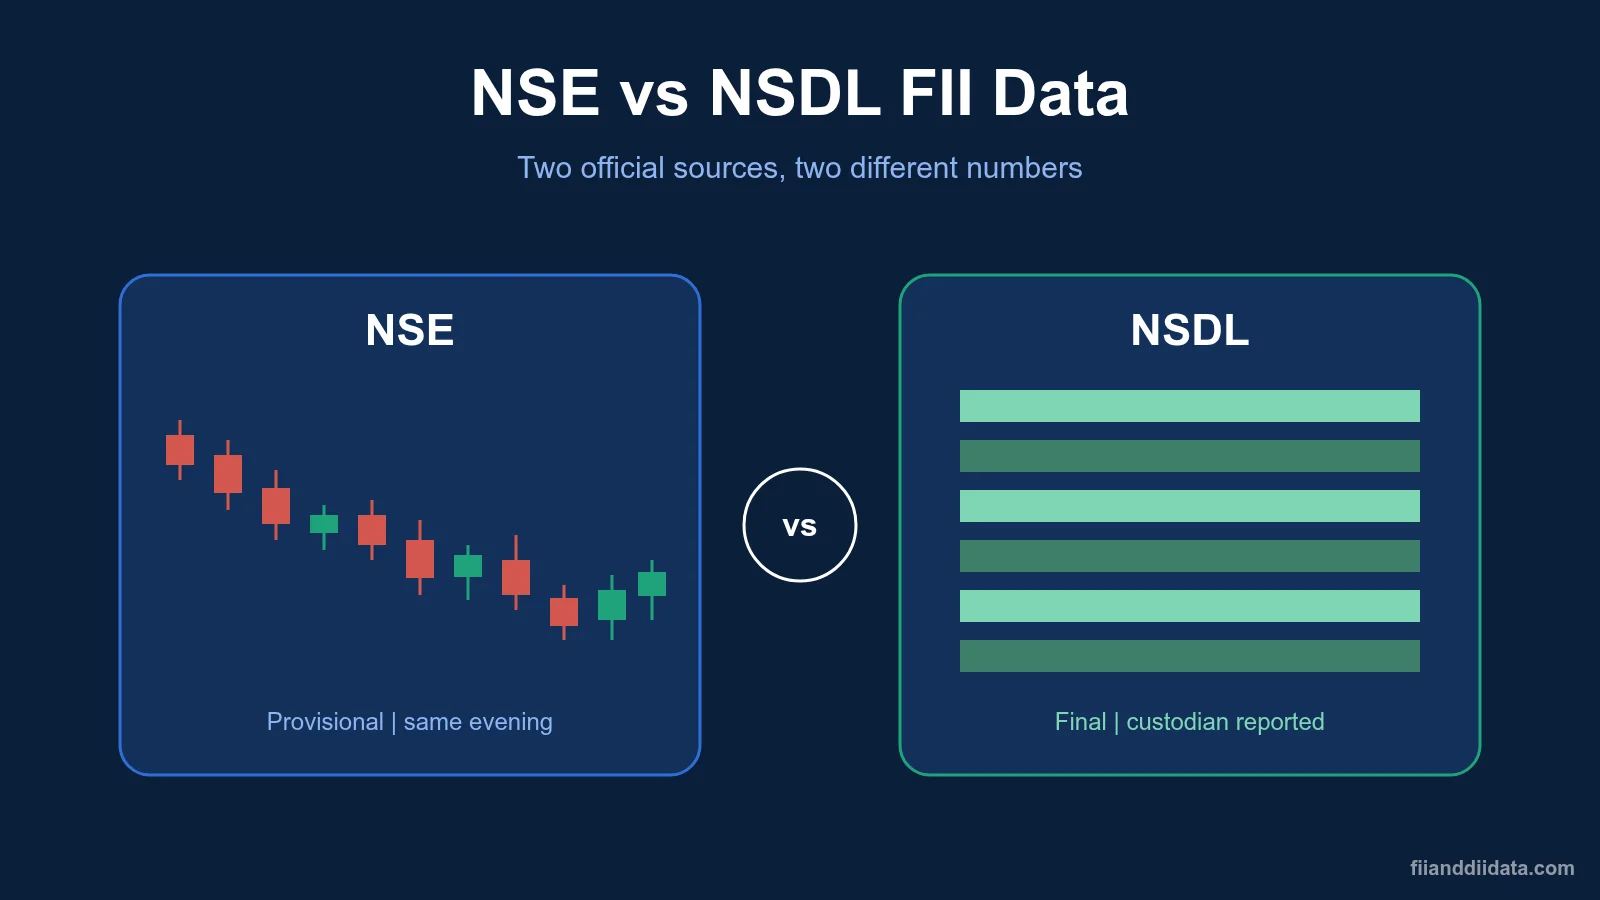
| Update | Once a day after close | NSE provisional around 6 PM IST | During market hours |
| Best use | Positioning trend | Money flow trend | Support and resistance levels |
The three work best together. Cash data shows where FII money is actually going, which you can follow on our FII DII data today page. Participant OI shows how they are positioned in derivatives. The option chain shows where the key strike levels sit. For all of them in one place, see our FII and DII data home page.
Frequently Asked Questions
What is the participant wise OI meaning in the stock market?
It is the daily NSE report that shows how many open futures and options contracts are held long and short by four groups: FII, DII, Pro and Client. It tells you who holds the open interest, not just how much exists.
What is Pro and Client in participant wise OI?
Pro means brokers and trading members trading with their own money. Client means all other accounts that are not FII, DII or Pro, including retail traders, HNIs and corporates.
What time is participant wise OI data released?
NSE publishes the file once per trading day after market close, usually in the evening. It is end-of-day data, so it does not show intraday changes.
How do you calculate net position from participant wise OI?
Subtract short contracts from long contracts for one group and one instrument. On 27 October 2026, FIIs held 33,588 long and 2,54,645 short index futures, a net of -2,21,057 contracts.
Is FII net short in index futures always bearish?
No. Part of the FII short hedges their large holdings of Indian shares, and part is arbitrage. A falling net short over several sessions, combined with FII cash buying, matters more than the size of the short on one day.
The Bottom Line
Participant wise OI answers one question the option chain cannot: who is holding the open contracts. In late October 2026, the answer was clear. FIIs held most of the index futures shorts and Clients held most of the longs, even after FIIs cut their net short by 56,048 contracts on expiry day.
Read it as a trend, not a trading signal for tomorrow. Start a simple 10-session log of the FII, Client and Pro net index futures positions, and check it against cash flows each evening. More guides like this are in our FII DII blog.
Sources: NSE derivatives reports, F&O participant wise open interest; Trendlyne participant wise OI, 27 October 2026; JustTicks participant data, 27 October 2026; AlgoTest NSE expiry calendar 2026; Business Standard on the SEBI F&O study, 7 July 2025; NSE provisional FII DII cash data, 27 October 2026.
Disclaimer: This article is for educational purposes only and is not investment advice. Please consult a SEBI-registered advisor before making investment decisions.