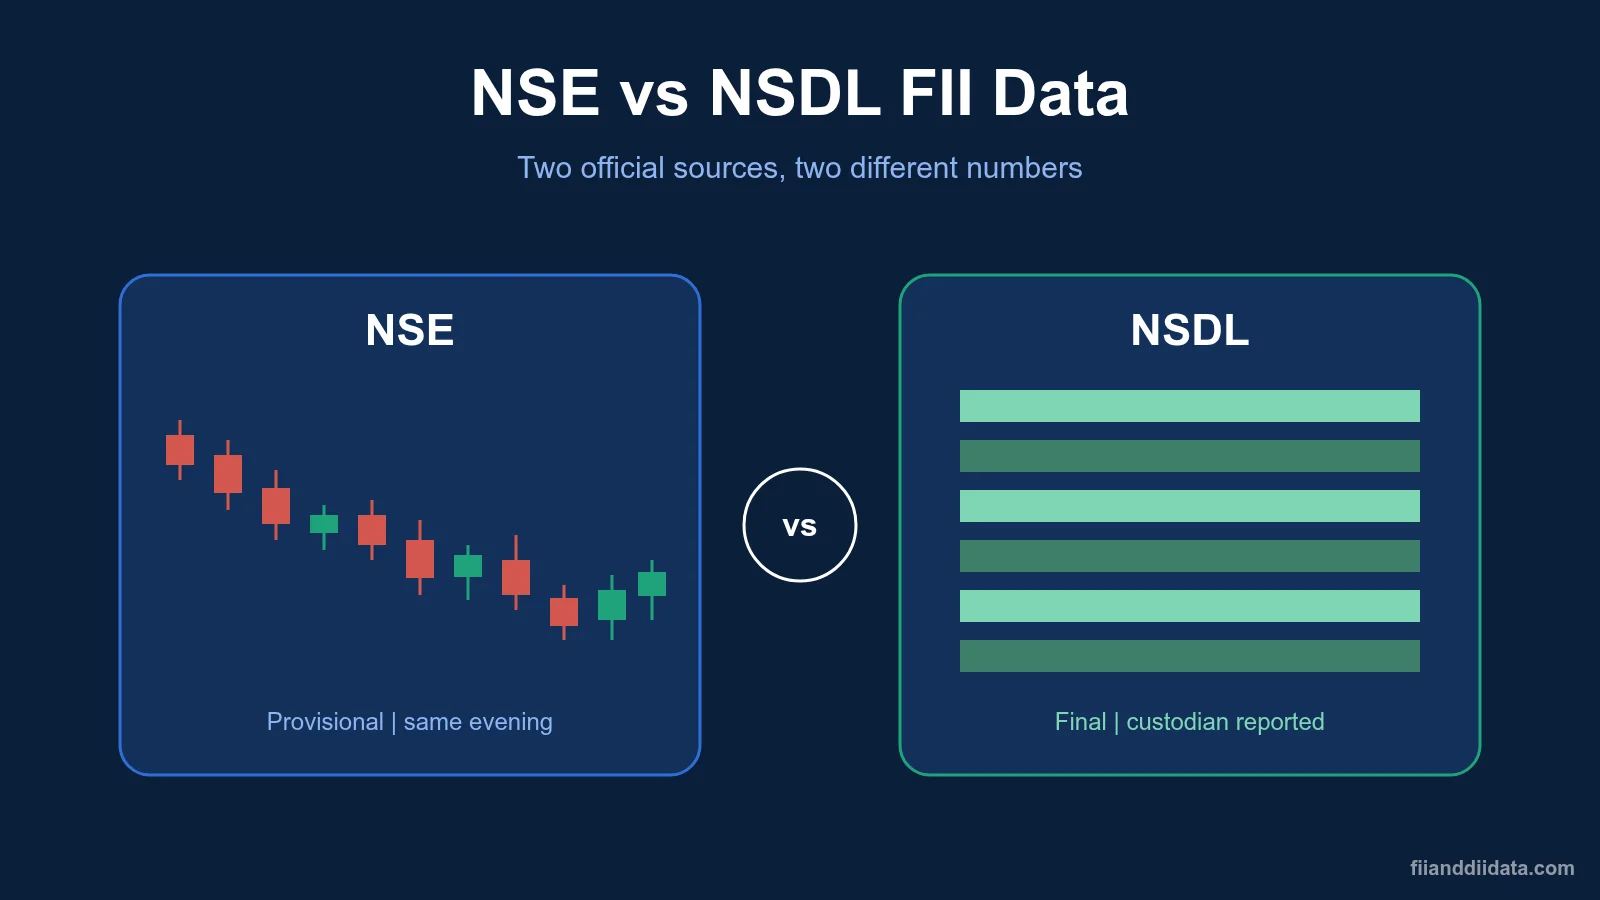
The NSE vs NSDL FII data gap comes down to one idea: NSE shows a quick provisional count of exchange trades on the same evening, while NSDL shows the final, custodian-confirmed record of everything foreign portfolio investors did. That is why, from 1 to 23 October 2026, NSE showed FIIs selling ₹51,466 crore while depository data showed a ₹48,056 crore outflow. Here is what each number means and which one to trust for what.
Key Takeaways
- NSE publishes provisional FII/FPI cash data around 6 PM IST; NSDL publishes final FPI data the next working day.
- NSE counts only exchange trades. NSDL also counts IPOs, QIPs, rights issues, preferential allotments and other primary deals.
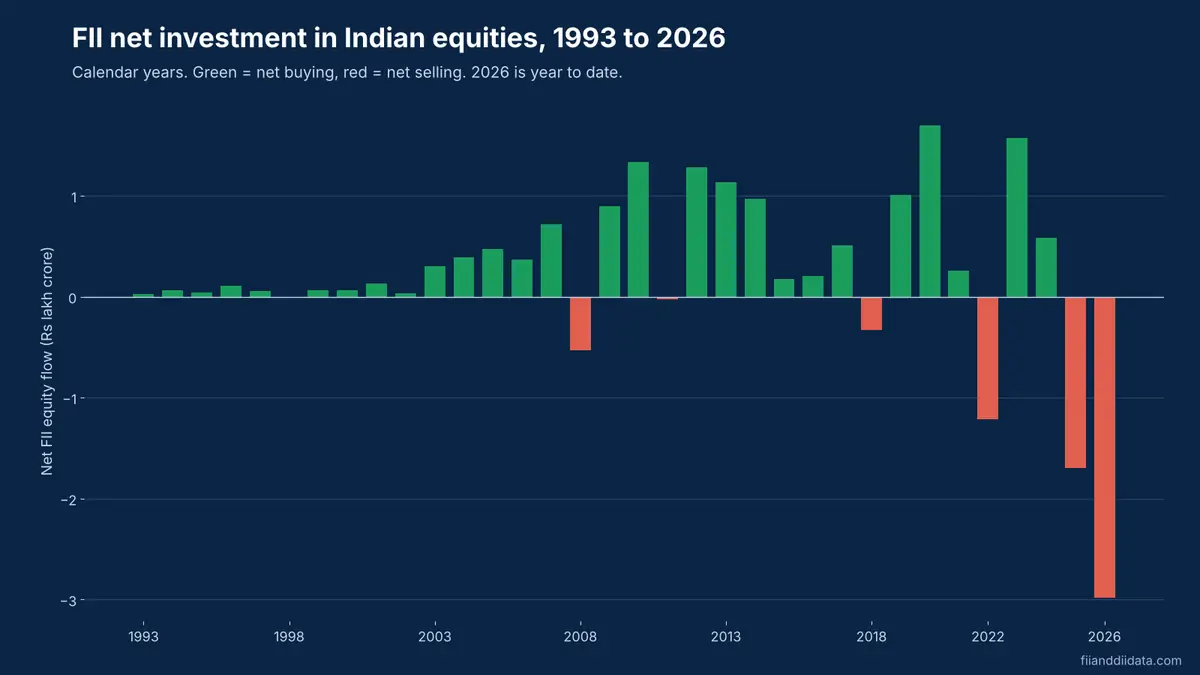
- From January to September 2026, NSE showed net FII selling of about ₹4.03 lakh crore against ₹2.60 lakh crore in depository data.
- NSE is better for the daily market read and DII flows; NSDL is the official record for monthly and yearly FPI totals.
- Never add or subtract the two series directly. Compare like with like.
Table of contents
- What Is the NSE vs NSDL FII Data Difference?
- How NSE Compiles Provisional FII Data
- How NSDL Compiles Final FPI Data
- NSE vs NSDL FII Data in 2026: The Month-by-Month Gap
- Why the Numbers Differ: 5 Reasons
- Which One Should You Use? Comparison and Checklist
- Common Mistakes When Reading Both Datasets
- Frequently Asked Questions
- The Bottom Line
What Is the NSE vs NSDL FII Data Difference?
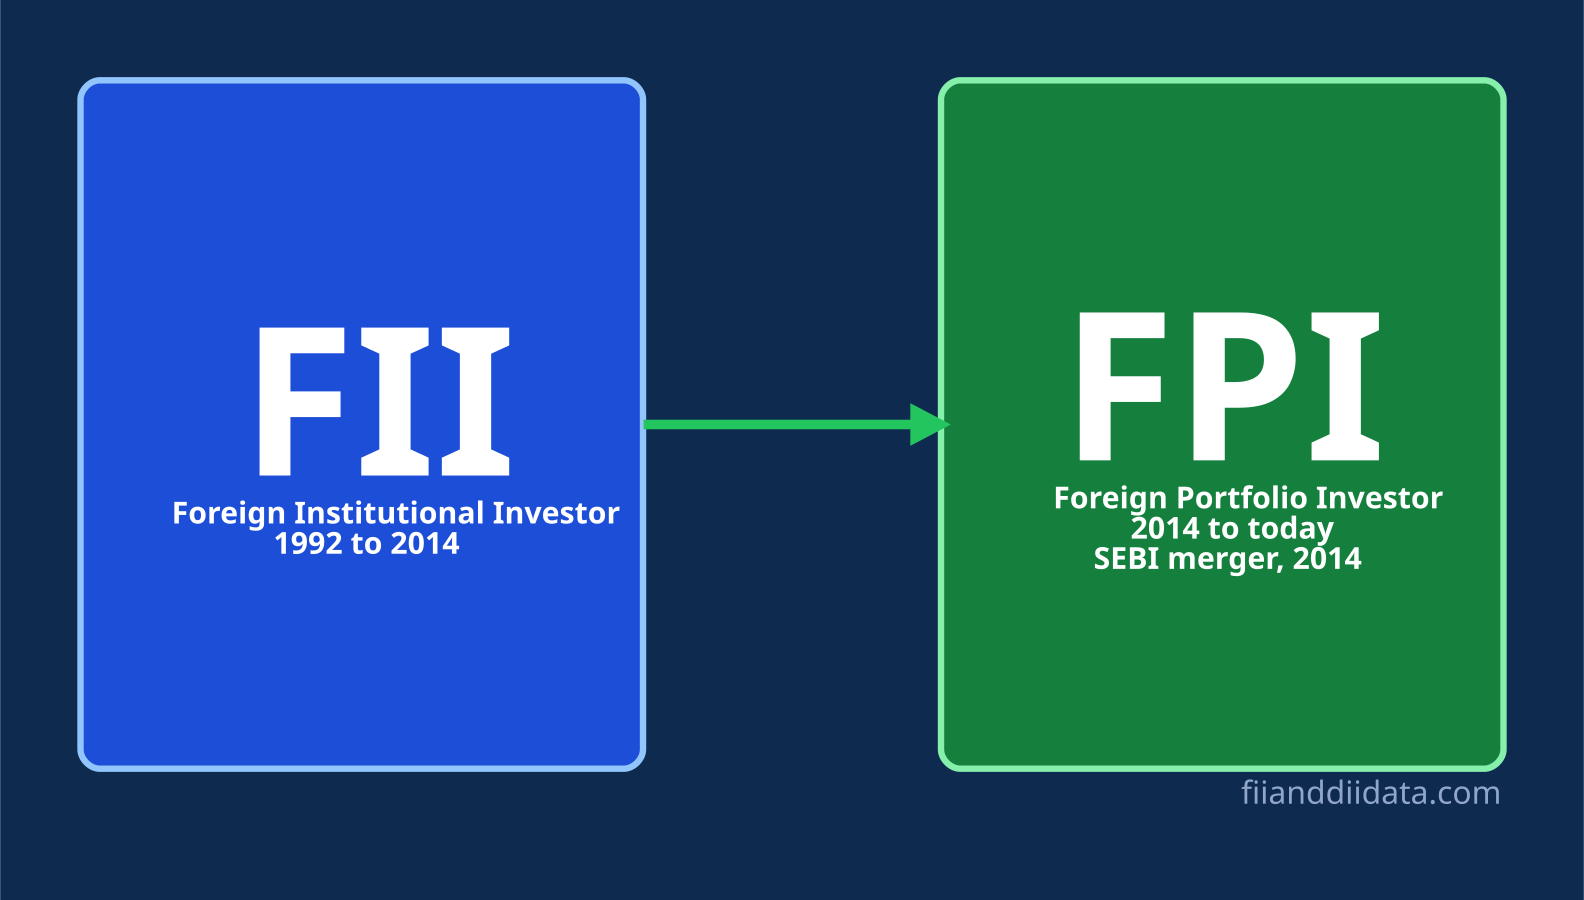
Both datasets track the same group of investors. Foreign institutional investors (FIIs) are now formally called foreign portfolio investors (FPIs) under SEBI rules, and we explain the naming in our guide on FII vs FPI. The difference is not who is counted. It is what gets counted, when, and how it is confirmed.
NSE publishes a combined FII/FPI and DII figure for trades on NSE, BSE and MSEI every trading day. The exchanges label it provisional and point readers to the depositories for final FPI numbers. NSDL, through its FPI Monitor, publishes the final FPI investment record built from custodian reports. One is a fast estimate. The other is the official ledger.
Think of it like a cricket score. NSE gives you the live score at stumps. NSDL gives you the scorecard after the umpires have checked every ball. Most of the time they tell the same story, but the final numbers rarely match to the last run. To see why, start with how NSE builds its figure.
How NSE Compiles Provisional FII Data
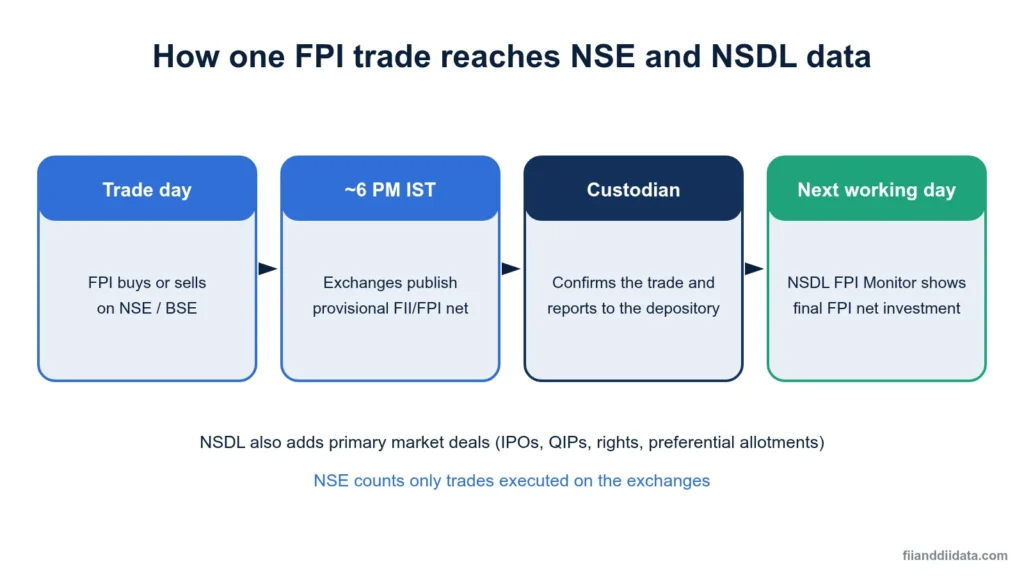
NSE builds its number from the client codes that brokers enter when they place orders. According to the note on the exchanges’ FII/DII activity page, NSE data is compiled from trading codes entered at order entry, while BSE uses the “client type” marked on each order. The exchanges then add up gross buying and gross selling by FIIs/FPIs and by DIIs across NSE, BSE and MSEI.
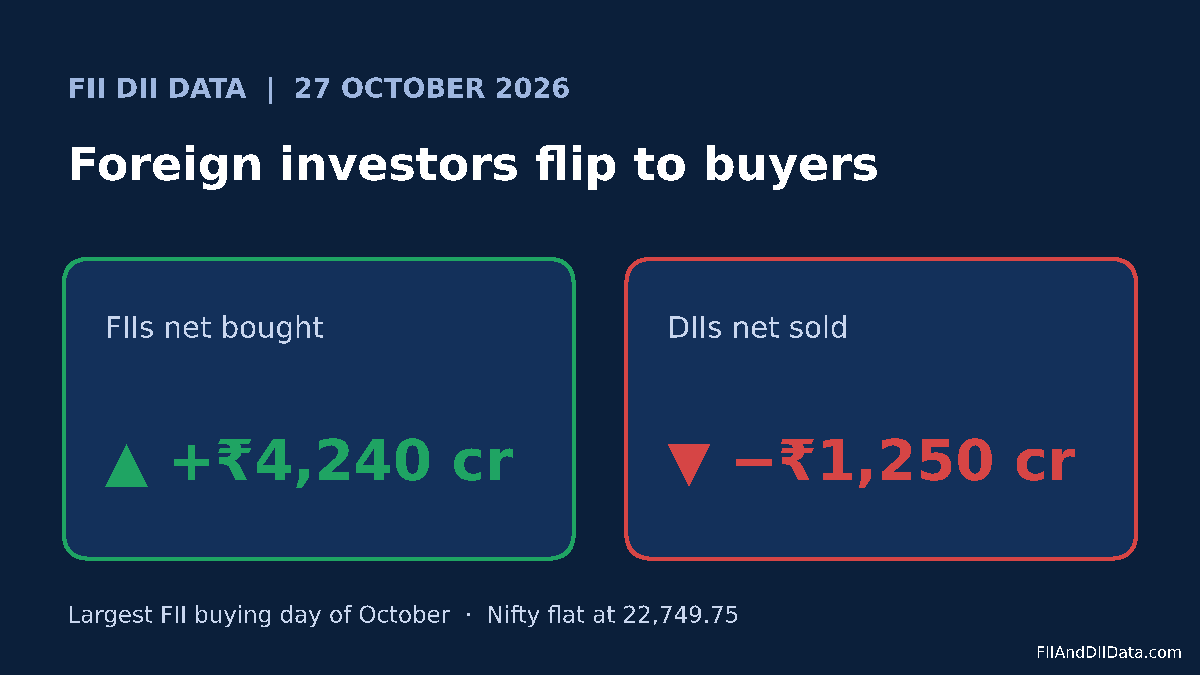
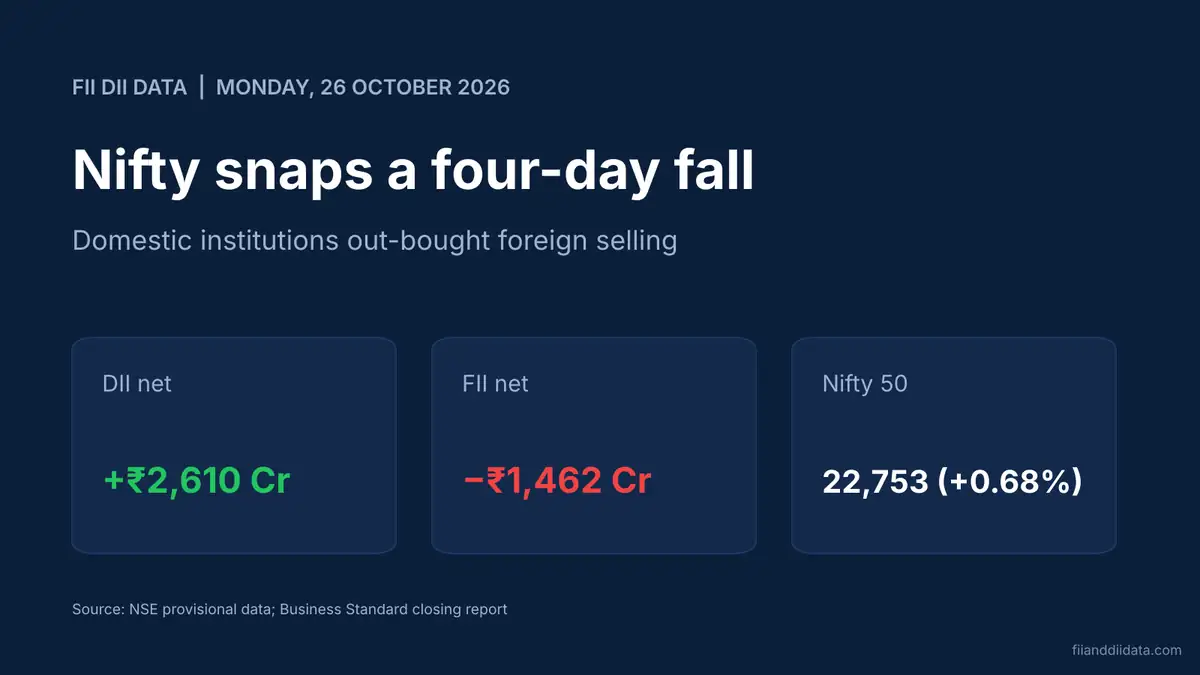
The figure usually appears on the NSE FII/DII trading activity report around 6 PM IST on trading days. For example, on 26 October 2026 NSE’s provisional data showed FIIs as net sellers of ₹1,462.49 crore and DIIs as net buyers of ₹2,609.57 crore. You can see each session’s numbers on our daily FII DII cash market summary.
What NSE FII data does not include
NSE’s figure covers only secondary market trades executed on the exchanges. It does not include shares an FPI gets in an IPO, a QIP or a preferential allotment, because those shares are not bought on the exchange. It is also “subject to change” after custodians confirm the trades. Keep that in mind, because the next dataset handles all of this differently.
How NSDL Compiles Final FPI Data
NSDL’s FPI Monitor is built from reports that custodians submit to SEBI and the depositories. A custodian is the bank that holds securities and settles trades for a foreign fund. The NSDL site states that its daily figures “constitute trades conducted by FPIs on and up to the previous trading day(s).” So the number you see on a Tuesday morning mostly reflects Monday’s activity.
Because the data comes from custodians, it covers every registered FPI and every route through which they buy or sell Indian securities. NSDL also splits flows by asset class: equity, debt, debt under the voluntary retention route, hybrid instruments, mutual funds and AIFs. Rupee values are converted to US dollars using the RBI reference rate for the trading day, a method NSDL has followed since 1 January 1999.
The stock exchange route vs primary market and others
Within equity, NSDL reports two buckets. The stock exchange bucket covers secondary market purchases and sales of shares. The primary market and others bucket covers IPO and preferential allotments, rights issues, conversion of debentures to equity, bonus shares, open offers, buybacks and similar events, according to the NSDL note on FPI investment data.
This second bucket matters a lot in 2026. As of 1 October 2026, NSDL data cited by Mint showed FPIs had sold about ₹2.96 lakh crore through the exchange route but bought about ₹54,398 crore through the primary market, largely via IPOs. NSE’s daily figure sees only the first part of that story. The next section shows how big the gap became month by month.
NSE vs NSDL FII Data in 2026: The Month-by-Month Gap
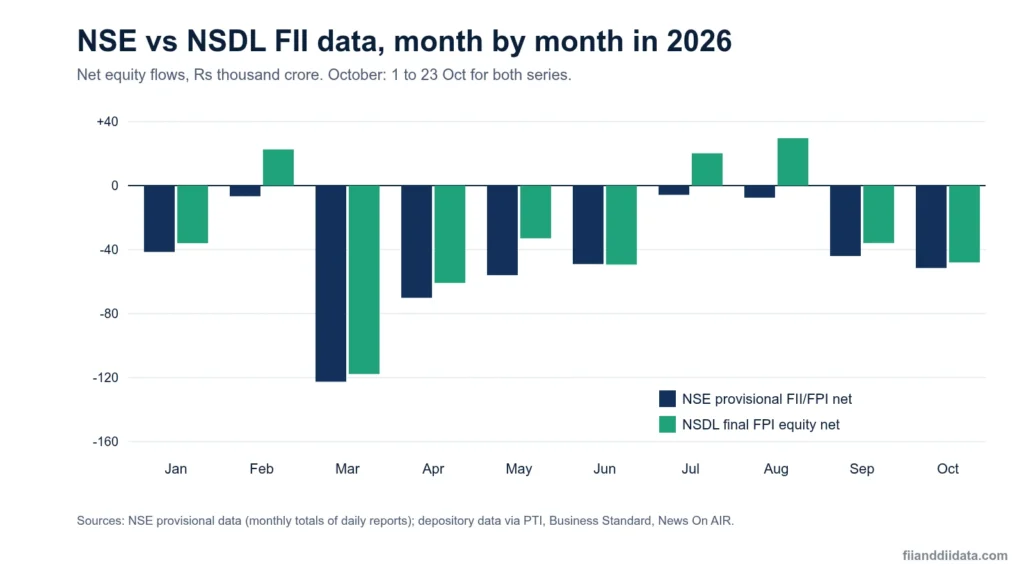
The table below places NSE’s provisional FII/FPI net figure next to NSDL’s final FPI equity figure for each month of 2026. A positive gap means the depository data showed less selling (or more buying) than NSE.
| Month (2026) | NSE provisional FII net (₹ cr) | NSDL FPI equity net (₹ cr) | Gap, NSDL minus NSE (₹ cr) |
|---|---|---|---|
| January | -41,435 | -35,962 | +5,473 |
| February | -6,641 | +22,615 | +29,256 |
| March | -1,22,540 | -1,17,775 | +4,765 |
| April | -70,135 | -60,847 | +9,288 |
| May | -55,963 | -32,963 | +23,000 |
| June | -49,029 | -49,340 | -311 |
| July | -5,779 | +20,200 | +25,979 |
| August | -7,532 | +29,631 | +37,163 |
| September | -44,013 | -35,861 | +8,152 |
| October (1 to 23 Oct) | -51,466 | -48,056 | +3,410 |
| January to September | -4,03,067 | -2,60,302 | +1,42,765 |
Three patterns stand out. First, depository data showed less selling than NSE in nine of the ten periods. Second, in February, July and August the two sources disagreed on direction: NSE showed mild FII selling while NSDL showed FPIs as net buyers of ₹20,000 crore or more. Third, the cumulative gap is large. Over nine months it reached about ₹1.43 lakh crore.
For the latest full-month totals on the NSE side, see our FII DII monthly data page. For the NSDL side and the record ₹3.08 lakh crore outflow this year, read our FPI outflow 2026 breakdown. Now let us look at what drives this gap.
Why NSE vs NSDL FII Data Numbers Differ: 5 Reasons
Neither NSE nor NSDL publishes a reconciliation between the two series, so no one can split the gap to the last rupee. What we can do is list the known differences in method. These five explain almost every mismatch you will see.
- Scope. NSDL adds primary market and other deals: IPOs, QIPs, rights, preferential allotments, buybacks and open offers. NSE counts only exchange trades. In a year when FPIs bought about ₹54,398 crore through IPOs by 1 October, this alone moves the numbers a lot.
- Classification. NSE tags trades by the client code a broker enters at order entry. NSDL counts what custodians report for registered FPIs. Any trade tagged one way at the exchange and reported another way by the custodian creates a difference.
- Timing. NSE reports the same day. NSDL reports trades up to the previous trading day, based on custodian filings. So a month-end cut-off on NSE and on NSDL rarely covers exactly the same trades.
- Confirmation. NSE’s figure is provisional and can change after custodial confirmation. NSDL’s figure is the confirmed one.
- Asset coverage. NSDL also reports debt, hybrid, mutual fund and AIF flows. If you compare NSE’s cash market number with NSDL’s total across all assets instead of equity only, you will get a false gap.
Worked example: how NSE vs NSDL FII data can point in opposite directions
Take a simple illustration with round numbers. On one trading day, FPIs buy ₹4,000 crore of shares on the exchanges and sell ₹5,000 crore. On the same day, a large IPO allots ₹1,500 crore of new shares to FPI anchor and QIB investors.
- NSE that evening: ₹4,000 crore minus ₹5,000 crore = ₹1,000 crore net selling.
- NSDL the next working day: ₹1,000 crore net selling on the exchange route plus ₹1,500 crore primary market buying = ₹500 crore net buying.
Both numbers are correct for what they measure. This is exactly what happened at a larger scale in February 2026, when NSE showed net FII selling of ₹6,641 crore but depository data showed FPIs investing ₹22,615 crore in equities. It is also why FPIs could be heavy sellers in October 2026 and still take a big share of the Jio Platforms anchor book, as we covered in FPI selling October 2026. So which dataset should you actually use?
Which One Should You Use? Comparison and Checklist
Each dataset answers a different question. The table sums up the practical differences.
| Feature | NSE provisional data | NSDL final data |
|---|---|---|
| Release time | Around 6 PM IST, same trading day | Next working day |
| Status | Provisional, can change | Final, custodian-confirmed |
| Investors covered | FII/FPI and DII | FPI only, no DII |
| Scope | Exchange trades on NSE, BSE and MSEI | Exchange trades plus primary market and others |
| Asset classes | Cash equity (F&O shown separately) | Equity, debt, VRR, hybrid, MF, AIF |
| Extra detail | Gross buy and gross sell by category | Rupee and dollar values, fortnightly sector flows |
| Best for | Daily market mood, short-term trading | Monthly and yearly totals, reports, research |
A 6-point checklist for using NSE vs NSDL FII data
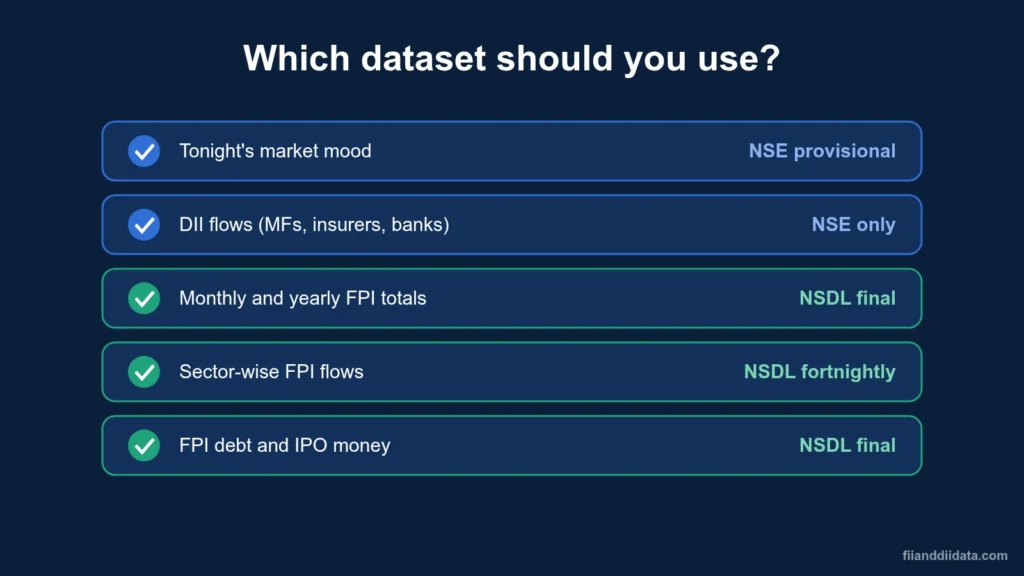
- For tonight’s market read, use NSE’s provisional FII and DII cash numbers.
- For DII flows (mutual funds, insurers, banks, pension funds), use NSE. NSDL does not report DIIs.
- For any monthly or yearly FPI total you quote in a report, use NSDL equity data.
- For sector-wise FPI flows, use NSDL’s fortnightly sector report.
- Before you compare the two, match the date range and check that you are using NSDL equity only.
- In a busy IPO month, expect NSDL to look less negative than NSE, and do not read that as a hidden buying signal.
For futures and options positioning, neither cash dataset is enough; look at participant-wise F&O data instead. If you want the step-by-step route to each source, our guide shows how to check NSE vs NSDL FII data on the official websites. Next, the mistakes that trip up most readers.
Common Mistakes When Reading Both Datasets
Most confusion about FII flows comes from mixing the two sources. Watch out for these five errors.
- Subtracting one from the other. NSDL minus NSE does not give you the exact primary market figure, because the series also differ in classification and timing.
- Mixing date ranges. A news report saying “FPIs sold ₹44,166 crore in October” on 11 October 2026 covered only part of the month. Always check the cut-off date.
- Using NSDL’s all-asset total. Compare NSE cash data with NSDL equity flows only, not equity plus debt.
- Treating provisional data as final. NSE’s daily figure is an early read. Do not build long-term conclusions on one session.
- Looking for DII data on NSDL. It is not there. Domestic institutional flows come from the exchanges, and mutual fund flows also from AMFI.
Avoid these and the two datasets stop looking contradictory. They start working together: NSE for speed, NSDL for accuracy. The questions below cover what readers ask most often.
Frequently Asked Questions
Why is NSE vs NSDL FII data different?
NSE shows provisional exchange trades by FIIs on the same evening, based on client codes. NSDL shows final, custodian-reported FPI flows the next working day, and it also includes primary market deals such as IPOs, QIPs and preferential allotments. Different scope, timing and classification create the gap.
Which is more accurate, NSE FII data or NSDL FPI data?
NSDL data is the final, official record of FPI investment and is the better choice for monthly and yearly totals. NSE data is provisional but arrives faster, so it is more useful for reading the market on a given day.
What time is NSE FII DII data released?
NSE usually publishes provisional FII/FPI and DII cash market data around 6 PM IST on trading days. NSDL publishes final FPI data on the next working day.
Does NSDL publish DII data?
No. NSDL tracks only foreign portfolio investors. For domestic institutional investor flows, use the daily FII/DII report from the exchanges, and AMFI data for mutual fund flows.
Why does NSDL show FPI buying when NSE shows FII selling?
This usually happens in months with large IPOs or QIPs. FPIs may sell on the exchange, which NSE records, while buying new shares in the primary market, which only NSDL records. In February 2026, NSE showed net FII selling of Rs 6,641 crore while depository data showed net FPI equity buying of Rs 22,615 crore.
The Bottom Line
NSE and NSDL are not giving you conflicting facts. They are measuring different things at different speeds. NSE tells you, the same evening, how foreign and domestic institutions traded on the exchanges. NSDL tells you, a day later, the confirmed total of everything foreign portfolio investors did, including IPO and QIP money.
In 2026 that difference has been unusually large, about ₹1.43 lakh crore over nine months, because FPIs kept selling listed shares while buying into new issues. Use NSE for the daily read and DII flows, use NSDL for any total you quote, and always match the dates. As a next step, bookmark our FII DII data dashboard for the daily numbers and browse more explainers on the FIIAndDIIData.com blog.
Sources: NSDL FPI Monitor, note on daily FPI data; NSE FII/DII trading activity; MSEI FII/DII activity notes; Business Standard, 11 Oct 2026; News On AIR, 1 Mar 2026; Mint via NiftyTrader, 1 Oct 2026; PTI via The Hans India and Millennium Post, 25-26 Oct 2026; Outlook Money, 1 Aug 2026.
Disclaimer: This article is for educational purposes only and is not investment advice. Please consult a SEBI-registered advisor before making investment decisions.