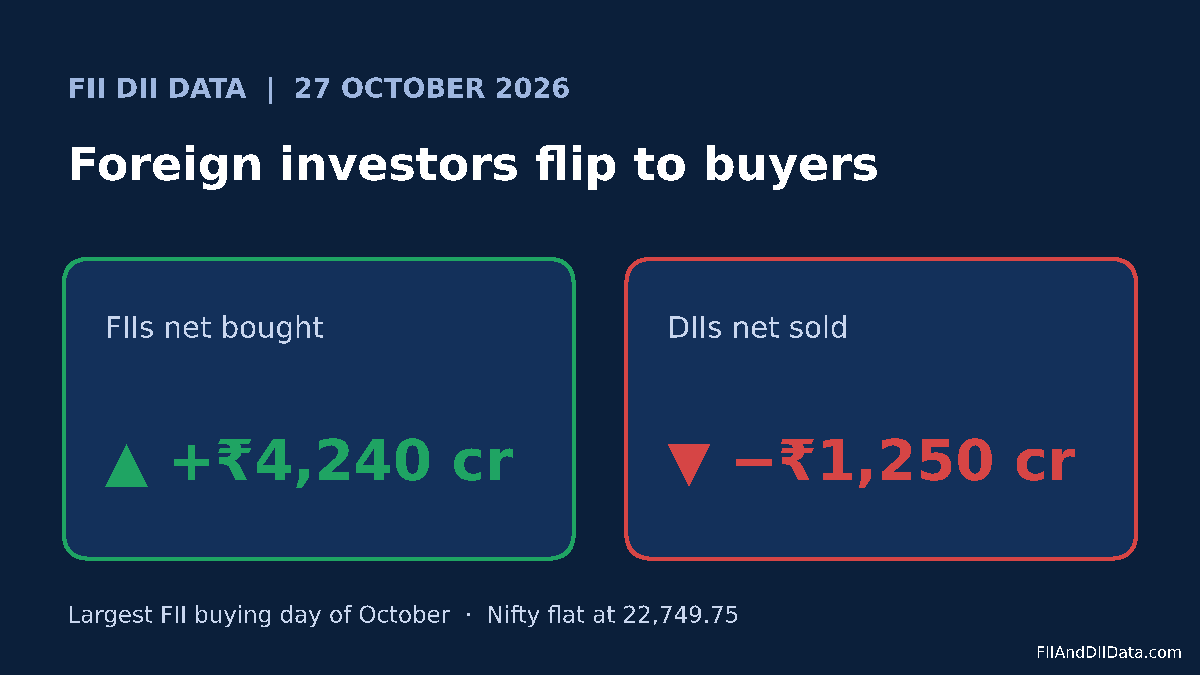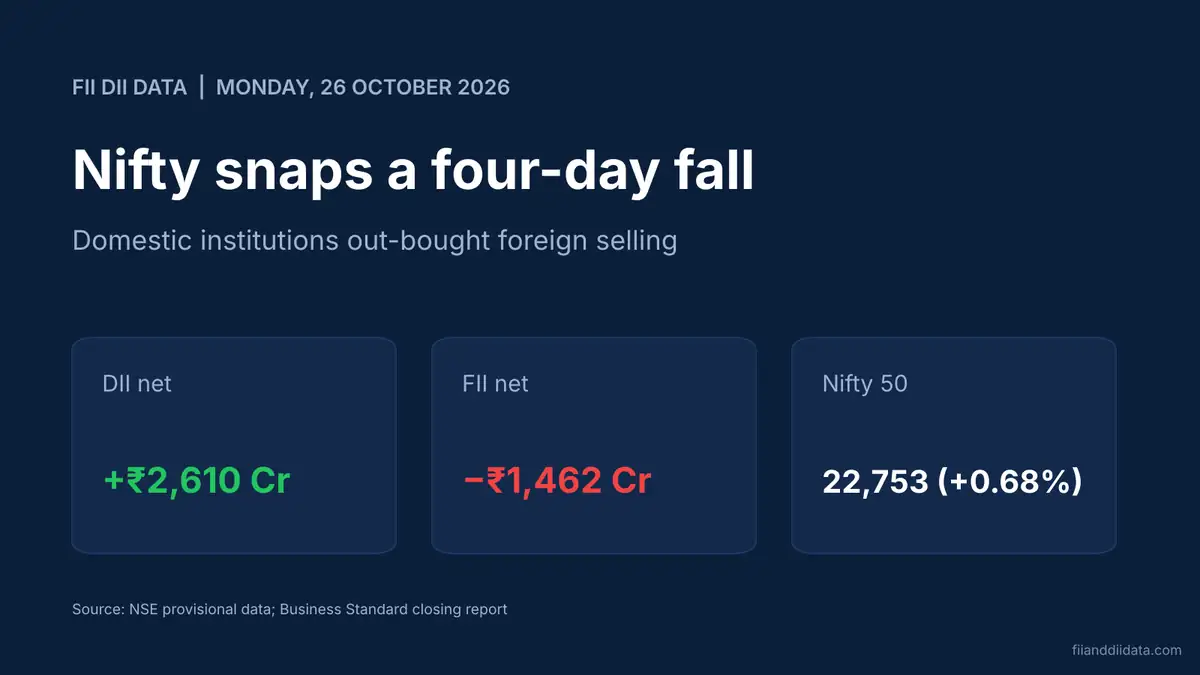
To learn how to check FII DII data, start with the NSE report called “FII/FPI and DII trading activity”, which shows each day’s institutional buying and selling in the cash market. On 26 October 2026, that report showed FIIs as net sellers of Rs 1,462 crore while DIIs bought Rs 2,610 crore. This guide shows where to find these numbers, when they are released, and how to read them without common errors.
Key Takeaways
- NSE publishes provisional FII and DII cash market figures around 6 PM IST on every trading day.
- Depository data from NSDL and CDSL is the final record of FPI investment and comes the next working day.
- Exchange and depository numbers rarely match because they cover different trades and dates.
- Always read gross buy, gross sell and net value together, and check the trade date on the row.
- Use F&O participant data with cash data, since FIIs often hedge cash positions with index futures.
Contents
- What FII DII Data Tells You
- Where to Check FII DII Data: 6 Sources Compared
- How to Check FII DII Data on NSE in 5 Steps
- How to Check FPI Data on NSDL and CDSL
- Provisional vs Final Data: Why the Numbers Differ
- How to Read the Numbers: A Worked Example
- A 7-Point Daily Checklist for Traders
- Common Mistakes When You Check FII DII Data
- Frequently Asked Questions
- The Bottom Line
What FII DII Data Tells You
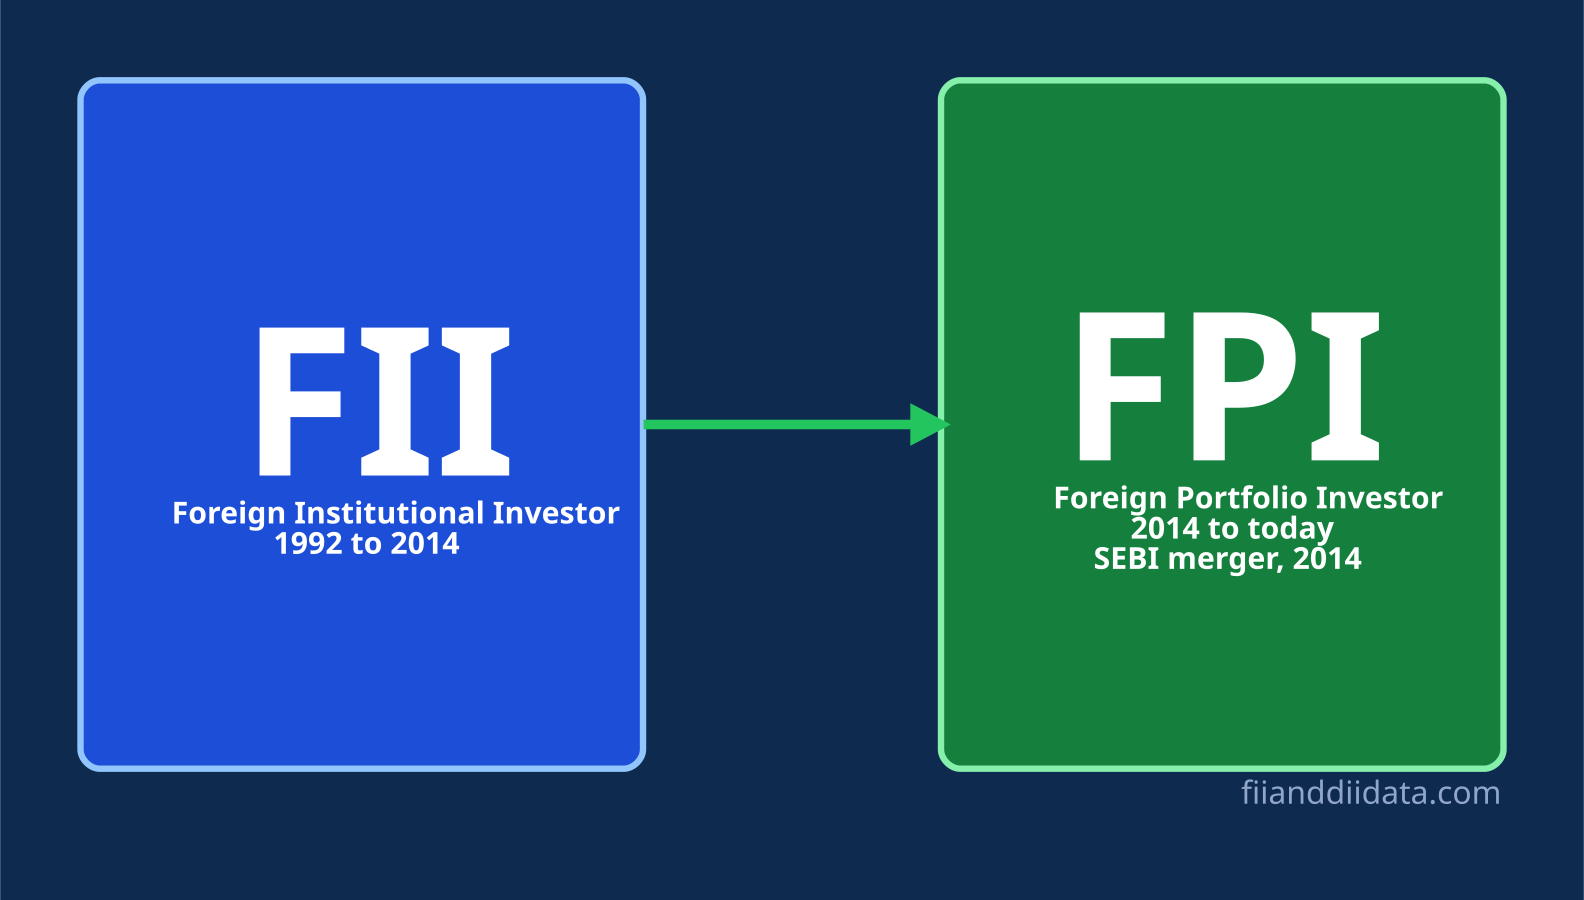
FII stands for foreign institutional investor. SEBI now calls this group foreign portfolio investors, or FPIs, and the two terms mean the same set of overseas funds. DII stands for domestic institutional investor, which covers mutual funds, insurance companies such as LIC, banks and pension funds. If you are new to these terms, our guide on what FII and DII data means covers the basics, and it also explains why FII and FPI are used as the same term.
The daily report shows three numbers for each group. Gross buy is the total value of shares bought. Gross sell is the total value sold. Net value is gross buy minus gross sell. A positive net value means the group was a net buyer that day, and a negative value means it was a net seller. All values are in Rs crore.
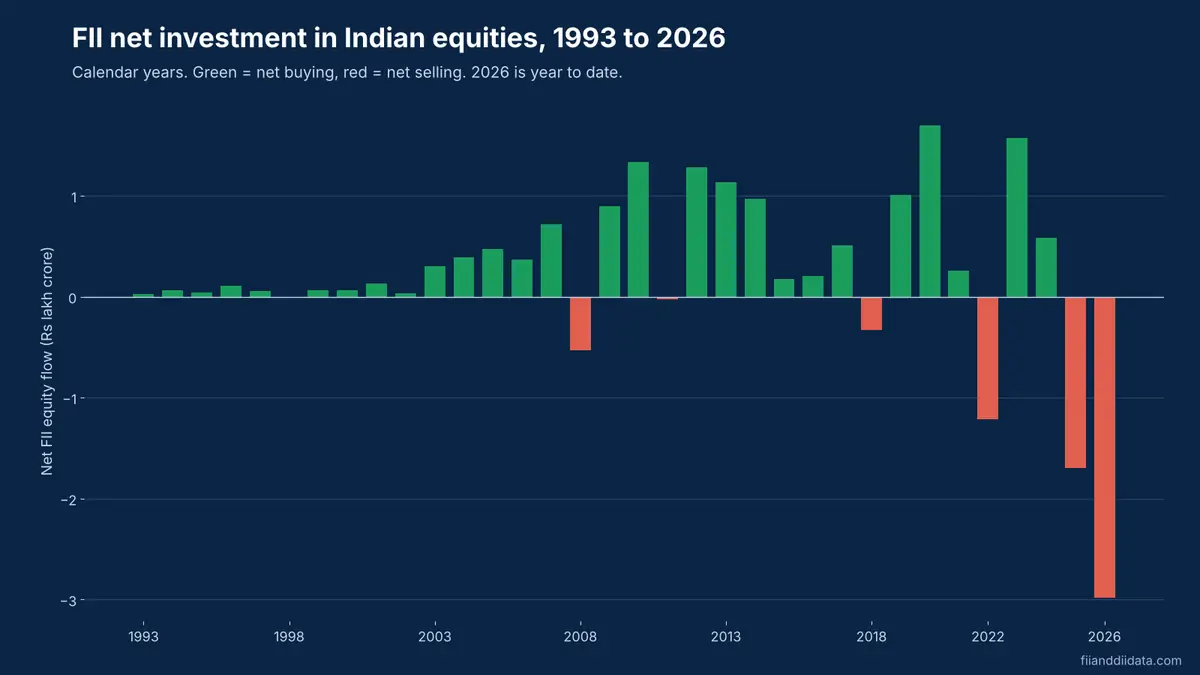
These flows matter because institutions trade in large size. Heavy FII selling can pull the Nifty lower and weaken the rupee, while steady DII buying can cushion the fall. In 2026, depository data shows FPIs have withdrawn about Rs 3.08 lakh crore from Indian equities, so knowing where to check these numbers is a practical skill for any trader. The next section lists the sources worth using.
Where to Check FII DII Data: 6 Sources Compared
Every FII DII number you see on a website or app comes from one of two places: the stock exchanges or the depositories. Exchanges give the fastest view. Depositories give the final view. Here is how the main sources compare.
| Source | What it shows | When it updates | Best for |
|---|---|---|---|
| NSE FII/FPI and DII report | Cash market buy, sell and net for FIIs and DIIs; NSE-only and combined NSE, BSE and MSEI tables; CSV download | Around 6 PM IST on trading days | Daily tracking |
| BSE FII/DII activity page | Parallel provisional cash market figures | After market close | Cross-checking NSE |
| NSE participant-wise OI report | Open interest of FIIs, DIIs, Pro and Client in index futures, stock futures and options | Evening, after the F&O session | Derivatives positioning |
| NSDL and CDSL FPI data | Final FPI investment in equity, debt and hybrid, including primary market | Next working day | Monthly and yearly totals |
| SEBI bulletin | Aggregated monthly FPI flows | Monthly | Long-term research |
| Data websites and broker apps | Republished exchange data with charts and history | Shortly after NSE releases | Quick reading on mobile |
For a single place that collects the daily cash figures, our page to check FII DII data today updates each evening with the latest provisional numbers. For month-wise totals, use the FII DII monthly data table. Now let us walk through the official NSE report step by step.

How to Check FII DII Data on NSE in 5 Steps
The NSE report is the primary source for daily cash market flows. Its full title is “FII/FPI and DII trading activity in Capital Market segment”. Follow these five steps.
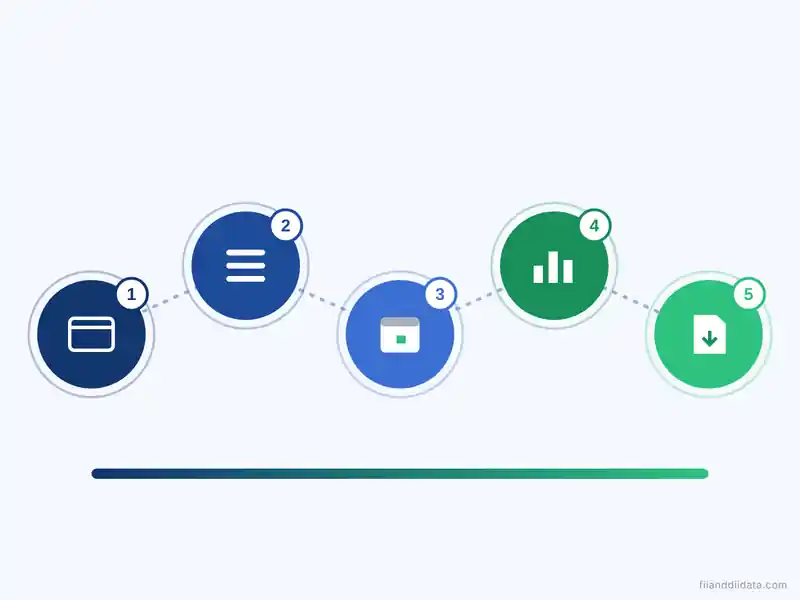
- Open the report. Go to the NSE FII/FPI and DII trading activity page. You can also reach it from the Reports menu on the NSE website.
- Pick the right table. The page has two tables. One covers trades on NSE only. The other combines NSE, BSE and MSEI. Most news reports quote the combined figure, so use that one when you compare numbers.
- Check the date. Confirm the trade date printed on the row. If you open the page before 6 PM, you will still see the previous session.
- Read buy, sell and net. Note the gross buy, gross sell and net value for both FII/FPI and DII. Watch the minus sign on the net value.
- Download the CSV. Use the download link to save the row. Over a few weeks, this gives you your own record of the trend.
How to check FII DII data for the F&O segment
The cash report does not show derivatives. For that, NSE publishes a participant-wise open interest file each evening in its F&O reports section. Open interest is the number of contracts still open at the end of the day. The file splits it among four groups: FII, DII, Pro (brokers trading their own money) and Client (retail and other investors). Our participant-wise open interest tracker and FII DII F&O data page turn this file into easy tables. Next, we cover the depository side, which gives the final word on FPI flows.
How to Check FPI Data on NSDL and CDSL
India has two depositories, NSDL and CDSL. They hold shares in electronic form and record every FPI investment after custodians confirm it. Their FPI reports show daily, monthly and yearly net investment, split into equity, debt, debt through the Voluntary Retention Route and hybrid. They also count money that FPIs put into IPOs and other primary market deals, which the exchange report does not capture.
This is why news reports on monthly FPI flows quote depository data. For example, a Press Trust of India report published by Business Standard on 25 October 2026 said FPIs had withdrawn Rs 48,056 crore from equities in October so far, citing depository data. The same report said total equity outflows for 2026 had reached Rs 3.08 lakh crore, well above the Rs 1.66 lakh crore pulled out in all of 2025.
When to use depository data
Use depository data for monthly and yearly totals, for debt market flows, and for any number you plan to quote in a report. Use the NSE report for the daily market read. Our post on FPI outflow 2026 uses depository data to show the month-wise picture. But if both sources track the same investors, why do their numbers differ? The next section explains.
Provisional vs Final Data: Why the Numbers Differ
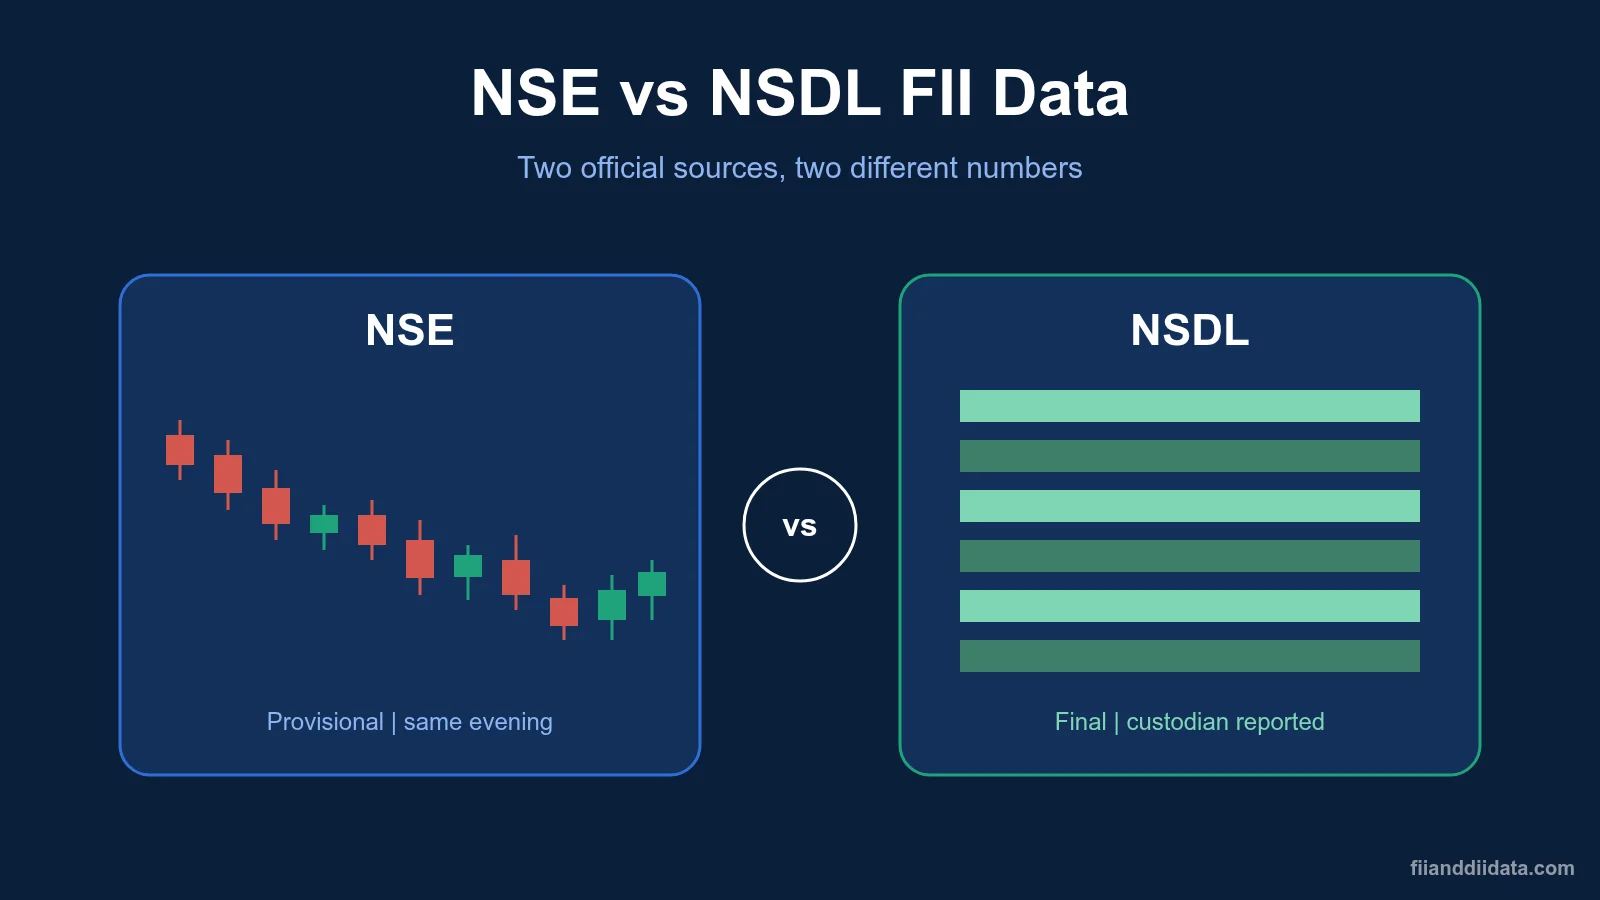
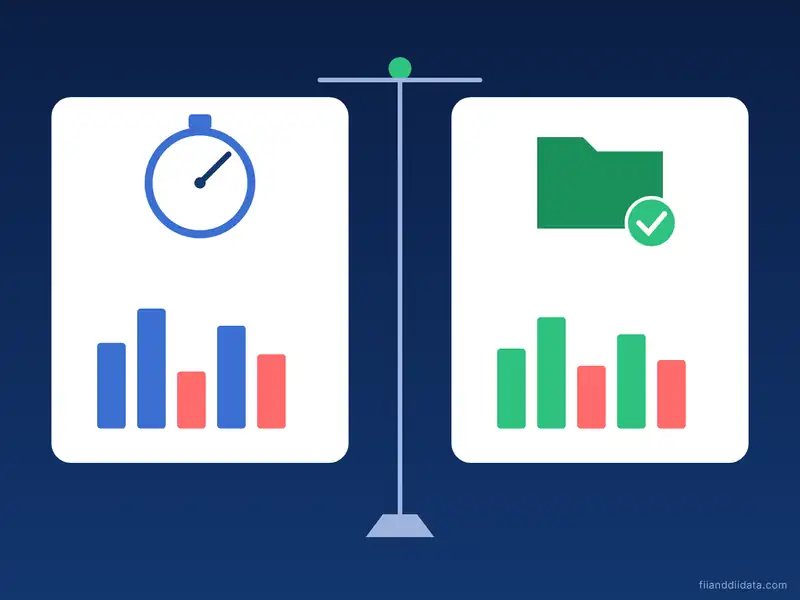
The NSE figures are provisional. They are based on trades tagged to FII and DII client codes on the exchange that day. Depository figures are final. They are based on settled trades confirmed by custodians, and they include primary market and other investments. Three things cause the gap.
- Coverage: exchange data covers only secondary market trades. Depository data adds IPO allotments, anchor investments, QIPs and other primary market routes.
- Timing: exchange data is dated by trade day. Depository data is dated by when the custodian reports, often a day later.
- Scope: depository equity figures can include instruments that never pass through the exchange cash segment.
October 2026 shows the gap clearly. Exchange data compiled by NiftyTrader puts FII net selling at Rs 52,929 crore for October up to 26 October. Taking out that day’s Rs 1,462 crore of selling leaves about Rs 51,467 crore up to 23 October. Depository data for roughly the same period showed Rs 48,056 crore of outflow, a gap of about Rs 3,411 crore. Part of that gap reflects the large primary market deals of the month, such as the Rs 30,213 crore Jio Platforms IPO, where FPI buying shows up in depository data but not in the exchange report.
Neither number is wrong. They answer different questions. With that settled, let us read a real day of data.
How to Read the Numbers: A Worked Example
The table below shows the last five sessions of provisional cash market data available on 27 October 2026.
| Date | FII gross buy | FII gross sell | FII net | DII net |
|---|---|---|---|---|
| 26 Oct 2026 | 9,324.90 | 10,787.39 | -1,462.49 | +2,609.57 |
| 23 Oct 2026 | 14,445.54 | 13,557.89 | +887.65 | +3,235.36 |
| 22 Oct 2026 | 13,627.54 | 17,086.24 | -3,458.70 | +2,891.32 |
| 21 Oct 2026 | 17,003.90 | 15,981.58 | +1,022.32 | +1,614.32 |
| 19 Oct 2026 | 11,240.64 | 12,389.28 | -1,148.64 | +3,201.19 |
Take 26 October. FIIs bought shares worth Rs 9,324.90 crore and sold Rs 10,787.39 crore. Net value = 9,324.90 minus 10,787.39 = minus Rs 1,462.49 crore, so FIIs were net sellers. DIIs bought Rs 17,389.57 crore and sold Rs 14,780.00 crore, a net purchase of Rs 2,609.57 crore. Add the two and combined institutional flow was a net Rs 1,147.08 crore positive. DIIs more than absorbed foreign selling that day.
Now zoom out. Over these five sessions, FIIs were net sellers of Rs 4,159.86 crore, while DIIs bought Rs 13,551.76 crore. Yet India TV News reported that the Nifty, which closed at 22,600 in the session before, opened lower on 26 October amid high crude prices. The lesson: steady DII buying can slow a fall, but it does not guarantee a rally. Flows are one input, not a forecast. The checklist below turns this reading into a routine.
A 7-Point Daily Checklist for Traders
Use this short routine each evening after 6 PM. It takes about five minutes.
- Confirm the trade date on the NSE row before reading any number.
- Note FII and DII net values, and check the sign.
- Compare gross turnover with recent days. A small net figure on very high gross volume means heavy two-way trading.
- Look at the five-day and month-to-date totals, not just today.
- Open the participant-wise OI file and check FII net index futures position, along with the FII long short ratio.
- Scan FII options activity for heavy put buying, which often signals hedging.
- Write down the rupee level, crude price and US bond yield, since these drive foreign flows.
Tracking these points together gives a much clearer picture than a single headline number. Even so, a few habits can lead readers astray, and the next section lists them.
Common Mistakes When You Check FII DII Data
- Mixing the two NSE tables. The NSE-only figure and the combined figure differ. Stick to one when you compare days.
- Calling provisional data final. NSE numbers can differ from depository numbers. Label them clearly.
- Dropping the minus sign. A copied value of 1,462 instead of minus 1,462 flips the meaning completely.
- Using the download date as the trade date. If you check at 9 AM, the row shows the previous session.
- Reading cash data alone. FIIs may sell in cash and cover short futures the same day. Check F&O data too.
- Treating one day as a trend. One session of buying after weeks of selling is not a turnaround. Wait for several signals before calling a trend change.
Avoid these and your reading of institutional flows will be far more accurate. For daily numbers, charts and all our free tools, visit our FII and DII data home page. Below are answers to the questions readers ask most often.
Frequently Asked Questions
How to check FII DII data today?
Open the FII/FPI and DII trading activity report on the NSE website after 6 PM IST on a trading day. It shows gross buy, gross sell and net value for both groups in Rs crore. Data websites and broker apps republish the same figures shortly after.
What time is FII DII data released?
NSE releases provisional FII and DII cash market data around 6 PM IST on each trading day. Final FPI data from the depositories NSDL and CDSL is usually available by the next working day.
Why is NSE FII data different from NSDL data?
NSE data covers only secondary market trades on the exchange and is dated by trade day. Depository data covers settled investments, including IPOs and other primary market deals, and is dated when custodians report. So the two figures rarely match exactly.
Where can I see FII DII data for free?
The NSE and BSE websites publish daily figures free of charge, and NSDL and CDSL publish FPI data free as well. FIIAndDIIData.com also shows daily, monthly and F&O data in free, easy-to-read tables.
Is FII selling always bad for the market?
Not always. Heavy FII selling often weighs on the Nifty and the rupee, but strong DII buying can absorb it. FIIs may also sell for reasons unrelated to India, such as rising US bond yields. Read flows over several days and alongside other indicators.
The Bottom Line
Checking FII DII data takes only a few minutes once you know where to look. The NSE report gives the fast, provisional daily view around 6 PM. NSDL and CDSL give the final record of FPI money, including IPO investments. The two will not always match, and that is normal.
The bigger skill is reading the numbers in context: gross and net values together, several days at a time, and alongside F&O positions, the rupee and global yields. As a next step, bookmark our FII DII data dashboard and follow the 7-point checklist for one week. You can find more guides on the FIIAndDIIData.com blog.
Sources: NSE, FII/FPI and DII trading activity report; Business Standard (PTI), 25 October 2026; India TV News, 26 October 2026; Groww and NiftyTrader FII DII data pages, accessed 27 October 2026.
Disclaimer: This article is for educational purposes only and is not investment advice. Please consult a SEBI-registered advisor before making investment decisions.