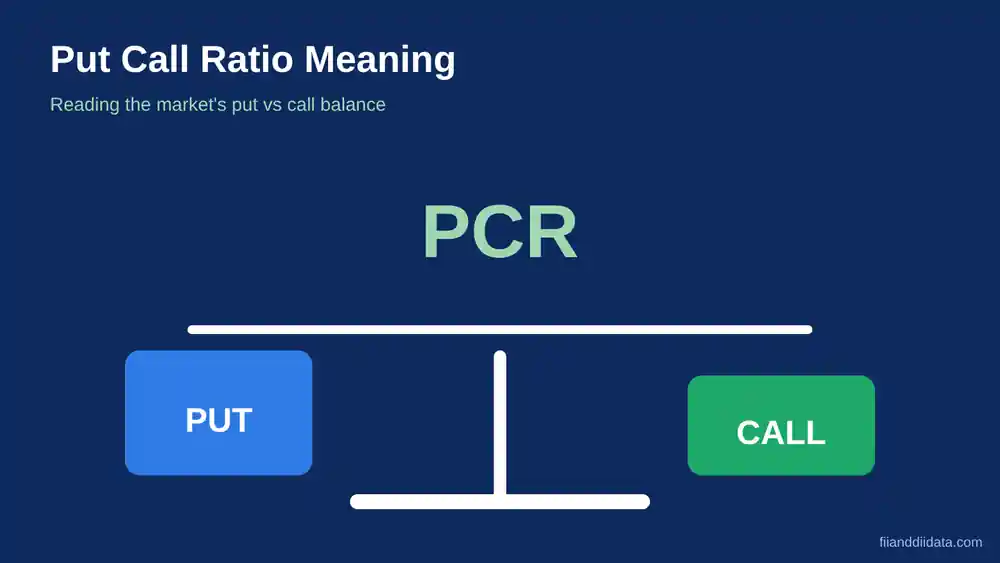
Put call ratio meaning in one line: it compares how many put options traders hold against call options, so it shows whether the options market is leaning defensive or optimistic. On the Sahi PCR page, the Nifty 50 open interest PCR stood at 1.64 at 3:35 PM IST on 6 November 2026. A reading like that sounds bearish, yet it often is not. This guide shows how to read it correctly.
Key Takeaways
- PCR is put open interest (or volume) divided by call open interest (or volume).
- A PCR above 1 means more puts than calls, but it can come from fear (put buying) or from support (put writing).
- Bands differ by platform, so compare today’s reading with the same index’s own recent range.
- Read PCR together with price trend, strike level open interest and India VIX.
- PCR gives no entry, stop loss or target, so never trade on it alone.
- Put Call Ratio Meaning in Plain Words
- How PCR Is Calculated, With a Worked Example
- Volume PCR, OI PCR and Change in OI PCR
- How to Read Put Call Ratio Levels
- Latest Nifty and Bank Nifty PCR Readings
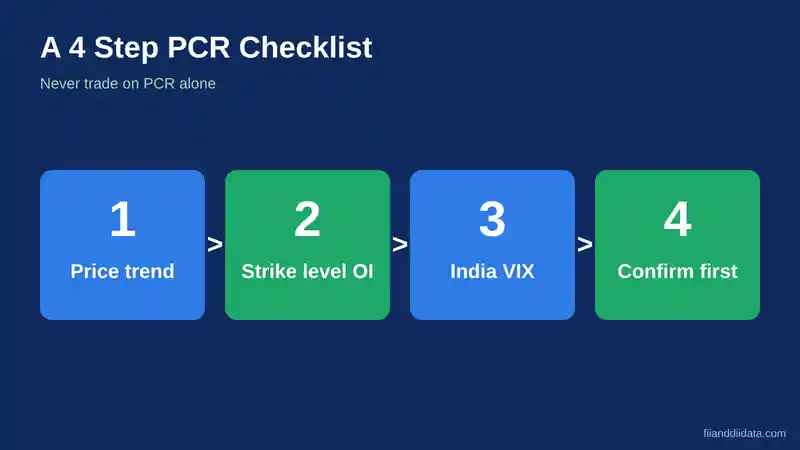
- A Four Step PCR Checklist for Nifty Traders
- Common PCR Mistakes
- PCR Compared With FII Positioning Data
- FAQ
- The Bottom Line
Put Call Ratio Meaning in Plain Words
A call option gives the buyer the right to buy at a fixed price. A put option gives the right to sell at a fixed price. Traders usually buy calls when they expect a rise, and buy puts when they expect a fall or want protection for a portfolio. The put call ratio (PCR) counts both sides and divides puts by calls.
Think of it as a mood meter for the options market. When put positions outnumber call positions, the ratio is above 1. When calls dominate, it is below 1. Many Nifty and Bank Nifty traders glance at it before they open a chart, because it hints at how the crowd is positioned.
Put call ratio meaning for Nifty and Bank Nifty
Both indices have deep, liquid option chains on NSE, so PCR is quoted mostly for them. Each index has its own normal range, so a Nifty reading of 1.2 does not carry the same weight as a Bank Nifty reading of 1.2. PCR also changes with the expiry you pick, because every expiry has its own open interest. Always note which expiry a number refers to. Next, the arithmetic.
How PCR Is Calculated, With a Worked Example
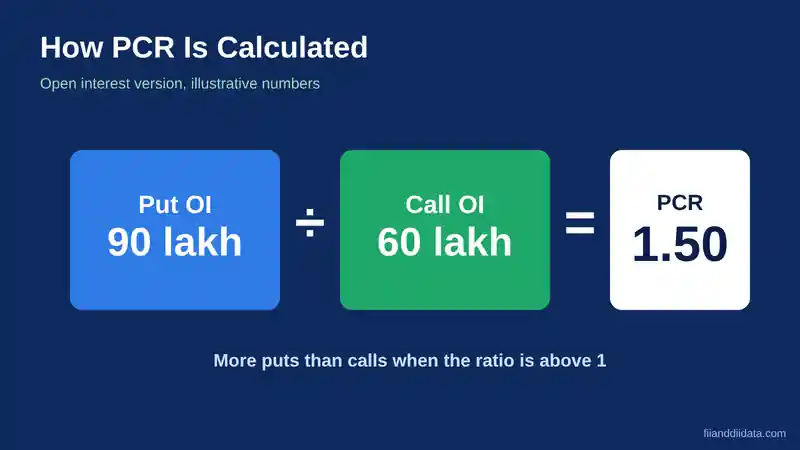
The formula is simple: PCR = total put figure ÷ total call figure. The “figure” can be volume, open interest or the change in open interest. Open interest is the number of contracts that are still open at the end of the session.
Take an illustrative example. Suppose the Nifty options for one expiry show 90 lakh contracts of put open interest and 60 lakh contracts of call open interest. PCR = 90 ÷ 60 = 1.50. Puts outnumber calls by half. Now take volume: if 48 lakh puts and 64 lakh calls traded in a session, volume PCR = 48 ÷ 64 = 0.75. Same market, two different readings, which is why the type of PCR matters.
Volume PCR, OI PCR and Change in OI PCR
Three versions are in common use. Each answers a slightly different question, and each has a weak spot.
| Type | Formula | What it shows | Main weakness |
|---|---|---|---|
| Volume PCR | Put volume ÷ call volume | Activity during one session | Noisy; mixes hedges and day trades |
| OI PCR | Put OI ÷ call OI | Positions carried forward | Cannot tell buying from writing |
| Change in OI PCR | Change in put OI ÷ change in call OI | Fresh positions added that day | Swings sharply when the base is small |
Here is how change in OI PCR can differ from the total. Say put open interest rises by 14 lakh contracts in a day while call open interest rises by 6 lakh. The change in OI PCR is 14 ÷ 6 = 2.33, even if the total OI PCR is still 1.50. It tells you that fresh positioning on that day was put heavy, which the total number hides. The Sahi page we checked on 9 November 2026 describes its figure as an open interest PCR, and most free dashboards do the same.
How to Read Put Call Ratio Levels
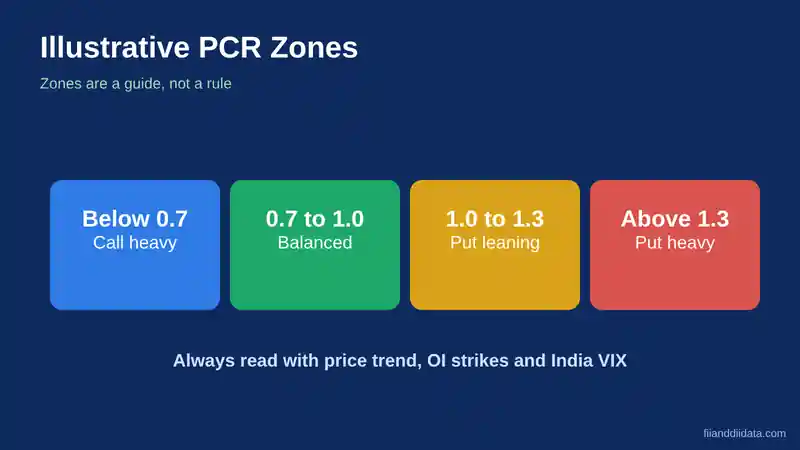
No exchange publishes official bullish or bearish bands for PCR. Each platform picks its own. As read on 9 November 2026, the 5paisa PCR guide uses cut-offs of 0.7, 1.0 and 1.3. The INDmoney PCR guide uses 0.6, 0.8, 1.2 and 1.5 and calls them illustrative. The table below uses the first set as a starting point only.
| OI PCR | Common reading | What to remember |
|---|---|---|
| Below 0.7 | Call heavy, optimistic | Can turn over-confident near a top |
| 0.7 to 1.0 | Balanced to mildly bullish | Needs chart confirmation |
| 1.0 to 1.3 | Put leaning, cautious | May be hedging or put writing |
| Above 1.3 | Put heavy, fearful or well supported | A possible bottom, never a guarantee |
Some traders use extremes as a contrarian signal. A very high PCR near a sell-off low may mean fear is peaking, and a very low PCR near a rally high may mean greed is peaking. The catch is timing. Extreme readings can last for days while the index keeps moving the same way, so wait for price to confirm.
A single total also hides where the positions sit. Look at this illustrative strike table, where the numbers are made up to show the idea and are not market data.
| Strike | Put OI (lakh) | Call OI (lakh) | Strike PCR |
|---|---|---|---|
| Strike 1 (lowest) | 30 | 12 | 2.50 |
| Strike 2 | 22 | 18 | 1.22 |
| Strike 3 | 15 | 40 | 0.38 |
| Strike 4 (highest) | 8 | 36 | 0.22 |
| Total | 75 | 106 | 0.71 |
The total PCR of 0.71 looks balanced. Yet puts crowd at the lowest strike, which traders read as a possible support area, and calls crowd at the higher strikes, which they read as a possible resistance area. The strike view tells a richer story than the headline number.
Latest Nifty and Bank Nifty PCR Readings
Here are the most recent figures we could verify on 9 November 2026. Both are open interest PCRs from the same page set, captured after the close on Friday, 6 November.
| Index | Expiry shown | OI PCR | Timestamp |
|---|---|---|---|
| Nifty 50 | 09 Nov 2026 | 1.64 | 3:35 PM IST, 6 Nov 2026 |
| Bank Nifty | 23 Nov 2026 | 1.25 | 3:35 PM IST, 6 Nov 2026 |
Using the illustrative table above, Nifty’s 1.64 sits in the put heavy zone, while Bank Nifty’s 1.25 sits in the put leaning zone. Two cautions apply. First, the two numbers refer to different expiries, so they are not a like for like comparison. Second, heavy put open interest can reflect put writers who expect the index to hold a level, which is a supportive signal rather than a fearful one. For the wider market view, read our Nifty outlook for November 2026. For the latest numbers, check the NSE option chain after the market closes.
A Four Step PCR Checklist for Nifty Traders
Use this routine each time you look at PCR. It takes about five minutes and keeps you from reacting to one number.
- Note the setup. Write down the index, the expiry and the PCR type (OI, volume or change in OI).
- Compare with its own range. Look at the last 20 sessions for the same index and expiry scope. Ask whether today is high or low for that index, not for the market in general.
- Check strikes and VIX. See where put and call open interest are stacked, and check whether India VIX is rising or falling.
- Confirm with price. Act only if the chart agrees, and fix your stop loss and position size before you enter.
Common PCR Mistakes
- Treating high PCR as bearish by default. Put writers add open interest too, and that raises the ratio while supporting the market.
- Mixing expiries. A weekly expiry and a monthly expiry can show very different ratios on the same day.
- Ignoring hedging. Large investors buy puts to protect long portfolios. That lifts PCR without any bearish view.
- Chasing intraday spikes. A jump in volume PCR in a single minute is usually noise.
- Trading on PCR alone. It offers no entry, stop loss or target.
Risk control matters more than any indicator. SEBI’s study for FY25, reported by Business Standard on 7 July 2025, found that over 91% of individual traders in equity derivatives lost money. Their aggregate net loss was ₹1,05,603 crore after transaction costs, up 41% from ₹74,812 crore in FY24. A neat indicator does not fix weak position sizing.
PCR Compared With FII Positioning Data
PCR blends every participant in the options market into one number. It cannot tell you whether FIIs, proprietary traders or retail clients created the skew. Other datasets answer that question, and they work best when read together.
| Tool | Covers | Tells you |
|---|---|---|
| PCR | All option contracts | Overall put versus call balance |
| Participant wise OI | Futures and options by participant | Who holds which positions |
| FII long short ratio | FII index futures | Whether FIIs lean long or short |
| FII options activity | FII index options | Call and put positioning of FIIs |
If you are new to the open interest data behind all of these, start with our explainer on how participant wise OI works. For cash market flows, check the FII and DII data dashboard and the FII DII data today page. NSE provisional numbers usually appear around 6 PM IST on trading days. More explainers sit on our blog.
FAQ
What is the put call ratio meaning in simple terms?
It is the number of put options divided by the number of call options, measured by open interest or volume. A reading above 1 means puts outnumber calls. A reading below 1 means calls outnumber puts. It shows how traders are positioned, not where the market will go.
Is a high put call ratio bullish or bearish?
It can be either. Put buyers raise the ratio when they fear a fall. Put writers raise it too when they expect the market to hold. The ratio alone cannot separate the two, so check price, strike level open interest and India VIX.
What is a good PCR level for Nifty?
There is no official good level. Platforms publish their own bands, such as 0.7, 1.0 and 1.3. A better method is to compare today’s reading with the Nifty’s own range over the last 20 sessions or so.
Which is better, OI PCR or volume PCR?
OI PCR shows positions that are still open and moves more slowly. Volume PCR shows activity in one session and is noisier. Many traders prefer OI PCR for context and add change in OI PCR for fresh positioning.
Can PCR predict market direction?
No. PCR describes positioning. It does not give timing, entries, stop losses or targets. Extreme readings can persist for days. Use it as one input along with price action and risk limits.
The Bottom Line
The put call ratio is a simple count of puts against calls, and its value lies in context. A Nifty reading of 1.64 on 6 November 2026 looks fearful on paper, but it could just as well reflect put writers defending a level. The number only becomes useful when you know the expiry, the PCR type, the index’s normal range and the strike map.
Your next step: pick one index and one expiry, note its PCR for the next ten sessions, and write down how price behaved afterwards. That small log will teach you more than any fixed zone.
Sources: Sahi Nifty 50 PCR page and Sahi Bank Nifty PCR page (read 9 November 2026); Business Standard, SEBI study on F&O losses in FY25 (7 July 2025); 5paisa and INDmoney PCR guides (read 9 November 2026). Disclaimer: This article is for educational purposes only and is not investment advice. Please consult a SEBI-registered advisor before making investment decisions.