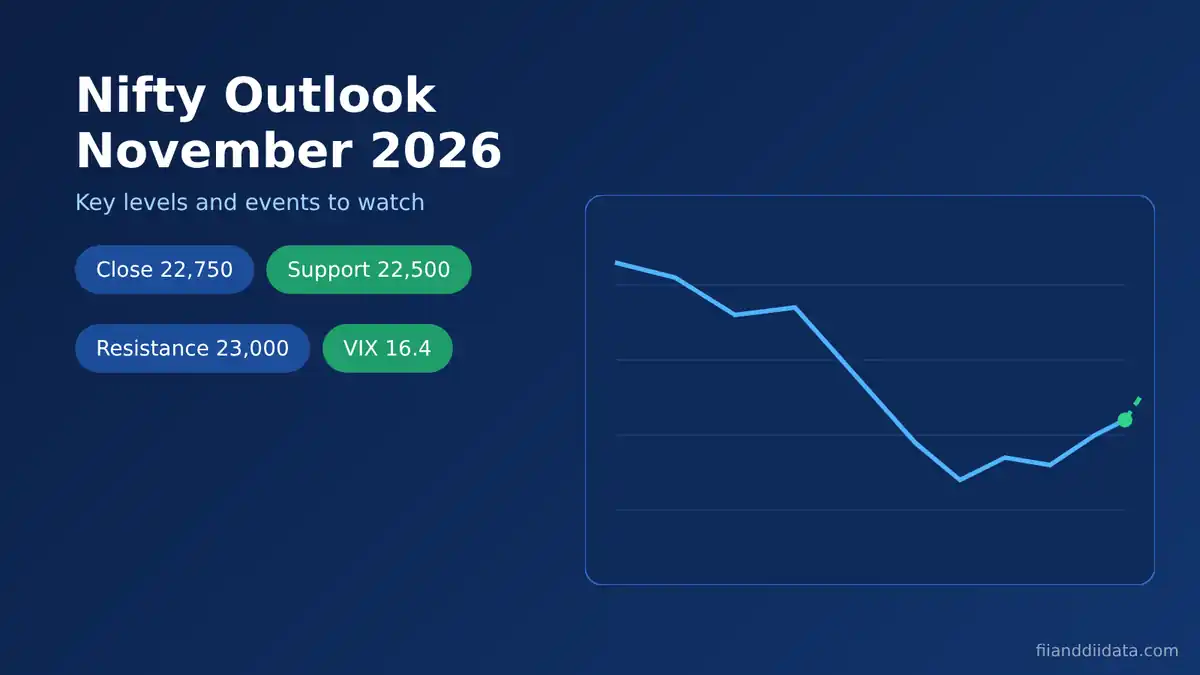
The Nifty outlook November 2026 starts from a fragile base: the index closed at 22,749.75 on 27 October 2026, roughly 13.6% below its January record, with crude near $116 and the US Fed decision due tonight. Most analysts see a 22,200 to 23,200 range unless a big trigger breaks it. Here is what decides which way it goes.
Key Takeaways
- Nifty ended the October series at 22,749.75 on 27 October 2026, flat for the day but far below its 2 January high near 26,340.
- Analysts quoted by Business Standard put support at 22,600 and resistance at 22,800, with 23,000 the next test.
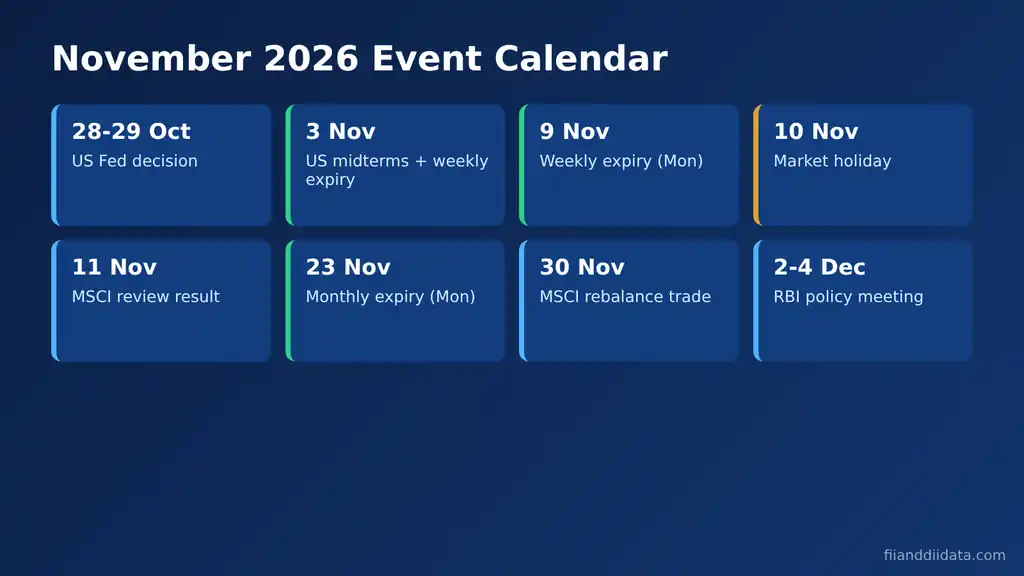
- Five events drive November: the Fed result, US midterms on 3 November, MSCI on 11 November, monthly expiry on 23 November and the RBI meeting from 2 December.
- India VIX near 16.35 implies a normal one-month swing of about 1,000 Nifty points either way.
- A close above 23,000 favours buyers; a break below 22,200 reopens the downtrend.
In this article:
- Where Nifty Stands Before November 2026
- Key Levels for the Nifty Outlook November 2026
- What Is Driving Nifty: Flows, Crude, Yields and the Rupee
- Five Events That Shape the Nifty Outlook in November 2026
- Three Scenarios for Nifty in November
- Worked Example: How Big a Move Is Normal?
- A November Checklist for Traders and Investors
- Common Mistakes When Reading a Monthly Outlook
- FAQ
- The Bottom Line
Where Nifty Stands Before November 2026
Nifty 50 closed the 27 October 2026 session at 22,749.75, down just 3.45 points, according to Business Standard’s market close report. That was the last day of the October derivatives series. The Sensex ended at 73,598.67.
Under the flat headline, the market was busy. Nifty Midcap 100 rose about 1% and Nifty Smallcap 100 gained about 2.7%, while private banks and IT stocks fell. Nifty Bank slipped 0.7%. In plain terms, money rotated out of the big index heavyweights and into smaller stocks.
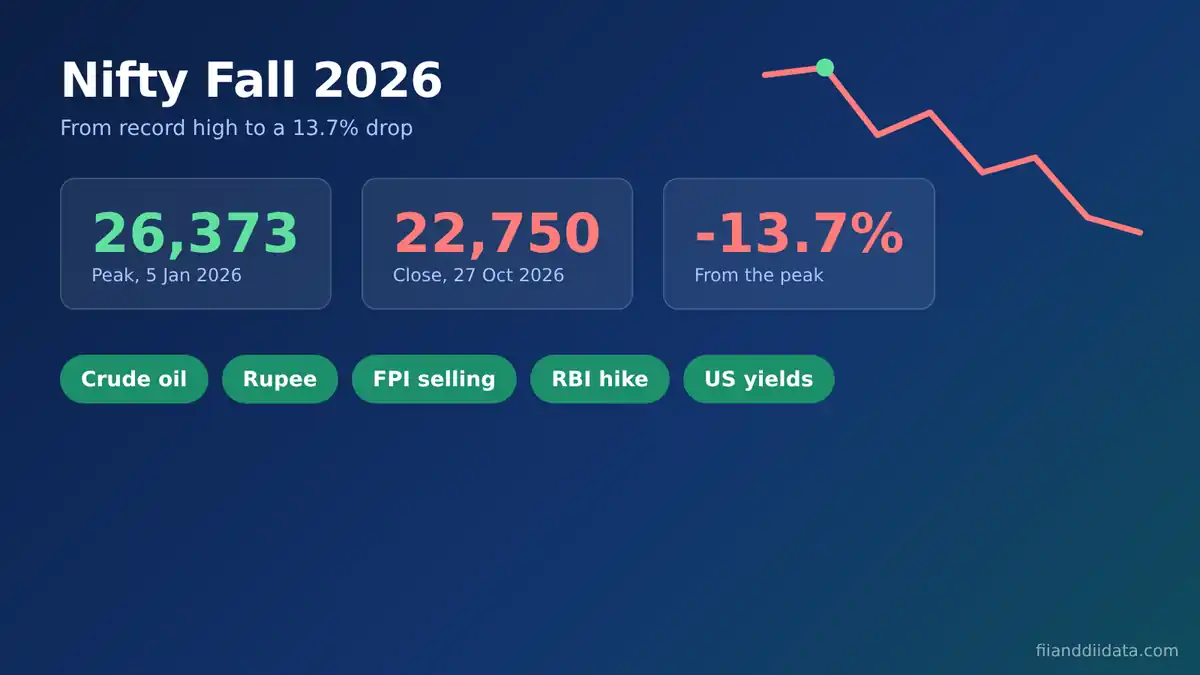
The bigger picture is the drawdown. Business Standard reported a Nifty record near 26,340 on 2 January 2026. From there to the 27 October close is a fall of about 13.6%, and Nifty would need to rise about 15.8% just to get back to that peak. The table below sums up the starting point.
| Indicator | Latest reading | Date |
|---|---|---|
| Nifty 50 close | 22,749.75 | 27 Oct 2026 |
| Nifty record high (intraday) | About 26,340 | 2 Jan 2026 |
| Distance from record | -13.6% | 27 Oct 2026 |
| India VIX | 16.35 (3:31 pm) | 27 Oct 2026 |
| Brent crude | About $114.80 to $116.24 | 27 Oct 2026 |
| Rupee | About ₹95.22 per dollar (10:25 am) | 27 Oct 2026 |
| FII net (NSE provisional) | +₹4,240 crore | 27 Oct 2026 |
| RBI repo rate | 5.50% | Since 7 Oct 2026 |
With the starting line clear, the next question is where buyers and sellers are likely to fight.
Key Levels for the Nifty Outlook November 2026
Support is a price zone where buying has stepped in before. Resistance is a zone where selling has capped rallies. Neither is a guarantee, but both help you plan entries, exits and stop-losses.
Vatsal Bhuva of LKP Securities told Business Standard on 27 October that Nifty closed above its 20-day moving average and its 200-week moving average after briefly slipping below them. He placed immediate support at 22,600 and resistance at 22,800, and said a sustained move above 22,800 could open a test of 23,000. 5paisa’s levels after the 26 October session put support at 22,518 and 22,373 and resistance at 22,988 and 23,133.
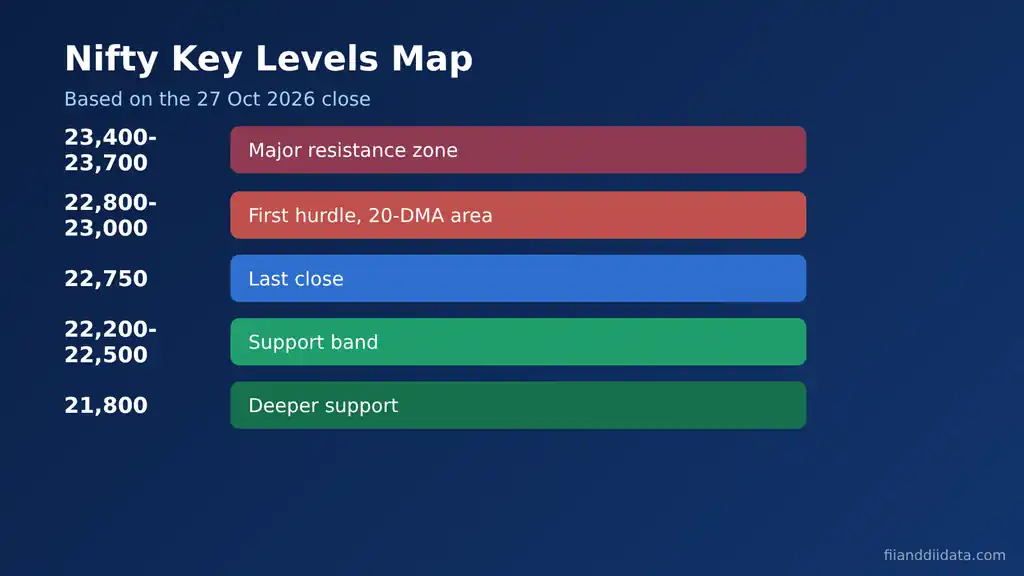
Nifty outlook November 2026: levels in one table
| Zone | Level | Distance from 22,750 | What it means |
|---|---|---|---|
| Major resistance | 23,400 to 23,700 | +2.9% to +4.2% | Needs fresh buying, likely FII led |
| First hurdle | 22,800 to 23,000 | +0.2% to +1.1% | Close above 23,000 improves the trend |
| Support band | 22,200 to 22,600 | -0.7% to -2.4% | Lower end of analysts’ November range |
| Deeper support | About 21,800 | -4.2% | A break would extend the 2026 fall |
Levels tell you where the fight is. The drivers below tell you who is likely to win it.
What Is Driving Nifty: Flows, Crude, Yields and the Rupee
Four forces explain most of the 2026 fall, and they will decide November too.
Foreign flows have started to turn, but only just
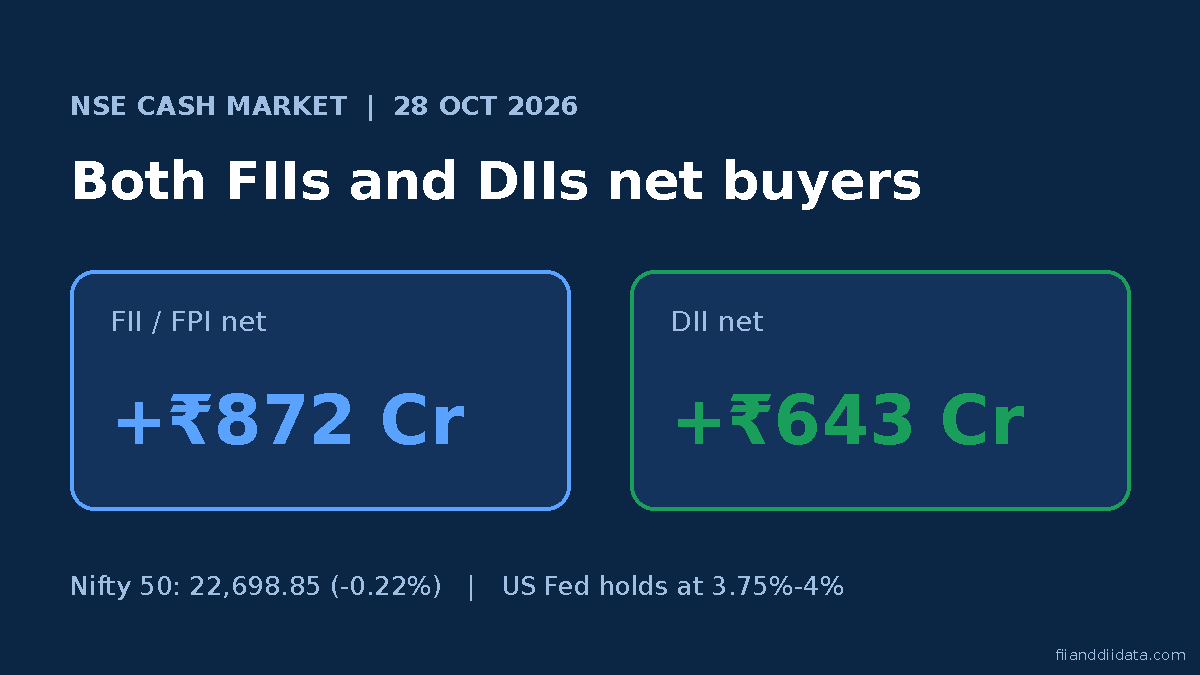
Foreign investors bought a net ₹4,240 crore in the cash market on 27 October, while DIIs sold ₹1,250 crore, as per NSE provisional data covered in our FII DII data for 27 October 2026. One good day does not reverse a year in which NSDL data showed FPIs pulling out more than ₹3 lakh crore. If FIIs keep buying for several sessions, the 23,000 test becomes realistic. Track it on our daily FII DII cash market summary. To see whether FIIs are also adding long positions in index futures, check our FII DII F&O data page.
Crude oil is the biggest risk
Brent traded between about $114.80 and $116.24 on 27 October as West Asia tensions stayed high, HDFC Sky reported. India imports most of its oil, so expensive crude widens the trade deficit, weakens the rupee and squeezes company margins. Geojit’s Vinod Nair flagged crude, the rupee and the West Asia crisis as the main risks.
US yields and a weak rupee
The rupee was near ₹95.22 per dollar on 27 October. A falling rupee cuts the dollar return for a foreign fund even if Nifty stays flat, which is why rupee stability often comes before sustained FII buying. High US Treasury yields add to the pull, since they offer foreign investors a safer return at home.
Each of these forces has a date attached in November. That calendar is next.
Five Events That Shape the Nifty Outlook in November 2026
1. US Fed decision (28 October, US time)
The Fed announces its policy on 28 October US time, which lands early on 29 October in India. Markets broadly expect rates to stay unchanged. The tone of the statement matters more than the decision itself: a hint of cuts would help the rupee and FII flows, while a firm stance would keep pressure on.
2. US midterm elections (3 November)
The US votes on 3 November 2026. IG’s midterm guide notes that markets react more to what results mean for growth, tax and rates than to the result itself, and that close or disputed races can raise volatility. For India, watch the dollar and Treasury yields the next morning.
3. MSCI index review (11 November and 30 November)
MSCI announces its November review on 11 November after market hours, with changes effective 1 December. JM Financial, via Business Standard, estimates net passive inflows of about $1.4 billion, with LIC and Meesho as likely additions. Passive funds trade at the close on 30 November. Read the full breakdown in our MSCI rebalancing November 2026 guide.
4. Holidays and expiry dates
NSE’s 2026 holiday list shows markets shut on Tuesday 10 November (Diwali Balipratipada) and Tuesday 24 November (Guru Nanak Jayanti). Since Nifty contracts expire on Tuesdays, weekly expiries fall on 3 and 17 November, the 10 November expiry moves to Monday 9 November, and the monthly expiry moves to Monday 23 November. Confirm each date on NSE circulars, and read our SEBI F&O rules 2026 explainer for the expiry changes due from 7 December.
5. RBI policy expectations (meeting on 2 to 4 December)
The RBI’s 7 October 2026 policy statement raised the repo rate by 25 basis points to 5.50% and set the next meeting for 2 to 4 December. The decision falls in December, but rate-sensitive stocks such as banks and autos will price in expectations through late November.
Put the levels and the events together, and three paths emerge for the month.
Three Scenarios for Nifty in November
These are not forecasts. They are if-then maps that tell you what to expect when a trigger level breaks.
| Scenario | Trigger | Likely drivers | Zone to watch |
|---|---|---|---|
| Bull | Daily close above 23,000 | Crude cools, rupee steadies, FIIs keep buying | 23,400 to 23,700 |
| Base | Trade inside 22,200 to 23,200 | Mixed flows, event-driven swings | Buy near support, book near resistance |
| Bear | Daily close below 22,200 | Oil spike, firm Fed, FII selling returns | Toward 21,800 |
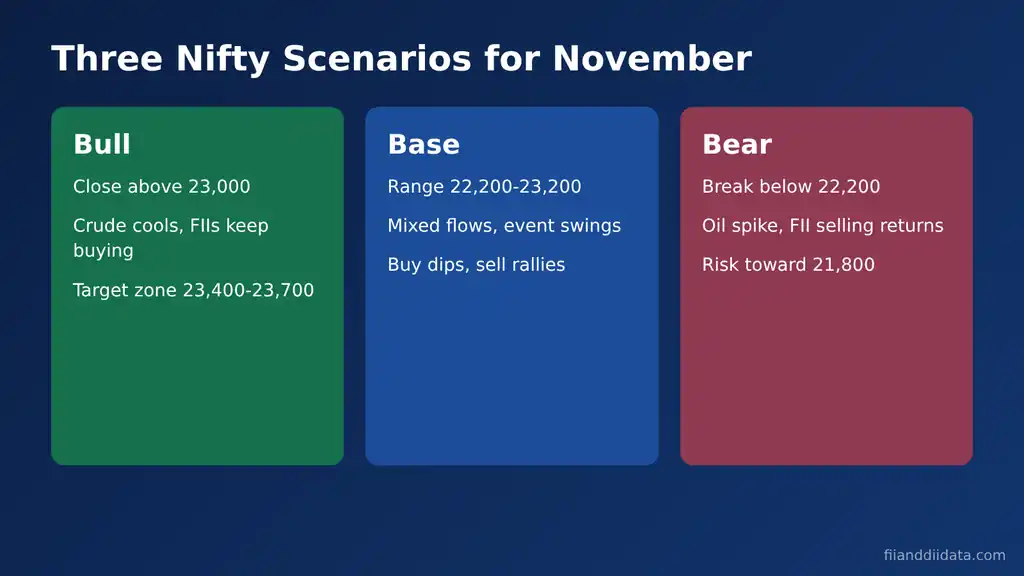
The base case is a range because most drivers are pulling in opposite directions. FII buying and strong smallcaps point up, while crude and the rupee point down. But how wide is a normal range? The VIX gives a useful answer.
Worked Example: How Big a Move Is Normal?
India VIX measures the yearly volatility that options prices expect. You can turn it into a rough expected move with a simple formula: index level × (VIX ÷ 100) × √(days ÷ 365).
- Nifty = 22,750 and VIX = 16.35 (27 October 2026).
- For 30 days: 22,750 × 0.1635 × √(30 ÷ 365) ≈ 1,066 points.
- That gives a one-standard-deviation band of about 21,683 to 23,816 for the month.
- For one week: 22,750 × 0.1635 × √(7 ÷ 365) ≈ 515 points.
Roughly two times out of three, the index should stay inside that monthly band if volatility holds steady. So a 500-point weekly swing around an event like the US midterms is normal, not a crash signal. Note how the analysts’ 21,800 and 23,700 levels sit close to the edges of this band.
Investors can use the same idea. Say you plan to put ₹3 lakh into a Nifty index fund in three equal parts at 22,750, 22,500 and 22,200. Your average entry works out to about 22,481, and a later move to 23,000 would leave you about 2.3% ahead, compared with 1.1% for a single purchase at 22,750. Staggering cuts the cost of being early in a choppy month.
Numbers help, but discipline matters more. The checklist below turns this outlook into daily habits.
A November Checklist for Traders and Investors
- Check the FII and DII net figures each evening after about 6 PM on our FII and DII data dashboard. Three straight days of FII buying is a stronger signal than one big day.
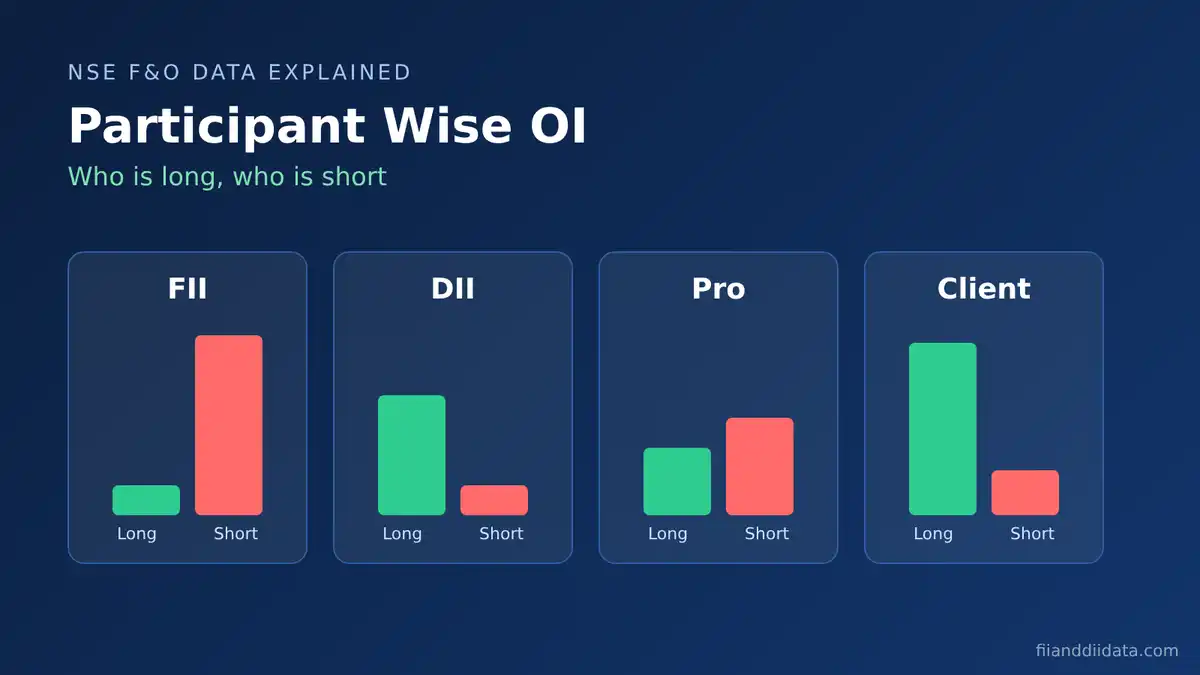
- Watch the FII long short ratio in index futures. A rising long share supports the bull case.
- Note Brent and the rupee before the open. Brent above $116 and a weaker rupee lean bearish.
- Mark 3, 9, 17 and 23 November for expiry-day swings, and avoid fresh positions on borrowed margin just before holidays.
- Read our Nifty outlook for the next session in the pre-market report for overnight cues.
- Set a stop-loss based on a closing level, such as 22,200, rather than a fixed rupee amount.
- Keep position sizes small around 3 November and 11 November, when overnight gaps are more likely.
Even with a checklist, a few errors trip up most readers of monthly outlooks.
Common Mistakes When Reading a Monthly Outlook
- Treating levels as targets. Support and resistance are zones where behaviour may change, not promises.
- Reacting to one FII day. The ₹4,240 crore buying on 27 October is encouraging, but one day after months of selling is not a trend.
- Ignoring the calendar. Two holidays and shifted expiries change when option premiums decay and when positions roll.
- Mixing intraday and closing breaks. Use daily closes to confirm a breakout above 23,000 or a breakdown below 22,200.
- Forgetting the rupee. For foreign investors, a 2% fall in the rupee can wipe out a 2% Nifty gain.
FAQ
What is the Nifty outlook for November 2026?
Analysts expect a range of roughly 22,200 to 23,200 as of 27 October 2026, when Nifty closed at 22,749.75. A daily close above 23,000 would improve the trend, while a close below 22,200 would point to further weakness toward 21,800.
What are the key support levels for Nifty in November 2026?
Immediate support is near 22,600 according to LKP Securities, with a wider support band at 22,200 to 22,500. The 21,800 zone is the deeper level to watch.
Is the stock market open on Diwali 2026?
Diwali Laxmi Pujan falls on Sunday 8 November 2026, so regular trading is not affected. NSE is closed on Tuesday 10 November for Diwali Balipratipada and on Tuesday 24 November for Guru Nanak Jayanti.
When is the Nifty monthly expiry in November 2026?
Nifty contracts expire on Tuesdays, but 24 November 2026 is a market holiday, so the monthly expiry moves to Monday 23 November. Traders should confirm the date in NSE circulars.
Will FIIs buy Indian stocks in November 2026?
FIIs bought a net Rs 4,240 crore on 27 October 2026, their biggest day of the month, but sustained buying usually needs a stable rupee, softer crude and lower US yields. MSCI flows estimated at about $1.4 billion could add support near 30 November.
The Bottom Line
Nifty enters November 2026 about 13.6% below its January record, with early signs of FII buying but heavy pressure from crude near $116 and a rupee around ₹95 per dollar. The most likely path is a range between 22,200 and 23,200, with sharp moves around the Fed result, the 3 November US vote, the 11 November MSCI review and the 23 November expiry.
Let closing levels guide you rather than headlines: above 23,000, the recovery case strengthens; below 22,200, caution wins. As a next step, bookmark our market analysis blog and check the FII and DII numbers every evening, since flows will likely decide which scenario plays out.
Sources: Business Standard, market close, 27 Oct 2026; Business Standard, Nifty record high report, 2 Jan 2026; RBI Monetary Policy Statement, 7 Oct 2026; Business Standard on JM Financial MSCI preview, 23 Oct 2026; IG, US midterms 2026 guide; HDFC Sky, India VIX and crude update, 27 Oct 2026; 5paisa, Nifty outlook, 26 Oct 2026; NSE trading holiday list 2026; NSE provisional FII/DII data, 27 Oct 2026; NSDL FPI data, 2026.
Disclaimer: This article is for educational purposes only and is not investment advice. Please consult a SEBI-registered advisor before making investment decisions.