FII long unwinding is what happens when foreign institutional investors close the bullish index futures positions they were holding. Price slips, open interest shrinks, and the FII long side of the participant-wise data gets smaller. It is one of the cleanest ways to read whether foreign money is stepping away from Indian equities or simply taking profits, and it is easy to misread if you only look at one number.
This guide explains what long unwinding means, how it appears in the NSE data, how it differs from short buildup and short covering, and a simple checklist you can apply to any trading day. If you are new to the topic, start with what FII and DII mean and then come back.
Key Takeaways
- Long unwinding means existing long positions are being closed, so price falls and open interest falls together.
- It is different from short buildup, where new short positions are added and open interest rises while price falls.
- The FII long short ratio dropping because longs shrank is the clearest confirmation in the participant-wise data.
- One day of unwinding is a clue, not a verdict. Expiry rollovers and hedging can mimic it.
- Always confirm with the cash market flow and the next day participant-wise open interest before drawing a conclusion.
What Is FII Long Unwinding?
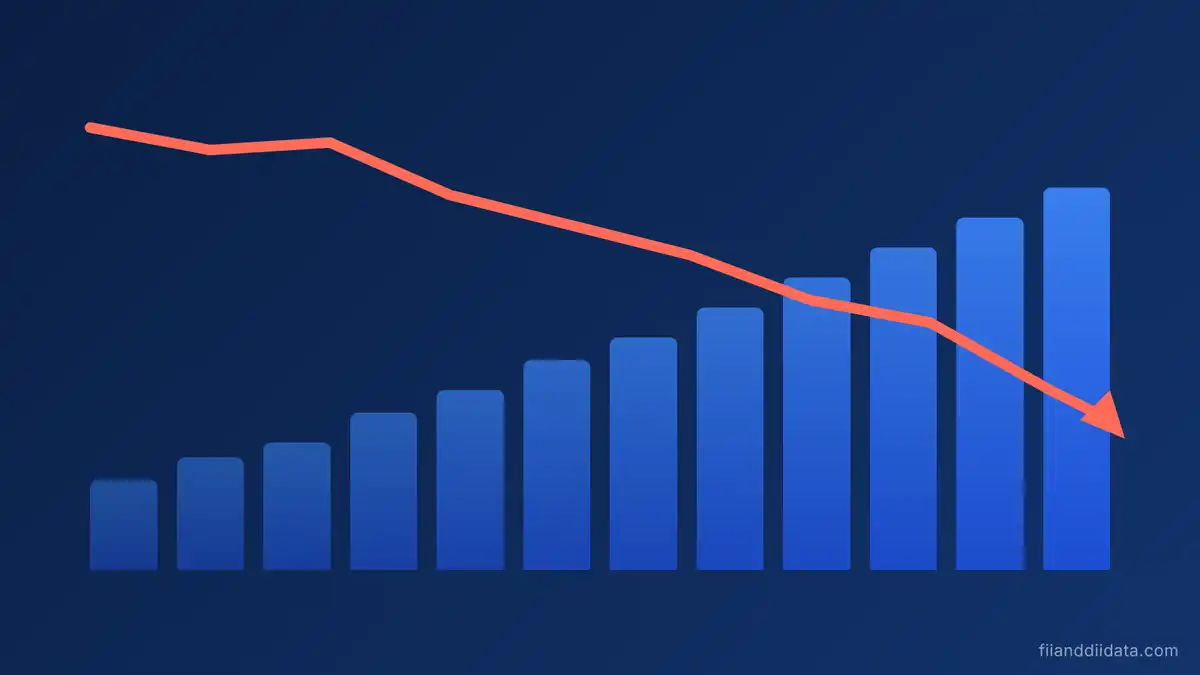
A long position in index futures is a bet that the index will rise. When an FII closes that bet by selling the same contracts, the long position disappears from the market. That is long unwinding. No new short is created by this action alone, which is why open interest goes down rather than up.
Think of it as two different stories that both push the index lower. In one, traders are adding fresh bearish bets. In the other, traders are simply leaving bullish bets. The second story, long unwinding, usually carries less conviction about further falls, because nobody is building a new downside view. The market is losing buyers rather than gaining aggressive sellers.
For FIIs this matters because index futures are their main derivatives tool in India. A change in their index futures longs often reflects portfolio level decisions, as covered in our guide to FII futures data.
How Long Unwinding Shows Up in the Data
The signal comes from reading price and open interest together. Price alone tells you the direction. Open interest tells you whether positions are being opened or closed. Put them side by side and the four classic combinations appear.
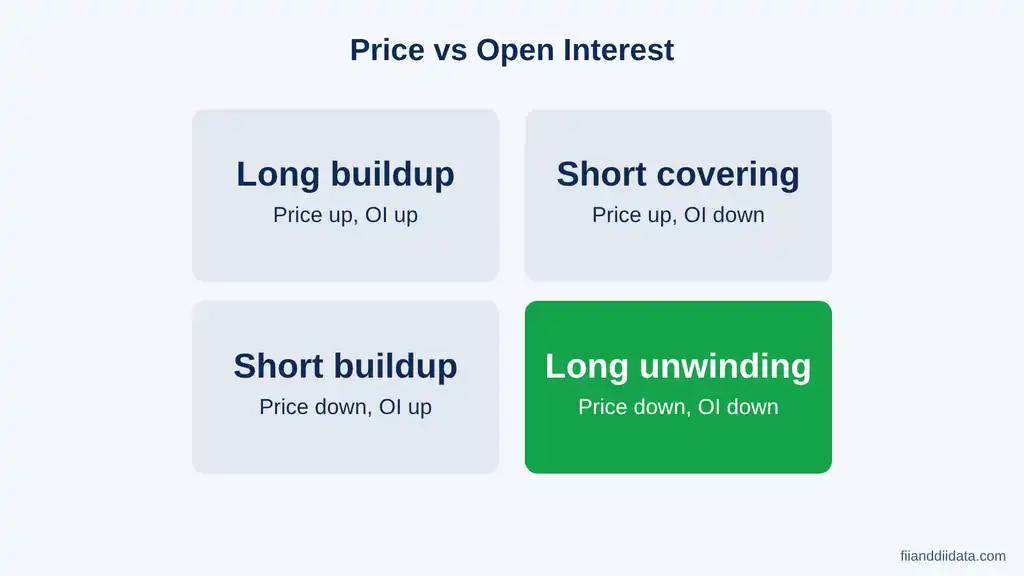
| Price | Open interest | What it usually means |
|---|---|---|
| Up | Up | Long buildup: fresh bullish positions |
| Up | Down | Short covering: shorts are being closed |
| Down | Up | Short buildup: fresh bearish positions |
| Down | Down | Long unwinding: longs are being closed |
Long unwinding sits in the last row. The mirror image is FII short covering, where price rises while open interest falls because shorts are being closed. Both involve falling open interest, but they point in opposite directions for sentiment.
Long Unwinding vs Short Buildup
Traders often confuse these two because the index falls in both cases. The difference is in what the positions are doing.
| Feature | Long unwinding | Short buildup |
|---|---|---|
| Price | Falls | Falls |
| Open interest | Falls | Rises |
| FII long contracts | Decrease | Little change |
| FII short contracts | Little change | Increase |
| Conviction on further fall | Lower | Higher |
| Risk of sharp rebound | Moderate | Depends on short covering later |
If the index is falling and open interest is rising, new money is entering on the sell side, and that is a stronger bearish message than unwinding. If open interest is shrinking, the move is being driven by exits, which tends to fade once the sellers run out.
How to Spot FII Long Unwinding Step by Step
You do not need a terminal to do this. The NSE participant-wise open interest file and a basic price chart are enough. Here is the routine.
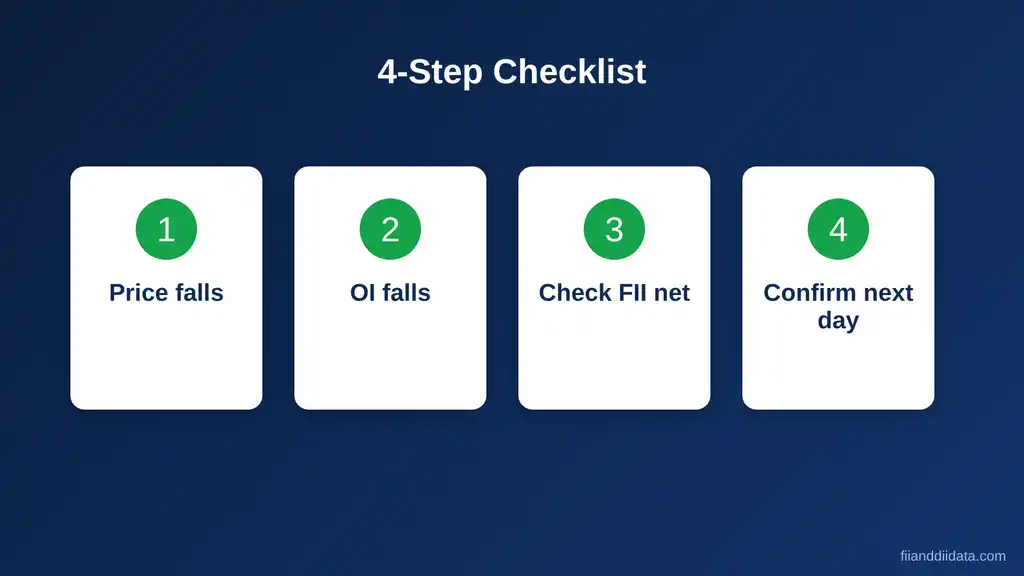
- Check the price move. Note whether Nifty futures closed lower than the previous session.
- Check total open interest. If it fell on the same day, positions were closed rather than opened.
- Open the FII row in the participant-wise file. Compare index futures long contracts with the previous day. A drop in longs while shorts stay flat is textbook unwinding. Our explainer on participant-wise open interest shows how to read each column.
- Confirm the next day. One session can be noise. If longs keep shrinking, the pattern is real.
A Worked Example With Illustrative Numbers
The figures below are hypothetical and chosen only to show the arithmetic. They are not actual exchange data.
| FII index futures | Day 1 | Day 2 | Change |
|---|---|---|---|
| Long contracts | 1,40,000 | 1,15,000 | -25,000 |
| Short contracts | 1,10,000 | 1,12,000 | +2,000 |
| Net position | +30,000 | +3,000 | -27,000 |
| Long short ratio | 56.0% | 50.7% | -5.3 points |
Longs fell by about 18 percent while shorts barely moved. The long short ratio slid toward 50 percent, which means the FII book is moving from clearly bullish to roughly balanced. That is unwinding, not a fresh bearish wave. For a deeper look at this metric, read about the FII long short ratio.
Why Do FIIs Unwind Long Positions?
There is rarely a single reason. Common drivers include:
- Profit booking after a strong rally, especially near resistance levels.
- Global risk off moves, such as a stronger dollar or rising US bond yields, which push foreign funds to cut emerging market exposure.
- Rupee weakness, which lowers dollar returns on Indian holdings.
- Event risk before elections, policy announcements or major earnings, when funds prefer smaller positions.
- Rebalancing between futures and options or between cash and derivatives.
Because FIIs also use futures as hedges, the direction of the cash market flow matters too. Compare derivatives with cash flow using our note on cash data versus participant-wise open interest.
When Long Unwinding Is Not Bearish
A shrinking long position does not always mean foreign investors are negative on India. Several situations produce the same numbers with a very different meaning.

- Expiry rollover. Near expiry, open interest in the expiring contract naturally drops as positions move to the next series. Check the next month contract before calling it unwinding.
- Hedge adjustment. FIIs holding large cash portfolios use index futures shorts as hedges. Changes in either side can reflect hedge sizing and not a market view.
- Switch to options. Some funds replace futures longs with call options. The futures long falls, yet the bullish view is intact. See index futures versus index options for FIIs.
- Profit booking after a sharp rally. The market can resume its climb once the selling ends.
What Long Unwinding Means for Nifty and Bank Nifty
When FII longs shrink and price slides, the index often loses momentum rather than crashing. Support levels get tested, and a bounce tends to appear once the selling pressure fades. If the long short ratio keeps dropping across several sessions and shorts also begin to rise, the picture shifts from unwinding to genuine bearish positioning.
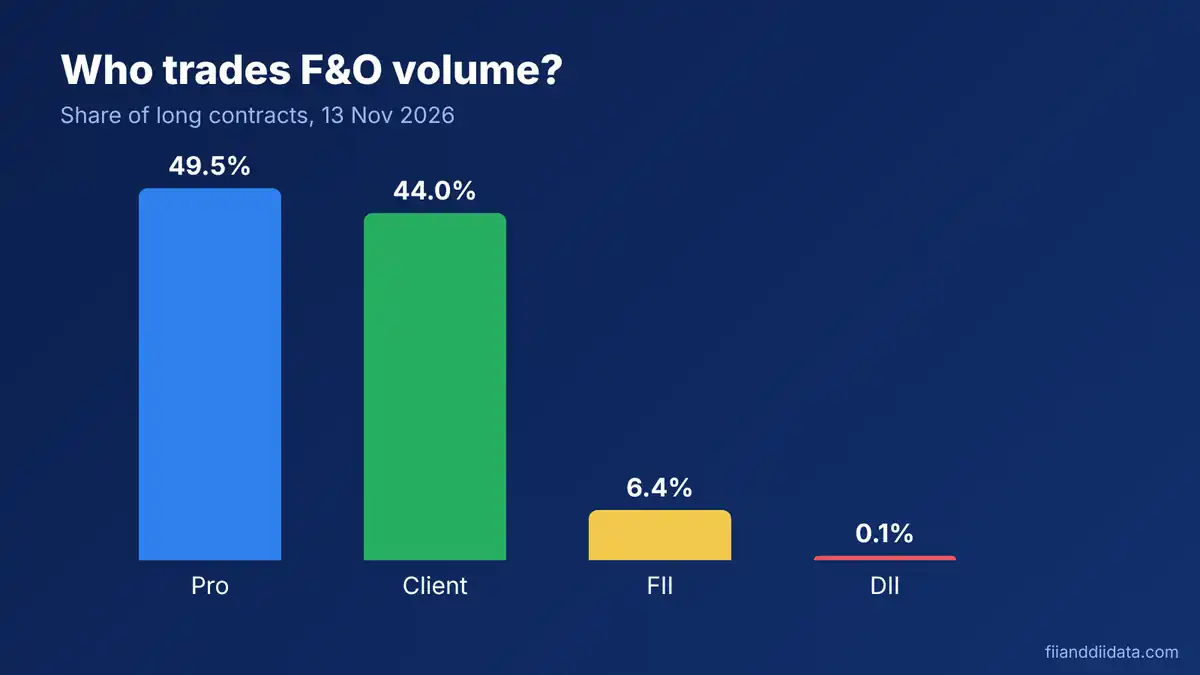
Traders who follow derivatives data generally combine three inputs: the FII long short ratio, the put call ratio, and the position of other participants such as Pro and Client. Our guides on the put call ratio and Pro versus Client open interest show how to add those layers. For the bigger picture of how flows move the index, see how FII data impacts Nifty.
Where to Check the Data
NSE publishes provisional participant-wise open interest after market hours, usually in the evening. The cash market FII and DII numbers come from exchange and depository sources and can be revised the next working day. You can find the daily summaries on our FII and DII data home page, and the full participant breakdown on the NSE participant-wise open interest page.
Pros and Cons of Using Long Unwinding as a Signal
Pros
- Uses free, official data.
- Separates exits from fresh bearish bets.
- Helps avoid panic when the fall is only profit booking.
- Works well together with price levels.
Cons
- Expiry effects can distort a single day.
- Hedging makes FII positions harder to read as pure views.
- Data is provisional and may be revised.
- It reflects only index futures, not the full FII exposure.
How to Combine Long Unwinding With Other Signals
A single indicator rarely gives a dependable view, so it helps to build a small checklist around long unwinding. Start with the FII net position in index futures. If the net figure is still positive after the unwinding, foreign investors remain net buyers overall and the exit is mostly trimming. If the net figure has turned negative, the shift is more serious and deserves closer attention over the next few sessions.
Next, look at the cash market. When FIIs unwind index futures longs and also sell shares in the cash segment on the same day, the two signals reinforce each other and point to broad risk reduction. When they unwind futures longs but keep buying in the cash segment, the move is more likely a tactical adjustment, such as locking in gains on a derivative position while staying invested in stocks.
Finally, watch what domestic institutions and other participants do at the same time. If DIIs are absorbing the supply and Client positions are turning bullish, the market can hold its ground even while FII longs shrink. If every participant group is reducing exposure together, volatility usually rises. Reading these groups side by side is the reason the participant-wise file is more useful than a single headline number.
It also helps to keep a short log. Note the date, the change in FII longs and shorts, the move in the index, and what happened over the following two sessions. After a month of notes you will see which unwinding days led to real declines and which ones faded quickly. That personal record is often more valuable than any rule of thumb, because it reflects how the market has actually behaved around the data you are tracking.
Common Mistakes to Avoid
- Calling every red day long unwinding without checking open interest.
- Ignoring expiry week, when open interest falls for mechanical reasons.
- Reading FII shorts as pure bearish views when they may be hedges.
- Trading on one session of data instead of a multi-day trend.
- Forgetting that the cash market flow can tell a different story from the derivatives data.
For a practical framework on turning this data into decisions, see how to use FII DII data for trading. This article is educational and not investment advice.
Frequently Asked Questions
What is FII long unwinding?
FII long unwinding is when foreign institutional investors close their existing bullish index futures positions. Price usually falls and open interest falls at the same time because positions are being exited, not newly opened.
Is FII long unwinding bullish or bearish?
It is mildly bearish in the short term because buyers are leaving, but it is weaker than short buildup. Unwinding shows fading support, while short buildup shows new aggressive selling.
How is long unwinding different from short covering?
In long unwinding, price falls and open interest falls as longs are closed. In short covering, price rises and open interest falls as shorts are closed. Both reduce open interest, but they point in opposite directions.
Where can I see FII long unwinding in the data?
Open the NSE participant-wise open interest file, find the FII row, and compare index futures long contracts with the previous day. A fall in longs with price and total open interest also falling signals unwinding.
Can expiry cause false long unwinding signals?
Yes. Around expiry, open interest in the expiring contract drops as positions roll to the next series. Check the next month contract and wait for the following session before treating it as a real trend.
How many days of unwinding confirm a trend?
There is no fixed rule, but two to three consecutive sessions of falling FII longs along with a weaker long short ratio is a more reliable sign than a single day.
Summary
FII long unwinding is the quiet exit of foreign bullish bets in index futures. It shows up as lower price, lower open interest and a smaller FII long book. Treat it as a warning that support is thinning, not as proof of a crash. Confirm with the long short ratio, check for expiry effects, and wait for a second day of data before acting.