FII short build up happens when foreign institutional investors add fresh short positions in index futures while the market price falls and open interest rises. It is one of the clearest signals in NSE participant-wise data, but it is also easy to misread. This guide explains the signal, tests it against FII data for 9 to 13 November 2026, and gives you a checklist you can reuse every evening.
Key Takeaways
- A short build up is price down plus open interest up, which means new sellers are entering, not old buyers leaving.
- FII index futures shorts fell from 143,123 contracts on 9 Nov to 118,466 on 13 Nov 2026, so the recent trend is the opposite of a build up.
- FII net short in index futures narrowed from 90,741 to 55,920 contracts, a fall of 38.4% in four sessions.
- Shorts can be hedges against a large cash portfolio, so confirm with price, total open interest and the long short ratio.
- NSE participant data is provisional when published around 6 PM IST, and it can be revised.
In this guide
- What is FII short build up?
- How to read the price and OI grid
- FII short build up vs hedging
- Latest data: 9 to 13 Nov 2026
- Worked example with numbers
- A simple confirmation checklist
- Common mistakes, pros and cons
- Related concepts
- Frequently asked questions
- The bottom line
What Is FII Short Build Up?
Short build up is a derivatives term. It describes a session where the price of a futures contract falls and its open interest rises. Open interest counts the contracts that are still open. When it rises, new positions are being created. When the price falls at the same time, most of those new positions are sellers opening shorts. Kotak Neo’s guide to short buildup describes the same pattern in plain terms.
When the seller is a foreign institution, traders call it an FII short build up. NSE reports positions by four participant types: FII, DII, Client and Pro. You can read the daily numbers on the participant-wise open interest page, and the cash market side is covered in our daily FII DII data today summary.
One point matters before anything else. NSE publishes totals for each participant, not individual trades. So the build up is an inference. You compare the direction of the index with the day-on-day change in FII long and short contracts. The NSE file is provisional data released after market hours, and it is the base for every number in this article.
How to Read the Price and OI Grid
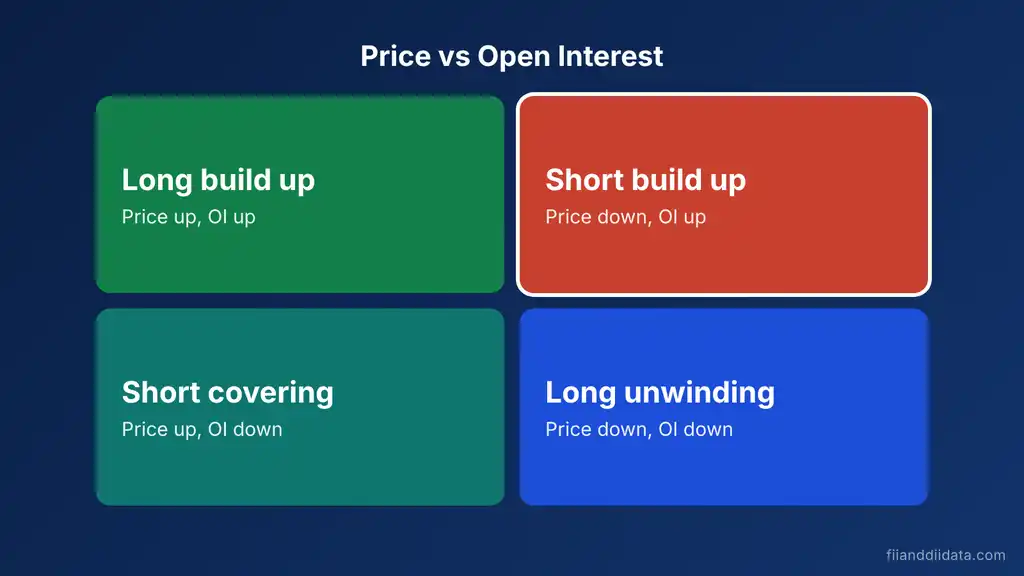
Every futures session falls into one of four boxes. You only need two inputs: did the price rise or fall, and did open interest rise or fall.
- Price down, OI up: short build up. New sellers are active.
- Price up, OI down: short covering. Existing sellers are buying back to close.
- Price down, OI down: long unwinding. Existing buyers are exiting.
- Price up, OI up: long build up. New buyers are active.
The reason a short build up carries more weight than a simple price fall is commitment. A price drop with falling open interest only shows that buyers are leaving. A price drop with rising open interest shows that traders are willing to hold new bearish positions overnight, and that is a stronger statement.
FII Short Build Up vs Hedging
FIIs hold very large equity portfolios in the cash market. A fund that does not want to sell its shares can still protect itself by shorting index futures. That short is a hedge, not a bearish bet. This is why a rising FII short count does not always mean the market will fall.
The 13 Nov 2026 data shows how mixed the picture can be. FIIs were net short in index futures, with 62,546 long against 118,466 short contracts. In stock futures they were net long, with 3,586,466 long against 2,585,271 short, a net long of 1,001,195 contracts. In index options they held 1,137,053 long puts against 749,988 short puts, and 755,197 long calls against 972,780 short calls. That mix leans defensive in index products while staying supportive in stocks. It is consistent with hedged positioning, although NSE data alone cannot prove intent. Our note on FII stock futures position explains how to combine these views.
Latest Data: FII Index Futures, 9 to 13 Nov 2026
The table below uses NSE provisional participant-wise open interest for FII index futures. NSE was closed on 10 Nov for Diwali Balipratipada, so there is no row for that date. Net short is short contracts minus long contracts, and the ratio is long divided by short.
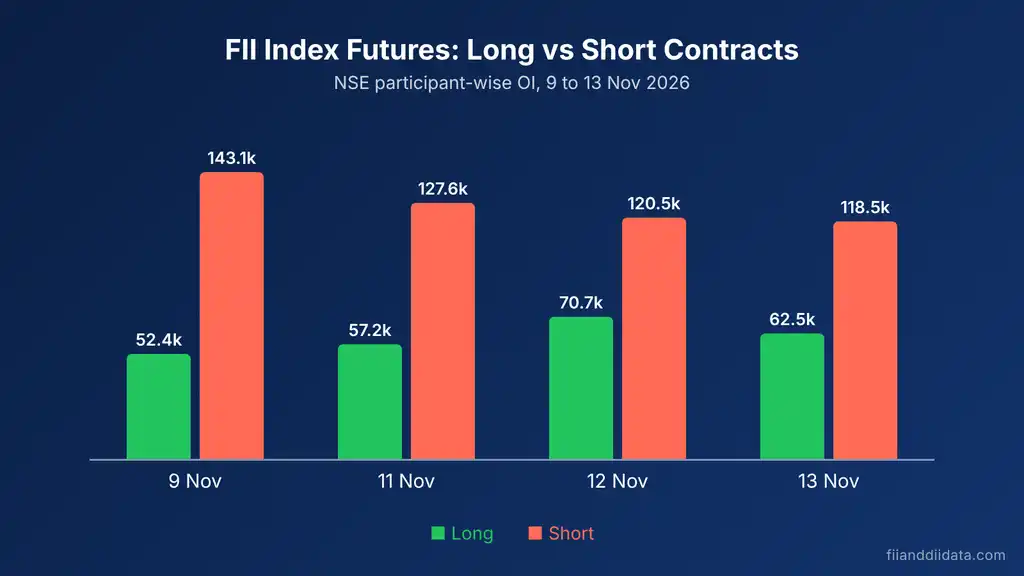
| Date | FII long | FII short | Net short | Long/short |
|---|---|---|---|---|
| 9 Nov | 52,382 | 143,123 | 90,741 | 0.37 |
| 11 Nov | 57,226 | 127,639 | 70,413 | 0.45 |
| 12 Nov | 70,744 | 120,463 | 49,719 | 0.59 |
| 13 Nov | 62,546 | 118,466 | 55,920 | 0.53 |
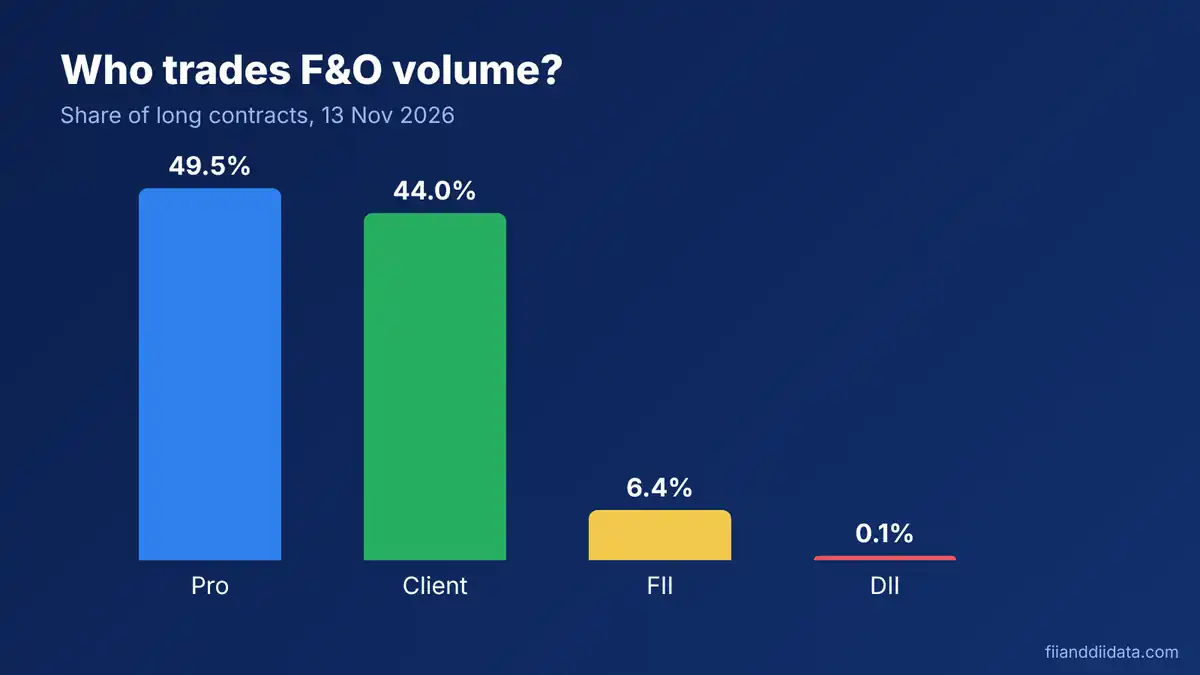
The same file also shows how all four participants stood in index futures on 13 Nov. The totals match on both sides at 314,955 contracts.
| Participant | Long | Short | Net |
|---|---|---|---|
| FII | 62,546 | 118,466 | -55,920 |
| Client | 172,887 | 110,311 | +62,576 |
| Pro | 25,143 | 58,080 | -32,937 |
| DII | 54,379 | 28,098 | +26,281 |
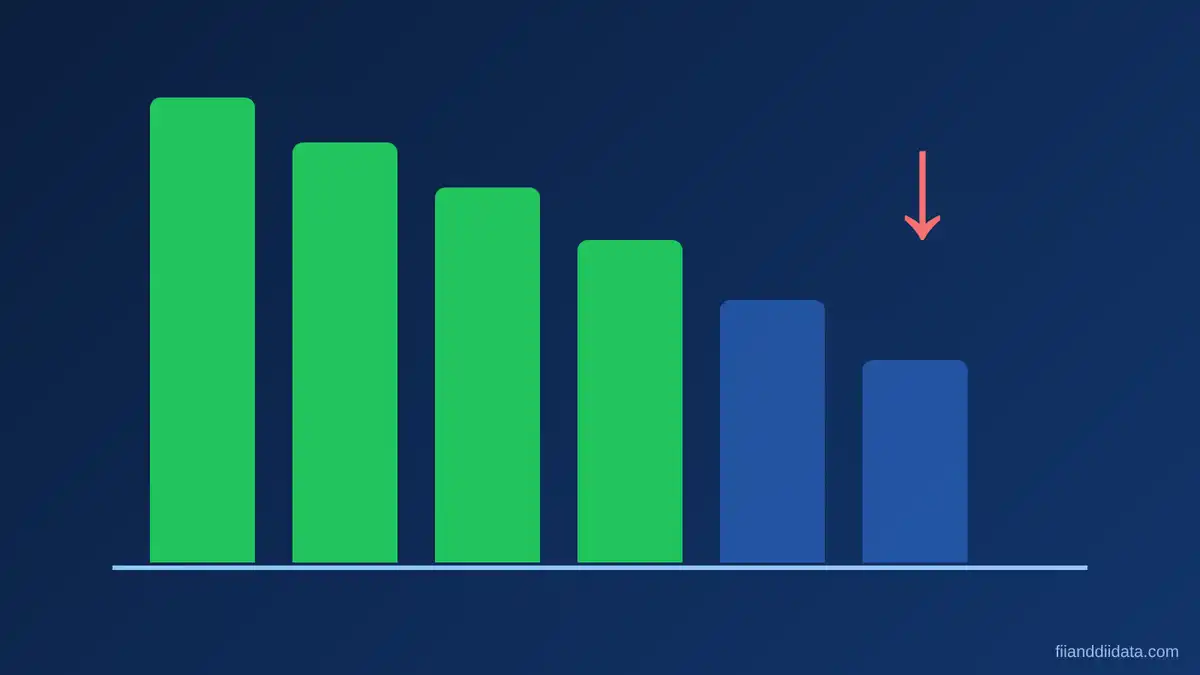
Clients and DIIs were net long while FIIs and Pro traders were net short. The chart below shows how the FII leg moved across the four sessions.
Worked Example With Numbers
Start with what the data actually shows. Between 9 and 13 Nov, FII shorts in index futures fell by 24,657 contracts, from 143,123 to 118,466, a drop of 17.2%. FII longs rose by 10,164 contracts, from 52,382 to 62,546, a gain of 19.4%. Net short shrank by 34,821 contracts, from 90,741 to 55,920. The long short ratio improved from 0.37 to 0.53.
That is the opposite of a build up. FIIs were reducing shorts and adding longs across the week, which is closer to short covering. The latest session adds a small twist. From 12 to 13 Nov, FII longs fell by 8,198 contracts and shorts fell by 1,997, so net short rose from 49,719 to 55,920, an increase of 12.5%. The ratio slipped from 0.59 to 0.53. The move came from long cuts, not from new shorts, so it does not qualify as a short build up either.
Now a hypothetical case to show what a real signal looks like. This example is invented for illustration and is not market data. Suppose Nifty futures close 1.0% lower and FII shorts jump by 15,000 contracts, from 118,466 to 133,466, a rise of 12.7%, while longs stay at 62,546. Net short would become 70,920 contracts and the long short ratio would drop to 0.47. If total open interest also rose that day, and the pattern repeated for two or three sessions, you would have a confirmed FII short build up.
A Simple Confirmation Checklist
One day of data is noise. Use the steps below before you treat any session as a signal.
- Check the price. Did Nifty futures close lower than the previous session?
- Check FII shorts. Did FII short contracts in index futures rise compared with the last file?
- Check total open interest. Did overall index futures open interest rise too?
- Check the ratio. Is the FII long short ratio falling, and is net short growing?
- Repeat for two or three sessions. Compare with cash flows before you act on the view.

Common Mistakes, Pros and Cons
Mistakes to avoid
- Reading net short as a forecast. A hedge looks identical to a bearish bet in the file.
- Using one session. A single day of added shorts can reverse the next morning.
- Ignoring the price. Rising shorts with a rising market is a different story from rising shorts in a falling market.
- Treating provisional numbers as final. NSE can revise them, so check the next day’s file.
- Skipping stock futures and options. Index futures alone gives half the picture.
Pros of tracking it
- The data is free, daily and published by NSE itself.
- It separates FII behaviour from Client, DII and Pro activity.
- It adds a positioning view that price charts alone do not show.
Cons and limits
- It cannot separate hedges from directional shorts.
- It shows end-of-day totals, so intraday reversals are invisible.
- Expiry rollovers can change open interest without any change in view.
Related Concepts
Short build up sits next to three related signals. Short covering is the reverse, where sellers buy back and push prices up. Long unwinding is buyers leaving in a falling market. The FII long short ratio condenses the whole position into one number. Together with the cash flows on our home page for FII and DII data, they give a fuller read of institutional mood than any single metric.
Frequently Asked Questions
What is FII short build up?
FII short build up is a session where the index futures price falls and open interest rises while FII short contracts increase. It suggests foreign institutions are opening new short positions, though some of them may be hedges.
Is an FII short build up always bearish?
No. FIIs often short index futures to hedge a large cash portfolio, so a rising short count can reflect protection and not a falling view. Confirm with price action, total open interest and the long short ratio.
How is short build up different from short covering?
In a short build up the price falls and open interest rises because new shorts are added. In short covering the price rises and open interest falls because existing shorts are bought back to close.
Where can I find FII index futures long and short data?
NSE publishes participant-wise open interest files each trading day, with long and short contracts for FII, DII, Client and Pro. You can also follow the summary on this site.
When is the NSE participant-wise data released?
NSE releases provisional participant-wise open interest data around 6 PM IST on trading days. The numbers can be revised, so check the next day’s file before relying on them.
The Bottom Line
An FII short build up needs three things at once: a falling price, rising open interest and rising FII shorts. The 9 to 13 Nov 2026 data shows none of that. FII shorts in index futures dropped 17.2%, net short narrowed by 38.4%, and the small rise in net short on 13 Nov came from long cuts. Watch the next few files, apply the checklist, and treat any single day with caution.
Sources: NSE participant-wise open interest files for 13 Nov 2026 and 9 Nov 2026 (provisional); Kotak Neo, What is Short Buildup.
Disclaimer: This article is for information and education only. It is not investment advice. Derivatives carry high risk, and NSE data is provisional and may be revised. Consult a SEBI-registered adviser before you trade.