FII long build up is a derivatives pattern in which prices rise and open interest rises at the same time, which usually means foreign institutional investors (FIIs) are adding fresh long positions instead of simply closing old shorts. It is one of four price and open interest readings, and it is the one traders watch most closely when they want to know whether foreign money is genuinely turning bullish. This guide explains how to read it, then tests the idea on real NSE participant-wise data for 6 to 13 November 2026, where the answer turns out to be more mixed than the headline suggests.
Key Takeaways
- A long build up needs price up and open interest up on the same day. Price up with open interest down is short covering, which is a weaker signal.
- FII index futures longs rose from 48,656 to 62,546 contracts between 6 and 13 November 2026, while shorts fell from 149,072 to 118,466.
- Only 12 November looked like a clean long build up. The Nifty rose 0.17% to 25,299.35 and total index futures open interest rose by 12,449 contracts.
- FIIs were still net short 55,920 index futures contracts on 13 November, so the week showed a shrinking bearish bet, not a full bullish turn.
In this guide
- What FII long build up means
- How to read it with price and open interest
- What the 6 to 13 November data shows
- Worked example: was 12 November a true long build up?
- Five checks before you trust the signal
- Common mistakes, pros and cons
- FAQ
What Is FII Long Build Up?
Open interest (OI) is the number of futures contracts that are still open and not yet closed. When FIIs buy new index futures contracts, their long positions and the total open interest both go up. If the index rises on the same day, the market is rewarding that buying, and traders call the combination a long build up.
The word “FII” matters here. Total open interest belongs to all participants, so a rise in it does not prove that foreign investors were the buyers. The participant-wise file published by the NSE splits open interest into FII, DII, Pro and Client positions, and that split is what lets you attach the pattern to foreign investors. Our page on NSE participant-wise open interest data shows the daily figures, and our guide to open interest covers the basics.
How to Read FII Long Build Up With Price and Open Interest
Two numbers decide the reading: the direction of price and the direction of open interest. Each pair of directions gives a different story, and mixing them up is the most common error beginners make.
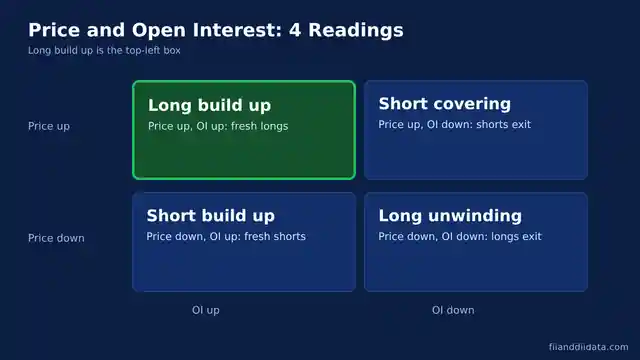
| Price | Open interest | Reading | What it suggests |
|---|---|---|---|
| Up | Up | Long build up | Fresh buying, new longs added |
| Up | Down | Short covering | Shorts closing, no new conviction |
| Down | Up | Short build up | Fresh selling, new shorts added |
| Down | Down | Long unwinding | Longs closing, buyers leaving |
The reason open interest is the tie breaker is simple. Price can rise because sellers are closing positions, which reduces open interest, or because new buyers are entering, which increases it. Only the second case adds real demand. You can compare the other readings in our guides to FII short build up, FII short covering and FII long unwinding.
FII Long Build Up in Index Futures: What the 6 to 13 November Data Shows
The latest participant-wise file available on 14 November 2026 is for Friday 13 November. NSE data for the week shows FIIs adding index futures longs and cutting shorts at the same time. Longs rose by 13,890 contracts, a gain of about 28.5%, while shorts fell by 30,606 contracts, a drop of about 20.5%. The net short position narrowed from 100,416 to 55,920 contracts over the five sessions for which we have data (10 November was a holiday).
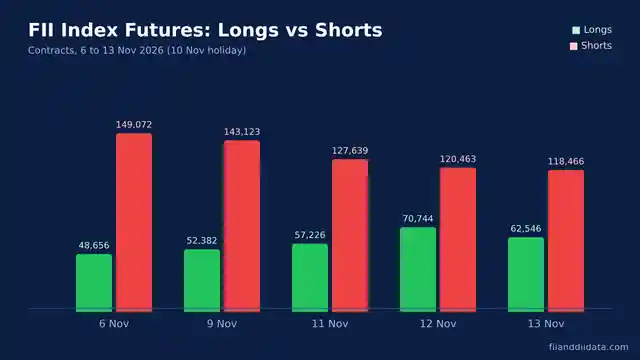
| Date | FII long | FII short | FII net | Long to short ratio |
|---|---|---|---|---|
| 6 Nov | 48,656 | 149,072 | -100,416 | 0.33 |
| 9 Nov | 52,382 | 143,123 | -90,741 | 0.37 |
| 11 Nov | 57,226 | 127,639 | -70,413 | 0.45 |
| 12 Nov | 70,744 | 120,463 | -49,719 | 0.59 |
| 13 Nov | 62,546 | 118,466 | -55,920 | 0.53 |
The trend is clear, but it is not the same as a long build up on every day. A falling short book counts as short covering, and a rising long book counts as buying. Both happened, in different proportions. Our page on the FII long short ratio tracks this balance, and the FII futures data page holds the full history. The ratio in the table rose from 0.33 to 0.53, yet it stayed well below 1, so FIIs remained net short throughout.
Worked Example: Was 12 November a True FII Long Build Up?
To test the pattern, compare the Nifty close with the total index futures open interest on each session, using 9 November as the base. Total open interest here covers all participants, so it tells you whether the market as a whole added or removed contracts. The FII columns then tell you who did it.
| Date | Nifty close | Price change | Total index futures OI | OI change | Reading |
|---|---|---|---|---|---|
| 9 Nov | 25,044.65 | Base | 319,312 | Base | Base |
| 11 Nov | 25,255.05 | +0.84% | 310,214 | -9,098 | Short covering |
| 12 Nov | 25,299.35 | +0.17% | 322,663 | +12,449 | Long build up |
| 13 Nov | 25,144.30 | -0.61% | 314,955 | -7,708 | Long unwinding |
Only 12 November passes the test. The Nifty rose 0.17%, total open interest rose by 12,449 contracts, and FIIs added 13,518 longs (57,226 to 70,744) while cutting 7,176 shorts. That is the cleanest evidence of new foreign buying in the week. The move on 11 November looks different. The Nifty rose 0.84%, but total open interest fell by 9,098 contracts, which points to short covering. Even so, FII longs rose by 4,844 that day, so the picture was mixed.
Then came 13 November. The Nifty fell 0.61% and open interest dropped by 7,708 contracts. FII longs fell by 8,198 (70,744 to 62,546) and shorts fell by 1,997. That is long unwinding, and it undid part of the previous day’s build up within one session. This is why a single day of long build up should never be treated as a trend. Cash buying was strong in the same week, as our FII DII weekly report for 13 November 2026 shows, but futures positioning told a more careful story.
Five Checks Before You Call It a Long Build Up
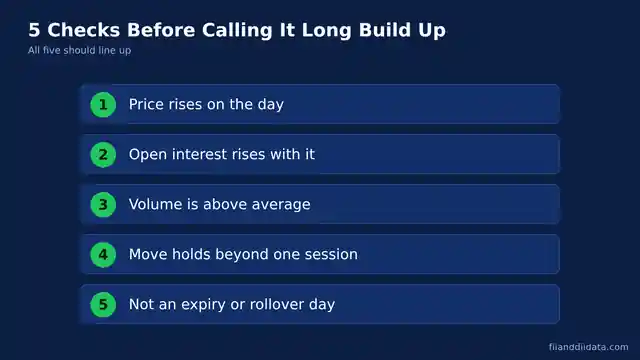
- Confirm that price rose on the day, using the closing level and not an intraday spike.
- Confirm that open interest rose too. If it fell, you are looking at short covering.
- Check the FII row in the NSE participant-wise file to see whether FII longs increased, not only total open interest.
- Look at the next session. A build up that reverses the next day, as on 13 November, is weak evidence.
- Check the calendar. Expiry and rollover days move open interest for reasons that have nothing to do with a view on direction.
Rollover deserves a special mention. Near expiry, traders close the near month contract and open the next month contract, which can shuffle open interest even when no one has changed their view. For a wider look at how derivatives and cash data fit together, read our guide to FII DII cash data versus participant-wise OI.
Common Mistakes, Pros and Cons of Using FII Long Build Up
Mistakes to avoid
- Treating a net short FII book as bearish by default. FIIs often short index futures to hedge cash holdings, so a short position is not always a market view. Our guide on index futures versus index options explains how to cross check.
- Reading total open interest as FII activity. Always confirm with the FII row.
- Acting on one day. The 12 and 13 November sequence shows how fast the signal can flip.
- Ignoring stock futures. Index futures show one side of the picture, and our page on FII stock futures position covers the other.
Pros
- It separates new buying from short covering, which price alone cannot do.
- The data is public, free and updated every trading day.
- It adds a derivatives view that cash market flows do not give.
Cons
- Provisional data can be revised, and NSDL remains the final record for FPI flows.
- Hedging, arbitrage and rollover can create false signals.
- The data shows positions, not intent, so it cannot tell you why FIIs bought.
Related Reading
For the daily cash numbers, see FII DII data today. To understand the participant categories in the NSE file, read participant-wise OI meaning and Pro versus Client open interest. For the full dashboard, visit FII and DII data.
Frequently Asked Questions
What does FII long build up mean?
It means price and open interest rise together while FIIs add fresh long positions. It suggests new buying, unlike short covering, where open interest falls.
How is long build up different from short covering?
In a long build up both price and open interest rise. In short covering price rises but open interest falls, because traders are closing short positions instead of opening new longs.
Was there an FII long build up in November 2026?
Partly. On 12 November the Nifty rose 0.17% and total index futures open interest rose by 12,449 contracts while FII longs rose by 13,518. On 13 November the pattern reversed into long unwinding.
Where can I find FII index futures data?
NSE publishes participant-wise open interest files each trading day, with provisional data around 6 PM IST. NSDL is the final record for FPI flows.
Is a long build up a sure bullish signal?
No. Hedging, rollover and one day reversals can create false signals. Confirm with the FII row, the next session and the calendar before drawing a conclusion.
The Bottom Line
FII long build up is a useful signal when price and open interest rise together and the FII row confirms new longs. The November data shows why care is needed: FIIs cut their net short by about 44% over the week, yet only 12 November met the full test, and the next day reversed part of it. Watch whether FII longs hold above 62,000 contracts and whether the net short keeps shrinking in the coming sessions.
Sources: NSE participant-wise open interest files for 6 November, 9 November, 11 November, 12 November and 13 November 2026 (provisional); NSE FII/DII statistics; NSDL FPI Monitor (final FPI data). Nifty closing levels from NSE.
Disclaimer: This article is for information only and is not investment advice. Markets carry risk, so consult a SEBI registered adviser before acting.