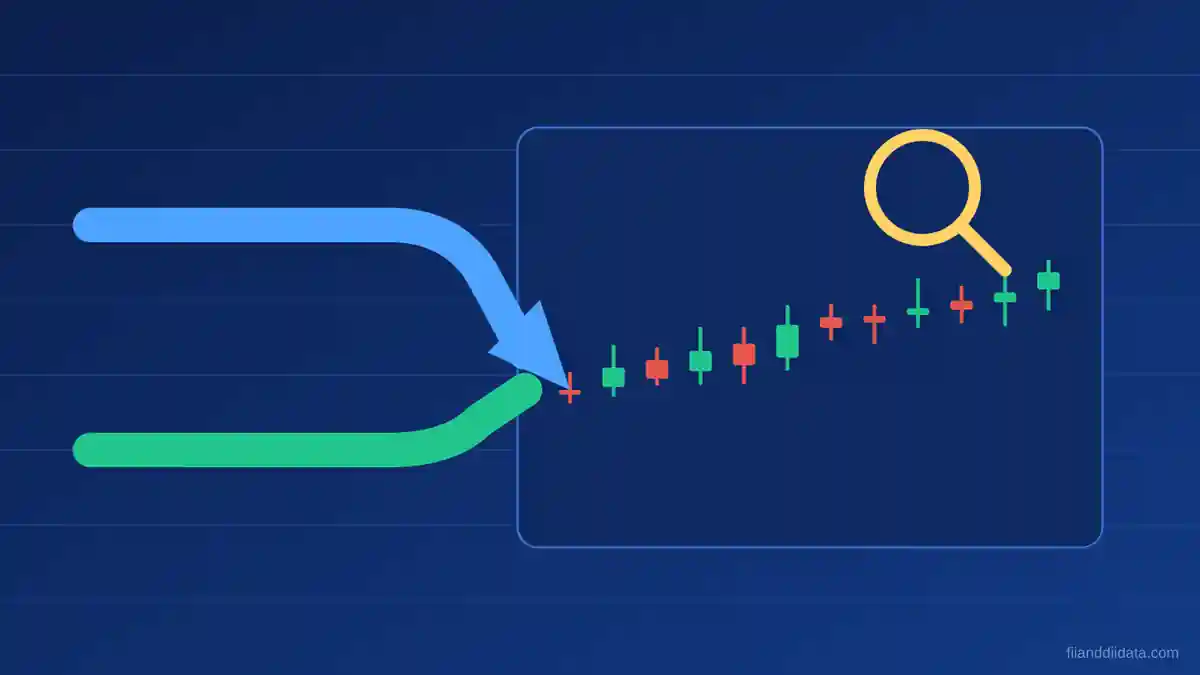
Knowing how to use FII DII data for trading means reading more than one headline number. FIIs bought a net ₹45,960 crore of Indian shares in the five sessions to 6 November 2026 while DIIs sold ₹24,197 crore, yet the useful signal sits in how the two lines, the gross figures and the F&O positions fit together.
Key Takeaways
- Read FII and DII net cash flows together, never one alone.
- A single day is noise. Add up five sessions before drawing a view.
- Gross buy and sell figures show how much activity sits behind the net number.
- Cash flows tell you what happened. F&O positions tell you what traders expect next.
- Confirm every flow signal with the Nifty price before acting on it.
In this guide
- What FII and DII data shows
- A worked example with 2-9 November 2026 data
- The four FII and DII combinations
- Cash versus F&O, gross versus net
- A 5-step daily scorecard
- Common mistakes
- FAQs
- The bottom line
What FII and DII Data Actually Shows
FII stands for foreign institutional investors, now reported mostly under the FPI label. DII stands for domestic institutional investors, mainly mutual funds, insurers and banks. Each day the exchanges publish how much each group bought, how much it sold and the net difference in the cash market. Our FII and DII data pages track these figures session by session.
Timing matters. Official figures are released after the market closes. NSE provisional numbers usually appear around 6 PM IST, and NSDL publishes its own FPI reports on the next working day. So this data helps you plan the next session, not react to the current one. NSE labels the early numbers provisional, and small revisions are normal.
The two groups behave differently. FIIs respond to global risk appetite, dollar moves and relative valuations, so their flows can swing hard in a few days. DIIs, funded by monthly SIP money, tend to buy dips steadily. For a deeper look at the domestic side, see how to read DII buy, sell and net figures, and for the foreign side, the six channels through which FIIs move Nifty.
A Worked Example: How to Use FII DII Data for Trading, 2-9 November 2026
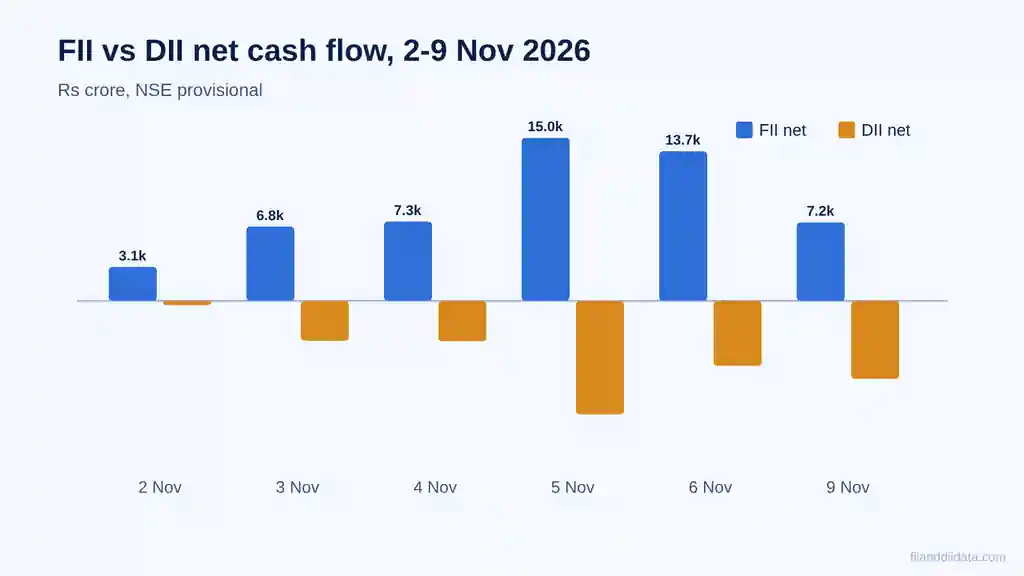
The table below uses NSE provisional net cash figures for six sessions. The combined column simply adds FII and DII nets, which shows whether institutions as a whole were absorbing or supplying shares.
| Date (2026) | FII net (₹ crore) | DII net (₹ crore) | Combined (₹ crore) |
|---|---|---|---|
| 2 Nov | +3,115 | -392 | +2,722 |
| 3 Nov | +6,837 | -3,679 | +3,158 |
| 4 Nov | +7,284 | -3,712 | +3,572 |
| 5 Nov | +14,975 | -10,445 | +4,530 |
| 6 Nov | +13,750 | -5,969 | +7,781 |
| 9 Nov | +7,212 | -7,173 | +39 |
Add up the first five sessions, 2 to 6 November. FIIs were net buyers of ₹45,960 crore. DIIs were net sellers of ₹24,197 crore. The combined figure is a net ₹21,763 crore of buying. That is a foreign-led move with domestic funds booking profits into it, which is the second of the four patterns explained below.
Now look at 9 November. FII buying cooled to ₹7,212 crore and DII selling rose to ₹7,173 crore, so the combined figure fell to almost zero. A trader reading only the FII line would see another strong buying day. A trader reading both lines would see that the follow-through had faded. That gap is the practical value of the data.
The Four FII and DII Combinations
Every session falls into one of four boxes. The label is a starting hypothesis, not a verdict.
- FII buy and DII buy: broad support. Both groups want shares, so dips tend to be shallow.
- FII buy and DII sell: a foreign-led rally. Domestic funds take profits into strength. It holds only if FII buying persists.
- FII sell and DII buy: a domestic cushion. Index declines slow down, but a market held up only by SIP money can still drift lower.
- FII sell and DII sell: weak and risk-off. This is the pattern that most often comes with sharp falls.
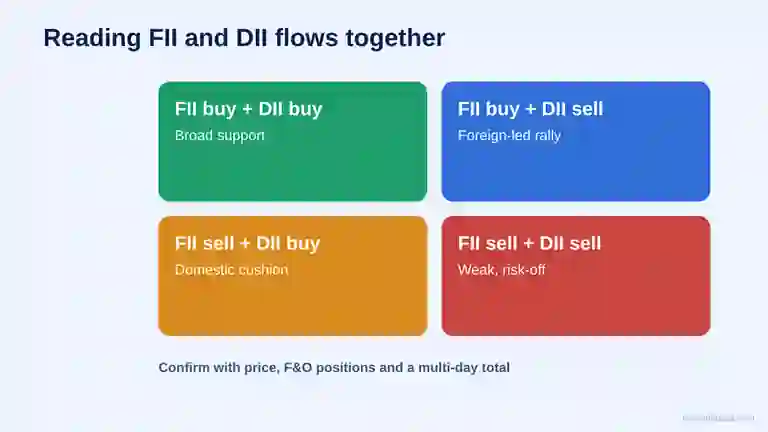
Single sessions flip between boxes often. The pattern becomes useful when the same box repeats over several days, as it did from 2 to 6 November.
Cash Versus F&O, and Gross Versus Net
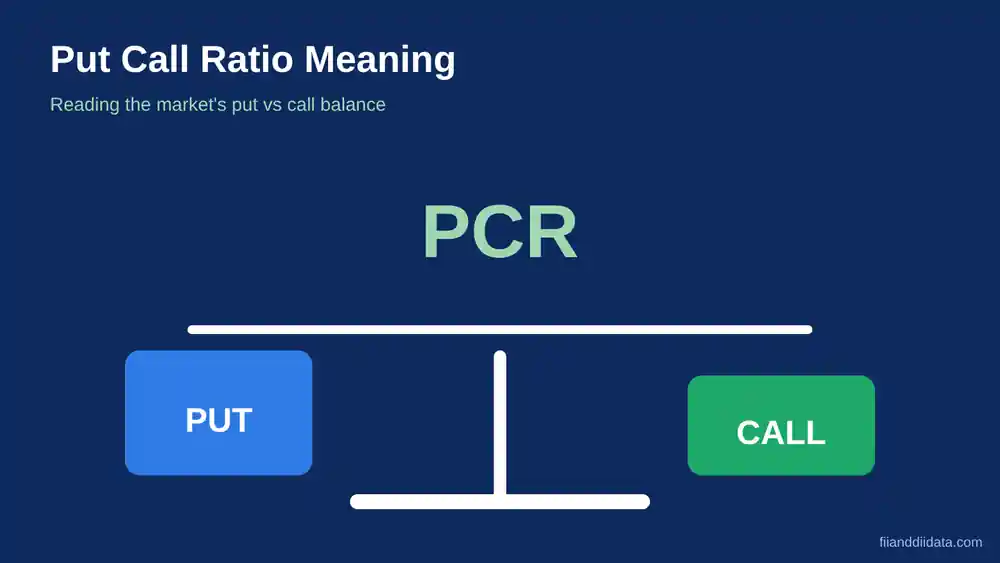
The cash market shows delivery-based buying and selling. It says what institutions did. The futures and options segment shows how they are positioned. A foreign investor can be a heavy cash buyer and still hold large index futures shorts as a hedge. If you read only cash, you miss that hedge. The participant-wise open interest data fills the gap, and pairing it with the Nifty put call ratio adds the options view. When FIIs cover shorts, FII short covering can explain a rally that cash flows alone do not.
Gross figures matter too. A net buy of ₹5,000 crore can come from ₹20,000 crore bought and ₹15,000 crore sold, or from ₹8,000 crore bought and ₹3,000 crore sold. The first is a high-churn day and the second a quiet accumulation day. Our explainer on gross versus net selling works through the same idea with October 2026 numbers.
How to Use FII DII Data for Trading: A 5-Step Daily Scorecard
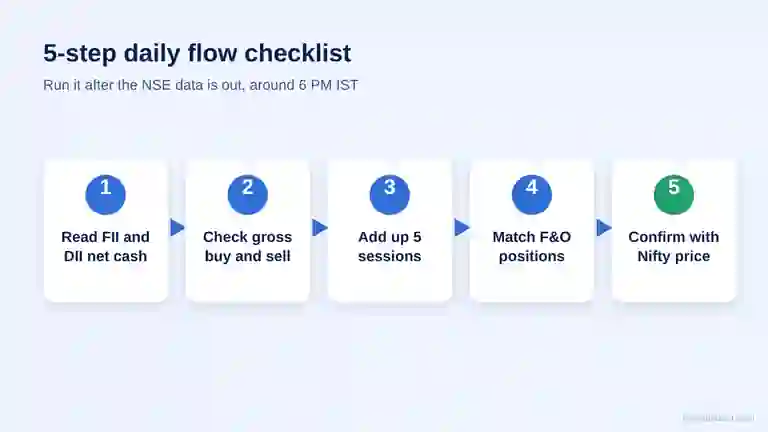
Run this routine once the NSE numbers are out, usually after 6 PM IST. The thresholds are working rules used in this guide, not official benchmarks. Adjust them to your own risk and holding period.
- Read the net cash flow for both groups. Note the sign. As a rough guide, a net figure within ±₹1,000 crore is background noise for FIIs.
- Check gross buy and sell. Large gross numbers with a small net mean heavy two-way trading, which is a weaker signal than a one-sided day.
- Add up five sessions. A five-day FII total beyond ±₹10,000 crore is worth treating as a trend. Our example showed +₹45,960 crore.
- Match F&O positions. Check whether FII index futures positions agree with the cash direction. Disagreement means the cash signal deserves less weight.
- Confirm with the Nifty price. If FIIs buy heavily and Nifty still fails to rise, treat the flow as absorbed by supply, not as a bullish signal.
Short-term traders can compress the same routine into the intraday version of this routine, which uses the previous evening data to frame the next morning. If you chart flows on a platform, the FII DII TradingView indicator guide lists five checks before relying on any plotted series.
How to use FII DII data for trading when the signals conflict
Conflict is common. Suppose FIIs buy for three days while Nifty falls. Either the buying is going into stocks outside the index heavyweights, or heavy domestic selling is absorbing it. In that case, lower your position size, wait for the five-day total and the price to agree, and avoid forcing a view from one data series.
Common Mistakes When Reading the Data
- Trading on one day. A single large figure is often a rebalancing or block deal. Five-session totals filter this out.
- Ignoring DII flows. Strong DII buying can hide FII selling for weeks, and the reverse also happens.
- Treating provisional data as final. NSE figures can change slightly once NSDL data arrives.
- Skipping F&O positions. Cash buying with large futures shorts is a different story from cash buying with long positions.
- Expecting a fixed link to price. Flows lean on price but do not control it. Earnings, rates and global news can overrule them.
How Different Traders Put the Data to Work
The same flow data serves different horizons, and the weight you give it should match how long you hold a position.
Intraday and short-term traders use the previous session as a bias filter. After a run like 2 to 6 November, a trader may prefer buying dips in the first hour while the price holds above the prior close, and may cut risk sooner if Nifty loses that level. The flow figure does not give an entry. It tells you which side has been paying up.
Swing traders care about the five-day and monthly totals. A month in which FIIs stay net sellers while DIIs absorb most of it usually produces a range-bound index with sharp moves in individual sectors. A month in which both groups buy tends to favour broad participation, including mid caps. Comparing the current month with the previous one shows whether the pressure is easing or building.
Positional and long-term investors should treat daily flows as background. Monthly and quarterly FPI totals, ownership changes and valuation levels matter more than any single fortnight. A heavy FII outflow can still be a buying window for a long-term investor if earnings are intact, though that is a judgement about the company, not about the flow.
Whatever the horizon, keep a simple log. Write down the five-day FII total, the five-day DII total, the Nifty close and your view each evening. After a month you will see how often the flow signal agreed with price in your own sample, and that record is more reliable than any rule of thumb in a guide. If the agreement is weak, reduce the weight you give the flows. If it is strong, you have an evidence-based reason to lean on them.
Finally, remember what the data cannot do. It does not show the intent behind a trade, it is reported with a delay, and large institutions often trade through different entities and segments. Use it as one input among price, volume, derivatives positioning and the news calendar.
FAQs
How to use FII DII data for trading?
Read FII and DII net cash flows together, add up five sessions, check gross buy and sell figures, match them with F&O positions and confirm with the Nifty price. Use the data to frame the next session, not to react to the current one.
What time is FII DII data released?
NSE provisional FII and DII figures are usually available around 6 PM IST after the market closes. NSDL publishes its FPI reports on the next working day.
Is FII buying always bullish for Nifty?
No. If heavy DII selling absorbs the FII buying, or if FII futures positions are net short, the index may not rise. Confirm the flow with price and F&O data.
How many days of data should I track?
Five sessions is a practical minimum because it filters out one-day block deals and rebalancing. Many traders also compare the monthly total with the previous month.
Where can I check the official FII and DII figures?
The NSE publishes daily FII and DII cash market activity, and NSDL publishes FPI investment reports. Both are the primary sources for these numbers.
The Bottom Line
FII and DII flows are a context tool. The 2 to 6 November 2026 run, with FIIs buying ₹45,960 crore and DIIs selling ₹24,197 crore, showed a foreign-led move, and the fade on 9 November showed why the second line matters. Read both groups, add up five sessions, check F&O positions and let the Nifty price confirm before you act.
Sources: NSE India, FII/DII trading activity; NSDL FPI Monitor. Figures for 2-9 November 2026 are NSE provisional data.
Disclaimer: This article is for education only and is not investment advice. Markets carry risk. Consult a SEBI-registered adviser before making trading decisions.