The rupee depreciation impact on stock market returns is mixed: a weaker rupee lifts the earnings of dollar earners such as IT and pharma exporters, but it hurts airlines, oil marketers and foreign investors who count their gains in dollars. On 9 November 2026 the rupee touched a six-month high of 93.70 per dollar, more than 3% above its recent record low near 96.90, so the pressure has eased for now.
Key Takeaways
- A weaker rupee raises rupee revenue for exporters and raises dollar costs for importers.
- IT services, pharma and textile makers usually gain; airlines, oil marketers and auto firms usually lose.
- On 9 November 2026 the rupee hit 93.70, a six-month high, after a record low near 96.90.
- In a hypothetical exporter, USD/INR at 95 instead of 90 lifts operating margin from 24.0% to 26.6%.
- Read USD/INR with crude, the dollar index, RBI reserves and FPI flows, not on its own.
In this article:
- Rupee depreciation impact on stock market: the basics
- Four ways a weaker rupee reaches share prices
- Sector winners and losers
- What company results show
- Latest rupee data and the RBI
- Worked example: exporter margin and airline cost
- A weekly checklist for investors
- Common mistakes
- FAQs
- The Bottom Line
Rupee Depreciation Impact on Stock Market: The Basics
Rupee depreciation means one US dollar buys more rupees than before. When USD/INR (the number of rupees per dollar) moves from 90 to 95, the rupee has lost about 5.3% of its value against the dollar. Small daily moves are normal. The topic matters when the move is large and lasts for weeks.
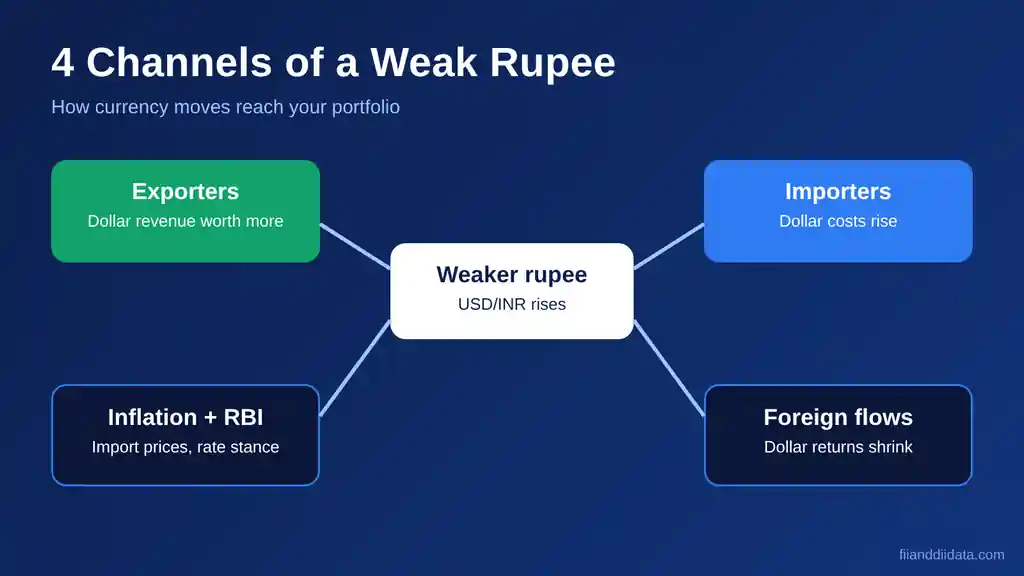
The stock market feels a falling rupee through four doors: company profits, inflation, interest rates and foreign money. Indian companies earn and spend in different currencies, so one exchange rate move helps some firms and hurts others. That is why the Nifty often shows a muted reaction while individual stocks swing sharply.
2026 has been a real test. The rupee touched a record low near 96.90 per dollar and then recovered. On 9 November it traded at a six-month high of 93.70, after closing at 93.9050 on Friday, according to Kotak Neo. We cover the foreign-selling side of the story in our guide to the weak rupee and FII selling. This article looks at companies and sectors.
To see how the effect travels, start with the four channels.
Four Ways a Weaker Rupee Reaches Share Prices
- Exporters earn more in rupees. A company that bills clients in dollars gets more rupees for each dollar of sales. If most of its costs are in rupees, profit rises faster than revenue.
- Importers pay more in rupees. Crude oil, electronics, chemicals and aircraft parts are bought in dollars. A weaker rupee raises the rupee cost of every shipment, and margins shrink unless prices go up.
- Inflation and the RBI. Costlier imports can add to inflation, though they are only one factor. CPI inflation was 5.54% in September 2026, and the RBI raised the repo rate by 25 basis points to 5.50%, its first hike in almost four years, as reported by ThePrint. Higher rates raise borrowing costs and cut stock valuations.
- Foreign flows. Foreign portfolio investors (FPIs) judge returns in dollars. A falling rupee reduces those returns and can trigger selling. Our FPI outflow 2026 report tracks the numbers.
Outside forces often drive all four channels at once. Costly oil and rising US yields can push the rupee down, a link we explain in our guides on crude oil and FII flows and US bond yields and Indian markets.
Knowing the channels, the next question is which sectors sit on which side.
Rupee Depreciation Impact on Stock Market Sectors: Winners and Losers
| Sector | Usual effect of a weaker rupee | Why |
|---|---|---|
| IT services | Gains | Revenue is in dollars; most salaries and rent are in rupees. |
| Pharma exporters | Gains | Overseas sales convert into more rupees. |
| Textile exporters | Gains | Export orders are priced in dollars. |
| Airlines | Loses | Fuel, aircraft leases and maintenance are dollar costs. |
| Oil marketing companies | Loses | Crude is bought in dollars and retail prices are controlled. |
| Autos and electronics | Loses | Imported components cost more in rupees. |
| Firms with dollar debt | Loses | Loan repayments rise in rupee terms. |
The word “usually” matters. Hedging, long-term contracts and pricing power can reverse the pattern for a single company. A large exporter that has sold its dollars forward at an old rate will not enjoy the full gain, and an importer with strong pricing power can pass costs to customers.
Real results show how far company-level facts can differ from the textbook.
What Company Results Show
Rupee depreciation impact on stock market results: three real cases
- TCS, Q2 FY27 (results on 8 October 2026). Revenue in rupees rose 11.2% year on year to ₹73,188 crore, while constant currency growth was only 2.8%. Yet the operating margin was 24.0%, down from 25.2% a year earlier, because of higher operating expenses and subcontracting costs, per Investing.com. The rupee flattered revenue, but it did not fix costs.
- Infosys. Its chief financial officer said currency added 40 basis points to margins in its Q4 earnings commentary, but warned that cross-currency effects often offset rupee gains, as quoted by Deccan Herald.
- IndiGo, Q4 FY26 (reported 29 May 2026). The airline posted a net loss of ₹2,536.9 crore. A forex loss of about ₹8,100 crore for FY26 was attributed mainly to sharp rupee depreciation. Excluding forex and exceptional items, FY26 would have shown a profit of ₹7,502.5 crore, per ThePrint.
The lesson is simple. A weak rupee is a tailwind or a headwind, but company costs, competition and demand decide how much of it reaches profit. Now look at where the rupee and the RBI stand today.
Latest Rupee Data and the RBI
| Indicator | Latest reading | Date |
|---|---|---|
| USD/INR close | 93.9050 | 6 Nov 2026 |
| USD/INR six-month high | 93.70 | 9 Nov 2026 |
| Recent record low | About 96.90 | Earlier in 2026 |
| Rupee recovery from record low | More than 3% | As of 9 Nov 2026 |
| Brent crude | Down nearly 20% in a week | Week to 6 Nov 2026 |
| FPI equity buying | More than $4 billion | Week to 6 Nov 2026 |
| Dollar index (DXY) | About 102.2 | 9 Nov 2026 |
| India forex reserves | $717.056 billion (down $2.691 billion) | Week to 30 Oct 2026 |
| CPI inflation | 5.54% | September 2026 |
| RBI repo rate | 5.50% | October 2026 |
Kotak Neo attributed the rally to lower crude, after Brent fell nearly 20% last week, and to strong foreign buying. It also noted that the RBI keeps a sizeable short-dollar position in the forward market and that the rupee’s rise has raised hopes of RBI dollar purchases to rebuild reserves. Such purchases would slow the rupee’s gains. The same report said US jobs growth of 165,000 in October strengthened expectations of a Fed rate hike in December.
For levels, Kotak Neo’s Anindya Banerjee named 93.20 and then 92.50 as the next supports, and said the downward bias holds unless USD/INR closes above 94.20. Two data releases are due: US consumer inflation on 10 November and India’s October retail inflation on 12 November. Reserves of $717.056 billion in the week to 30 October, per RBI data, remain below earlier peaks and give the RBI room to act in either direction.
For a month-by-month view of foreign money, see our FII DII monthly data page. Next, a worked example to put numbers on both sides.
Worked Example: Exporter Margin and Airline Cost
The numbers below are hypothetical and ignore hedging. Take an IT-style exporter with $1,000 million of revenue, ₹4,500 crore of rupee costs and $260 million of dollar costs. Here is its operating profit as USD/INR changes.
| USD/INR | Revenue | Operating profit | Operating margin |
|---|---|---|---|
| 90 | ₹9,000 crore | ₹2,160 crore | 24.0% |
| 92 | ₹9,200 crore | ₹2,308 crore | 25.1% |
| 94 | ₹9,400 crore | ₹2,456 crore | 26.1% |
| 96 | ₹9,600 crore | ₹2,604 crore | 27.1% |
At 90, profit is ₹2,160 crore, a 24.0% margin. At 95, profit is ₹2,530 crore, a 26.6% margin. A 5.6% rise in USD/INR lifts profit by 17.1%, or about 47 basis points of margin for each 1% move. Profit grows faster than revenue because most costs do not rise with the dollar.

Now flip the example. Take a hypothetical airline with ₹20,000 crore of yearly revenue earned in rupees and $1,000 million of yearly dollar costs for fuel, leases and maintenance.
- At USD/INR 90, the dollar costs equal ₹9,000 crore.
- At USD/INR 95, the same costs equal ₹9,500 crore.
- The extra ₹500 crore equals 2.5% of revenue, or about 250 basis points off the margin, unless fares rise or the costs are hedged.
The two examples mirror each other. One firm’s tailwind is another firm’s cost. A portfolio that holds only one type is exposed to a single bet on the rupee, which brings us to a routine for tracking it.
A Weekly Checklist for Investors
You do not need to forecast the rupee. You need to know which way your holdings lean and watch a few signals:
- Sort your holdings. Mark each stock as a dollar earner, a dollar payer or neutral.
- Check USD/INR against recent levels. Note the record low near 96.90, the 93.70 high and the 94.20 line Kotak Neo flagged.
- Check the dollar index and US yields. A strong dollar pressures all emerging market currencies.
- Check Brent crude. Cheaper oil lowers dollar demand from importers.
- Check RBI reserves every Friday. A sharp fall suggests heavy intervention.
- Match it with flows. Compare the signals with FII DII data today, released by NSE around 6 PM IST on trading days, and the NSDL figures the next working day. Our FII and DII data home page collects both.
Even a good checklist can mislead if you fall into a few common traps.
Common Mistakes
- Treating a weak rupee as good for every stock. Exporters gain, but importers, airlines and firms with dollar debt lose.
- Ignoring hedges. A company’s reported gain depends on the rate at which it sold its dollars.
- Judging a sector by one quarter. TCS showed that margins can fall even when rupee revenue jumps.
- Forgetting the global dollar. If most currencies fall against the dollar, the rupee’s move says little about India alone.
If you read the signals in order, most of these errors disappear. The FAQs below answer the questions readers ask most.
FAQs
What is the rupee depreciation impact on stock market returns?
A weaker rupee raises rupee earnings for exporters such as IT and pharma firms and raises costs for importers such as airlines and oil marketers. It can also reduce foreign investors’ dollar returns, which may lead to selling. The net effect on the index depends on which side dominates.
Is a weak rupee good or bad for the Sensex and Nifty?
Neither, on its own. Index heavyweights include both exporters and importers, so effects partly cancel out. A sharp, fast fall is usually negative for the index because it triggers foreign selling and raises inflation worries.
Which stocks benefit when the rupee falls?
Companies that earn in dollars and spend in rupees, mainly IT services, pharma exporters and textile makers. The gain is smaller if the company hedges or if its costs are also tied to the dollar.
Why do FIIs sell when the rupee weakens?
Foreign funds measure returns in dollars, so a falling rupee cuts the value of their Indian holdings. They also convert rupee sale proceeds into dollars, which adds to the pressure on the currency.
What happens to stocks when the rupee strengthens?
Importers and airlines usually benefit from lower dollar costs, while exporters see rupee revenue per dollar fall. Foreign buying of more than $4 billion in the week to 6 November came alongside the rupee’s rally.
The Bottom Line
A falling rupee is not a market signal by itself. It is a transfer: exporters gain rupees, importers pay more, and foreign investors earn less in dollars. In 2026 the rupee reached a record low near 96.90 and then recovered more than 3% to 93.70 by 9 November, helped by cheaper crude and foreign buying.
The picture can change quickly if crude rebounds, US yields rise or the RBI buys dollars. A practical next step is to label each stock you own as a dollar earner or a dollar payer, then track USD/INR beside the flow data. More explainers are on our blog.
Sources: Kotak Neo, 9 Nov 2026; RBI data via ANI on Devdiscourse, 6 Nov 2026; ThePrint, CPI and repo rate, 12 Oct 2026; Investing.com, TCS Q2 FY27, 8 Oct 2026; ThePrint, IndiGo Q4 FY26, 29 May 2026; Deccan Herald, Infosys commentary; Outlook Money.
Disclaimer: This article is for educational purposes only and is not investment advice. Please consult a SEBI-registered advisor before making investment decisions.