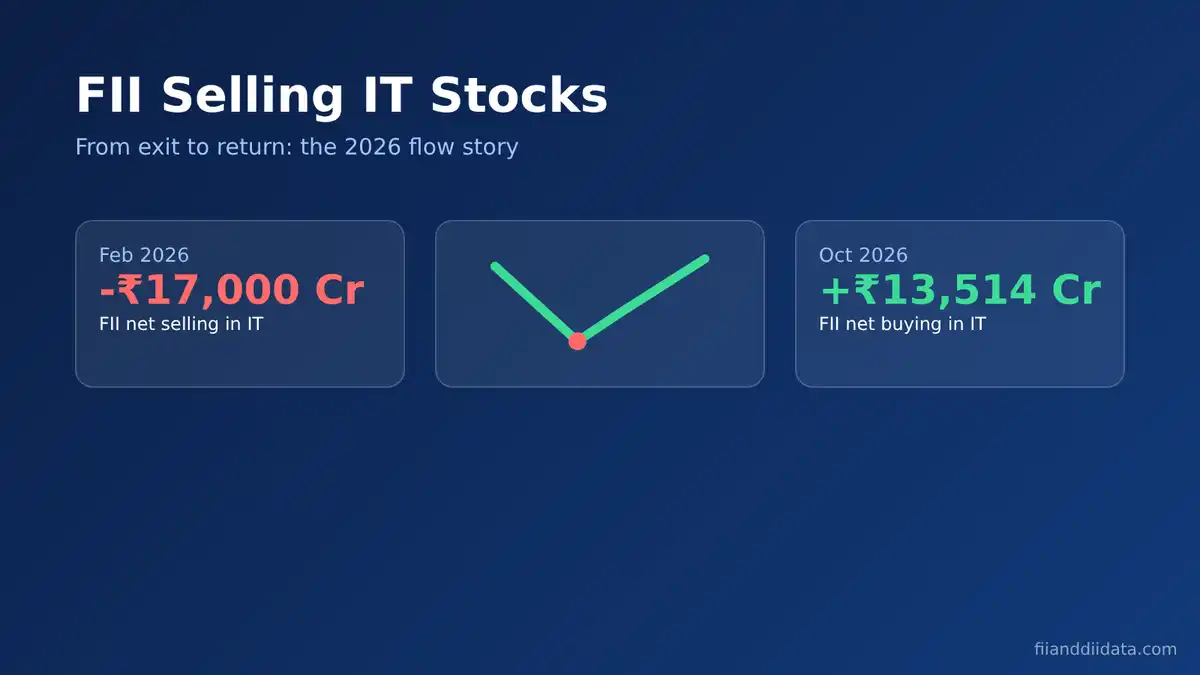
FII selling IT stocks was one of the biggest market stories of 2026, and the data now shows a sharp turn. Foreign investors pulled ₹17,000 crore out of Indian IT shares in February 2026, yet they put a net ₹13,514 crore back into the sector in October 2026, according to NSDL data. This guide explains why the selling happened, how to read the numbers, and what to watch next.
Key Takeaways
- FIIs sold about ₹17,000 crore of IT stocks in February 2026 as fears grew that generative AI could hurt the outsourcing model.
- FII holdings in IT fell to about ₹4.18 lakh crore by end-February 2026, a four-year low and roughly 43% below the start of 2025.
- Most of the fall in holding value came from lower share prices, not only from selling. Our worked example shows the split.
- The trend reversed in October 2026: IT was the top sector for FPI inflows, with a net ₹13,514 crore for the month.
- FPI stake in TCS slipped to 9.01% and in Infosys to 27.44% at end-September 2026, so the long-term positioning is still light.
In this article
- What FII Selling in IT Stocks Means
- Why FIIs Sold IT Stocks in 2025 and 2026
- FII Selling IT Stocks: The 2026 Data Timeline
- How FII Stake Changed in TCS and Infosys
- How to Read FII Selling IT Stocks Data: A Worked Example
- What Changed in October 2026
- How Investors Can Use This Data: A Checklist
- Common Mistakes When Reading Sector Flow Data
- FAQs
- The Bottom Line
What FII Selling in IT Stocks Means
Foreign institutional investors (FIIs), now formally called foreign portfolio investors (FPIs), are overseas funds that buy listed Indian shares. When we say FIIs are selling IT stocks, we mean that their total sales of shares such as TCS, Infosys, HCLTech, Wipro and Tech Mahindra are larger than their purchases over a period. The gap is called net selling.
Sector-level numbers come from NSDL, the depository that tracks FPI investments. NSDL publishes sector-wise flows every fortnight, so the IT figure for 1 to 15 October is released separately from the figure for 16 to 31 October. This is different from the daily cash market figures that NSE releases around 6 PM IST, which show only the total buying and selling across all stocks. If you follow the FII and DII data every evening, the fortnightly sector file is what tells you where that money actually went.
IT matters because it is a heavy part of the index. Business Standard noted in February 2026 that the Nifty IT index carries about 10.8% weight in the Nifty 50. A sustained exit from one tenth of the benchmark can drag the whole market, which is why the reasons behind the selling deserve a closer look.
Why FIIs Sold IT Stocks in 2025 and 2026
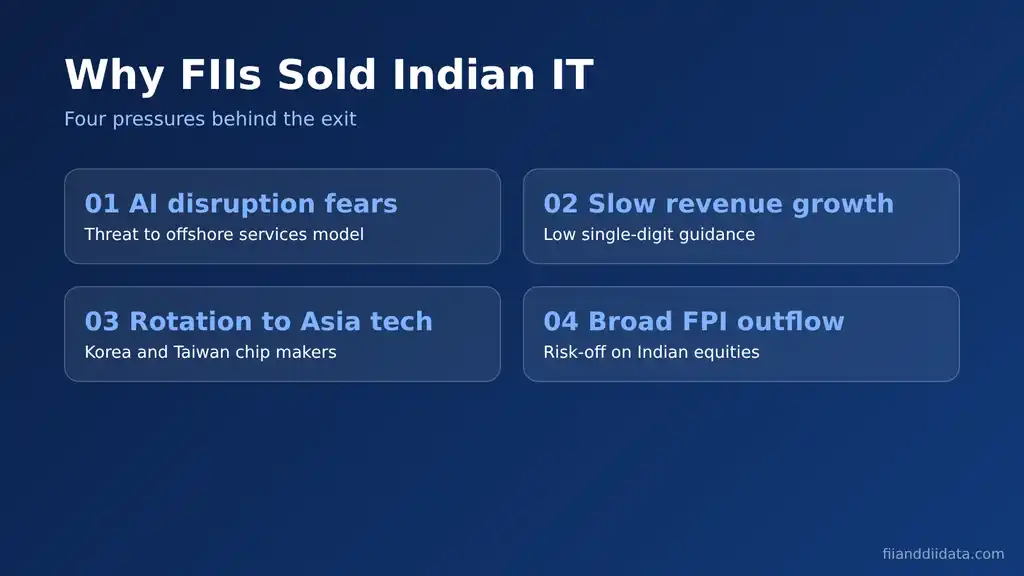
FPIs had been trimming IT exposure since July 2025, but the pace jumped early in 2026. Four pressures explain most of it.
1. Fear that AI will shrink the outsourcing model
Indian IT firms earn most of their revenue by billing for engineers who write, test and maintain software for global clients. As generative AI tools improved, investors worried that clients would need fewer billable hours. 5paisa, citing NSDL data, linked the February 2026 selling directly to “fears over the possible impact of generative artificial intelligence” on the sector.
2. Slow revenue growth
Growth has stayed in low single digits. Infosys guided for 1% to 2% constant currency revenue growth for FY27, according to a 5paisa sector note updated on 3 November 2026. Slow guidance makes premium valuations hard to defend.
3. Rotation to Asian technology hardware
Funds that wanted AI exposure found it more directly in chip makers in South Korea and Taiwan. We covered this shift in detail in our note on FII rotation to Korea and Taiwan.
4. Broad FPI outflow from India
IT was not alone. FPIs were net sellers across most sectors for much of 2026, and the pattern is laid out in our study of sector-wise FII selling in 2026. When foreign funds cut India as a whole, large and liquid IT names are often sold first because they are easy to exit.
Knowing the reasons is useful, but the size and timing of the flows tell you how strong each phase was. The next section lays out the numbers.
FII Selling IT Stocks: The 2026 Data Timeline
The table below brings together the key fortnightly and monthly IT flow figures we could verify from NSDL-based reports. A negative number is net selling; a positive number is net buying.
| Period | FPI net flow in IT (₹ crore) | What it showed |
|---|---|---|
| 1 to 14 Feb 2026 | about -11,000 | Peak of the AI-fear sell-off |
| 15 to 28 Feb 2026 | about -5,993 | Selling slowed but continued |
| February 2026 (month) | about -17,000 | One of the largest monthly IT exits |
| 1 to 15 Oct 2026 | +2,599 | Top sector inflow while FPIs sold ₹47,955 crore overall |
| 16 to 31 Oct 2026 | +10,915 | Second only to telecom |
| October 2026 (month) | +13,514 | Clear reversal from the February low |
Two points stand out. First, February 2026 was a capitulation month: FII holdings in IT stocks fell from ₹5.34 lakh crore at end-January to about ₹4.18 lakh crore at end-February, the lowest in four years. At the start of 2025 the same holding was worth about ₹7.3 lakh crore, and cumulative FII selling in IT since then had reached about ₹74,698 crore by end-February.
Second, October 2026 stood out against the broader trend. Business Standard reported that in the first half of October, FPIs sold ₹47,955 crore in total, yet IT drew the largest inflow of any of the 24 sectors tracked. In the second half, Angel One noted that IT took in ₹10,915 crore as FPIs turned net buyers of ₹13,112 crore. Sector totals like these are best read next to the monthly FII DII data, which shows the overall direction of foreign money.
How FII Stake Changed in TCS and Infosys
Flow data tells you what happened in a fortnight. Shareholding data tells you how much foreign investors own at the end of each quarter. Companies file this with the exchanges after every quarter, and our guide on how to read an FII shareholding pattern explains the format.
| Quarter end | FPI stake in TCS | FPI stake in Infosys |
|---|---|---|
| Sep 2025 | 10.3% | 30.1% |
| Dec 2025 | 10.4% | 30.3% |
| Mar 2026 | 9.7% | 28.5% |
| Jun 2026 | 9.07% | 27.09% |
| Sep 2026 | 9.01% | 27.44% |
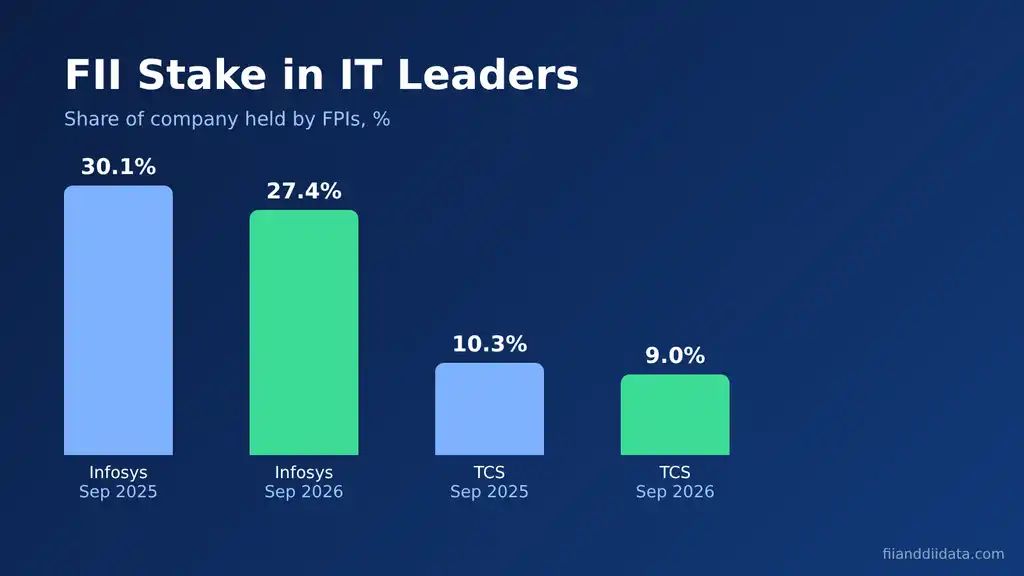
Over the year to September 2026, the FPI stake fell by about 1.3 percentage points in TCS and about 2.7 percentage points in Infosys. The biggest single drop came in the March 2026 quarter, which matches the February sell-off in the flow data. In the September 2026 quarter, Infosys saw a small rise from 27.09% to 27.44%, an early hint of the October buying.
Domestic investors filled part of the gap. In TCS, the DII stake rose from 12.7% in September 2025 to 13.6% in September 2026, based on the same filings. This mirrors what we saw in banks, which we discussed in our piece on FII buying in banking stocks.
A lower stake does not always mean heavy selling, though. Prices also move the value of holdings, and that is where many readers get confused.
How to Read FII Selling IT Stocks Data: A Worked Example
Headlines often say foreign holdings in a sector “fell by ₹1 lakh crore”. That number mixes two things: shares actually sold, and the fall in price of the shares still held. Here is how to separate them using February 2026.
Splitting FII selling in IT stocks from the price fall
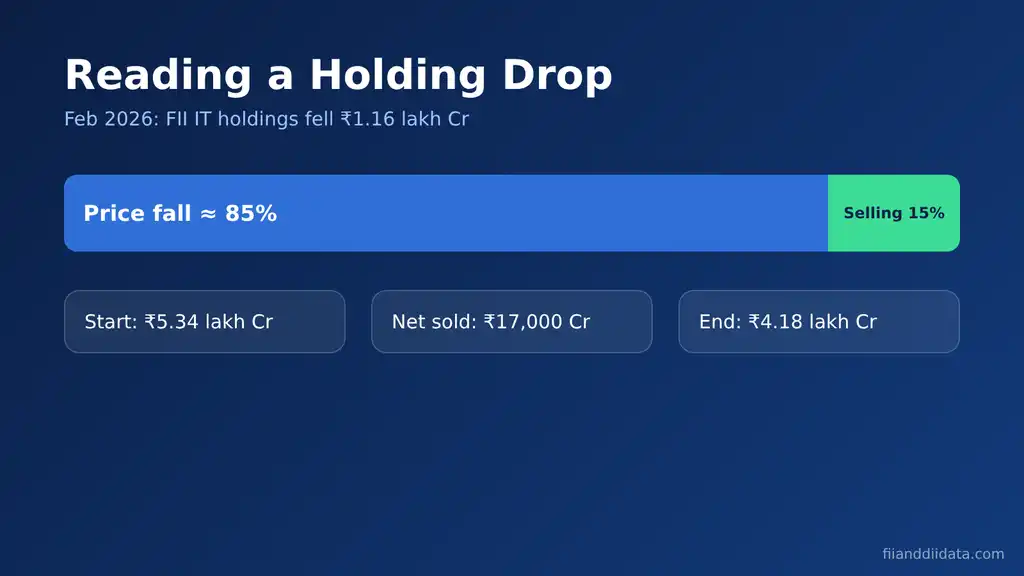
- Start value: FII holdings in IT at end-January 2026 = ₹5.34 lakh crore (₹5,34,000 crore).
- End value: FII holdings at end-February 2026 = ₹4.18 lakh crore (₹4,18,000 crore).
- Total fall: ₹5,34,000 crore minus ₹4,18,000 crore = ₹1,16,000 crore, or about 21.7%.
- Net selling: about ₹17,000 crore. That is roughly 14.7% of the total fall.
- Price effect: ₹1,16,000 crore minus ₹17,000 crore = about ₹99,000 crore, or roughly 85.3% of the fall.
The check is simple: the Nifty IT index fell about 20.8% in February 2026, close to the 21.7% drop in holding value. So most of the damage came from falling prices, while actual selling was about 3.2% of the opening holding. The split is approximate, since flows happen at different prices through the month.
The same method works in reverse. When IT recovered later in the year, rising prices and fresh buying both pushed holding values up, which is what happened in October.
What Changed in October 2026
The buying did not start overnight. SBI Securities, quoted by Business Standard, put cumulative FPI inflows into IT over the three and a half months to mid-October at ₹9,062 crore. What changed in October was the pace. The same report said the Nifty IT index rose 10.88% in the first half of October against 1.67% for the Nifty, and the value of FPI holdings in IT rose 11% in that fortnight.
Full-month numbers were stronger. The 5paisa sector note says the Nifty IT index gained 17.69% in October 2026 and closed at 32,606.90 on 30 October, its best monthly performance in more than six years. Q2 FY27 results also gave buyers something to point to:
- TCS: 0.5% sequential constant currency growth, 24.0% operating margin, deal wins (TCV) of $9.6 billion and an AI annualised revenue run rate of $3.1 billion.
- Infosys: 1.2% sequential growth, 21.0% operating margin, $5.2 billion in large deals and AI revenue up 29% from the previous quarter.
- HCLTech: 2.3% sequential growth, 18.2% EBIT margin and $3.26 billion in new deal wins.
Read together, the story shifted from “AI will destroy IT services” to “AI revenue is starting to show up”. Growth is still slow, so this is a recovery from very low positioning rather than a full return of confidence. A Samco Securities analyst quoted by Business Standard called the IT buying selective, not a broad move back into risk assets. That leads to the practical question of how to track what comes next.
How Investors Can Use This Data: A Checklist
Sector flow data is a context tool, not a trading signal on its own. Use this checklist each fortnight to judge whether foreign money is returning to IT or leaving again.
- Check the total first. Look at FII DII data today to see whether FIIs are net buyers or sellers across the market.
- Open the NSDL fortnightly sector file. Note the IT number and its rank among sectors. Being the top inflow while the overall market sees outflows is a stronger signal than a small inflow in a strong market.
- Look for two or more fortnights in a row. One good fortnight can be index rebalancing or a single block deal.
- Separate price from flow. Use the method above before reading too much into holding values.
- Match it with the quarterly stake. Rising FPI stake in TCS, Infosys and HCLTech in the December 2026 quarter would confirm the October flows.
- Watch the triggers. Deal wins, AI revenue disclosures, guidance changes and moves in US technology stocks all feed into foreign appetite for Indian IT.
Here are the reading errors we see most often.
Common Mistakes When Reading Sector Flow Data
- Treating holding value as selling. As the February example shows, about 85% of the fall in value came from prices.
- Mixing NSE and NSDL numbers. NSE daily data is provisional and covers all stocks. NSDL sector data is fortnightly and includes primary market deals. The two will not match exactly.
- Assuming every IT stock moves the same way. In the September 2026 quarter, FPI stake rose slightly in Infosys but slipped in TCS.
- Calling a bottom from one month. October 2026 was strong, but FPI stakes are still well below 2024 levels, and positioning can change quickly.
- Ignoring DII flows. Domestic funds raised their IT stakes through the selling phase, which cushioned prices. Always read both sides.
With those traps in mind, here are answers to the questions readers ask most about this topic.
FAQs
What is behind FII selling IT stocks in India?
FIIs sold Indian IT stocks mainly on fears that generative AI could reduce demand for outsourced software services, slow revenue growth of 1% to 2% for leaders like Infosys in FY27, a shift of AI-related money to chip makers in Korea and Taiwan, and broad FPI outflows from India in 2026.
How much did FIIs sell in IT stocks in February 2026?
FIIs sold nearly Rs 17,000 crore of Indian IT stocks in February 2026, about Rs 11,000 crore in the first half and Rs 5,993 crore in the second half, according to NSDL data reported by 5paisa and Angel One.
Are FIIs buying IT stocks again?
Yes, in October 2026 IT was the top sector for FPI inflows, with a net Rs 13,514 crore for the month based on NSDL fortnightly data. One strong month does not confirm a trend, so watch the next few fortnights and the December 2026 quarter shareholding.
What is the FII holding in TCS and Infosys?
At the end of September 2026, FPIs held 9.01% of TCS and 27.44% of Infosys, according to company shareholding filings. Both are lower than a year earlier, when the stakes were 10.3% and 30.1%.
Where can I check sector-wise FII data?
NSDL publishes fortnightly FPI investment data by sector on its FPI Monitor website. For daily market-wide figures, NSE releases provisional FII and DII cash market data around 6 PM IST on trading days.
The Bottom Line
FII selling in Indian IT was driven by real worries about AI, slow growth and a broad retreat from India, and it pushed foreign holdings in the sector to a four-year low in February 2026. Most of the fall in holding value, though, came from lower prices rather than from selling alone.
October 2026 showed that foreign money can return quickly when results and AI revenue improve. Positioning is still light, which leaves room for more buying, but growth remains slow and the trend needs confirmation. As a next step, track the next two NSDL fortnightly releases and the December 2026 quarter shareholding before drawing firm conclusions. You can find more flow analysis on our blog.
Sources: Business Standard (22 October 2026); Angel One (6 November 2026); 5paisa (6 March 2026); Trendlyne shareholding data; 5paisa IT stocks outlook (updated 3 November 2026); Business Standard (23 February 2026).
Disclaimer: This article is for educational purposes only and is not investment advice. Please consult a SEBI-registered advisor before making investment decisions.