The FII selling sectors 2026 list is led by financial services, followed by oil and gas, autos, IT and FMCG. Foreign portfolio investors (FPIs) pulled ₹3.04 lakh crore out of Indian equities this year up to 11 October 2026, and banks and financial companies alone saw more than ₹91,000 crore of selling in the first four months. This guide breaks the exit down sector by sector using NSDL data.
Key Takeaways
- Financial services is the largest FII selling sector of 2026, with over ₹91,000 crore sold from January to April alone.
- Oil and gas, autos, IT and FMCG complete the top five sectors FPIs exited in 2026.
- In September 2026, FPIs sold ₹13,147 crore of financial stocks but bought consumer services, services and healthcare.
- In 1 to 15 October 2026, FPIs sold 19 of 24 sectors, yet bought ₹2,599 crore of IT stocks.
- Raw rupee flows mislead; scale each sector’s selling by its FPI holdings before drawing conclusions.
Table of contents
- What sector-wise FII data means
- Top FII selling sectors in 2026
- Financial services: the biggest exit
- Latest data: September and October 2026
- Sectors FIIs bought in 2026
- Why FIIs sold these sectors
- How to read FII selling sectors data
- Common mistakes and a checklist
- FAQ
- The Bottom Line
What Sector-Wise FII Data Means
The daily FII DII data today tells you how much foreign investors bought or sold in total. It does not tell you which stocks or industries they sold. For that, you need the sector-wise report from NSDL (National Securities Depository Limited), the depository that tracks FPI holdings in India.
NSDL publishes this report every fortnight, for the 1st to 15th and the 16th to the month end. It shows two numbers for each of about two dozen sectors: the net equity investment during the fortnight and the assets under custody (AUC), which is the market value of everything FPIs hold in that sector. A negative flow means FPIs sold more than they bought.
Because the data is fortnightly and based on settled trades, it lags the daily exchange figures. That is also why sector totals rarely match NSE provisional numbers exactly, a gap we explain in our note on why NSE and NSDL numbers differ. With that in mind, here is where the money left.
Top FII Selling Sectors in 2026
NSDL figures compiled by NiftyTrader (published 25 June 2026) show how lopsided the selling was in the first four months of the year. Four sectors accounted for about ₹1.7 lakh crore of outflows between January and April 2026.
| Sector | FPI net selling, Jan to Apr 2026 |
|---|---|
| Financial services | Over ₹91,000 crore |
| Oil, gas and consumable fuels | About ₹36,000 crore |
| Information technology | ₹24,870 crore |
| Automobiles and auto components | ₹17,985 crore |
FMCG was the fifth regular name on the sell list. Angel One’s NSDL-based reports show FPIs sold ₹3,205 crore of FMCG stocks in April, ₹3,561 crore in May and ₹5,063 crore in the first half of June 2026. In early October, FMCG selling jumped to ₹8,172 crore in a single fortnight.
How the FII selling sectors 2026 list compares with the total exit
Business Standard (PTI, 11 October 2026) put total 2026 FPI equity outflows at ₹3.04 lakh crore, against ₹1.66 lakh crore for all of 2025. The secondary market selling was even larger, at ₹3.64 lakh crore through 12 October, because FPIs put ₹56,485 crore into IPOs over the same period (Angel One, 13 October 2026). So the sector tables capture exchange selling that was partly offset by primary market buying. Our month-wise FPI outflow in 2026 page tracks the headline total.
Financial Services: The Biggest FII Selling Sector of 2026
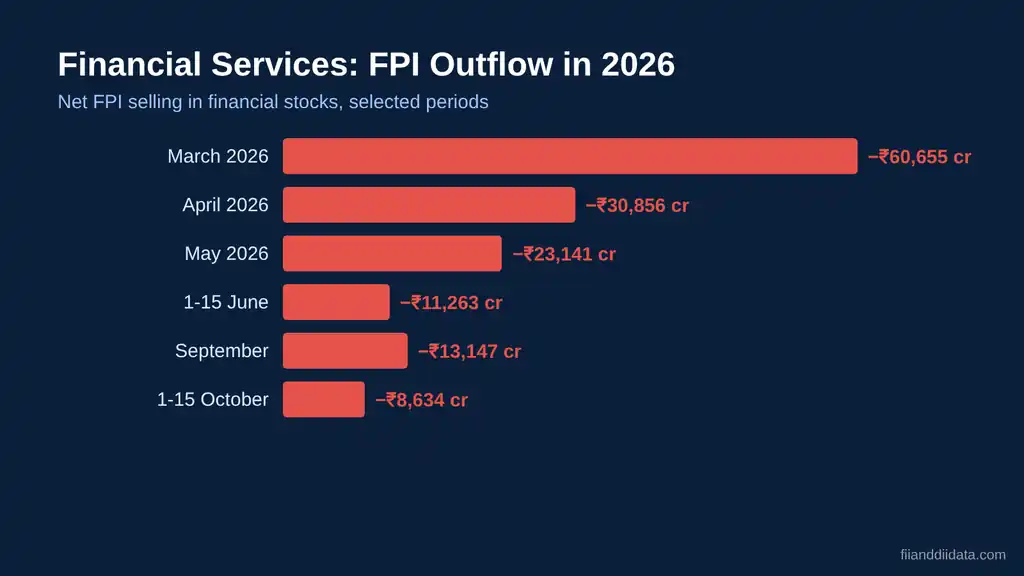
Banks, NBFCs and insurers carried the heaviest load all year. The table below tracks FPI net flows in financial services across the periods for which NSDL sector figures were reported.
| Period (2026) | Financial services net FPI flow |
|---|---|
| March | −₹60,655 crore |
| April | −₹30,856 crore |
| May | −₹23,141 crore |
| 1 to 15 June | −₹11,263 crore |
| 1 to 15 August | +₹6,535 crore (approx.) |
| September | −₹13,147 crore |
| 1 to 15 October | −₹8,634 crore |
March and April together saw ₹91,511 crore of financial stocks sold, which is most of the year’s damage to the sector. In April, financials made up 50.5% of the entire FPI outflow ($3.28 billion out of $6.49 billion, per Finnovate). The pace then slowed, and FPIs briefly turned buyers in the first half of August when overall flows turned positive.
There is a simple reason financials dominate. As of 30 September 2026, financial services made up about $208.5 billion, or roughly 30%, of the $689.4 billion of Indian equities held by FPIs (Finnovate, 7 October 2026). When a foreign fund cuts its India weight, it sells what it owns most. Next, we look at the latest fortnightly numbers.
Latest Sector Data: September and October 2026
September 2026 brought a net FPI outflow of ₹35,861 crore. The five largest sellers accounted for ₹32,630 crore, or 91% of the net figure. Six sectors still drew foreign money.
| Sector | September 2026 | 1 to 15 October 2026 |
|---|---|---|
| Financial services | −₹13,147 crore | −₹8,634 crore |
| Oil, gas and consumable fuels | −₹6,854 crore | Not in top five |
| Automobiles and auto components | −₹6,212 crore | −₹6,533 crore |
| Telecommunication | −₹3,414 crore | −₹3,928 crore |
| FMCG | −₹3,001 crore | −₹8,172 crore |
| Healthcare | +₹2,117 crore | −₹5,597 crore |
| Information technology | −₹998 crore | +₹2,599 crore |
| Consumer services | +₹2,333 crore | Not reported |
| Total net flow | −₹35,861 crore | −₹47,955 crore |
The first half of October was broader and harsher. FPIs were net sellers in 19 of 24 sectors, and the top five outflow sectors made up 68.5% of the ₹47,955 crore total. FMCG selling jumped more than eight times from the late-September fortnight, and healthcare swung from buying to ₹5,597 crore of selling. IT was the one large sector that drew money.

Sectors FIIs Bought in 2026
Even in a record selling year, foreign investors rotated rather than simply exited. The buying pockets shifted every few months:
- April 2026: Power (+$584 million), capital goods (+$455 million) and metals (+$126 million) drew money while financials were sold (Finnovate).
- May 2026: Services (+₹7,204 crore), metals and mining (+₹6,697 crore) and capital goods (+₹2,799 crore) led inflows (Angel One, 4 June 2026).
- 1 to 15 August 2026: A broad buying fortnight of about ₹16,621 crore, led by financials, autos and consumer services (Finnovate, 24 August 2026).
- September 2026: Consumer services (+₹2,333 crore), services (+₹2,302 crore), healthcare (+₹2,117 crore) and construction (+₹1,311 crore).
- 1 to 15 October 2026: IT (+₹2,599 crore) was the main buy.
The pattern matters. Sectors with domestic demand stories, such as services and capital goods, attracted money in spring, while defensives like healthcare flipped from buy to sell within a month. A single fortnight of buying in one sector is not a trend. The next question is why the selling hit these particular sectors.
Why FIIs Sold These Sectors in 2026
The broad drivers are macro, not sector specific. In an 11 October 2026 PTI report, Geojit’s VK Vijayakumar pointed to US 10-year yields above 5.2%, while analysts also cited high crude oil prices, a firmer dollar and an AI-led rally in cheaper North Asian markets. We cover these in detail in why FIIs are selling Indian stocks. Here is how each driver maps to sectors:
- Financials: They are the biggest FPI holding, so any India-wide cut lands here first. They are also the most liquid way to exit in size.
- Oil and gas: High crude raises input costs for refiners and marketers and widens India’s import bill. Our note on how crude oil affects FII flows explains this link.
- Autos and FMCG: Both depend on fuel, raw material costs and rural demand, and both trade at high valuations that leave little room for earnings misses.
- IT: Dollar earners should gain from a weak rupee, yet FPIs sold ₹24,870 crore by April as global funds moved toward the AI-led rally in North Asian markets.
Knowing the reasons helps, but traders need a way to judge whether a sector’s selling is big or small. That is what the next section covers.
How to Read FII Selling Sectors Data
Raw rupee figures always make financials look worst because FPIs own so much of them. A better measure is selling as a share of holdings. Divide the fortnight or monthly outflow by the sector’s AUC.
Worked example: September 2026 selling as a share of holdings
We use the NSDL AUC as of 31 July 2026 (reported by Craytheon) as an approximate base, since it is the latest complete sector AUC set we could verify:
| Sector | September 2026 outflow | AUC on 31 July 2026 | Outflow as % of AUC |
|---|---|---|---|
| Financial services | ₹13,147 crore | ₹21,12,990 crore | 0.62% |
| Automobiles | ₹6,212 crore | ₹5,39,613 crore | 1.15% |
| Telecommunication | ₹3,414 crore | ₹3,71,839 crore | 0.92% |
| Oil, gas and fuels | ₹6,854 crore | ₹4,68,589 crore | 1.46% |
In rupees, financials lost twice as much as oil and gas. Relative to holdings, oil and gas was sold more than twice as hard (1.46% against 0.62%). This tells you foreign funds were actively cutting energy exposure, while the financials figure was closer to a proportional trim.
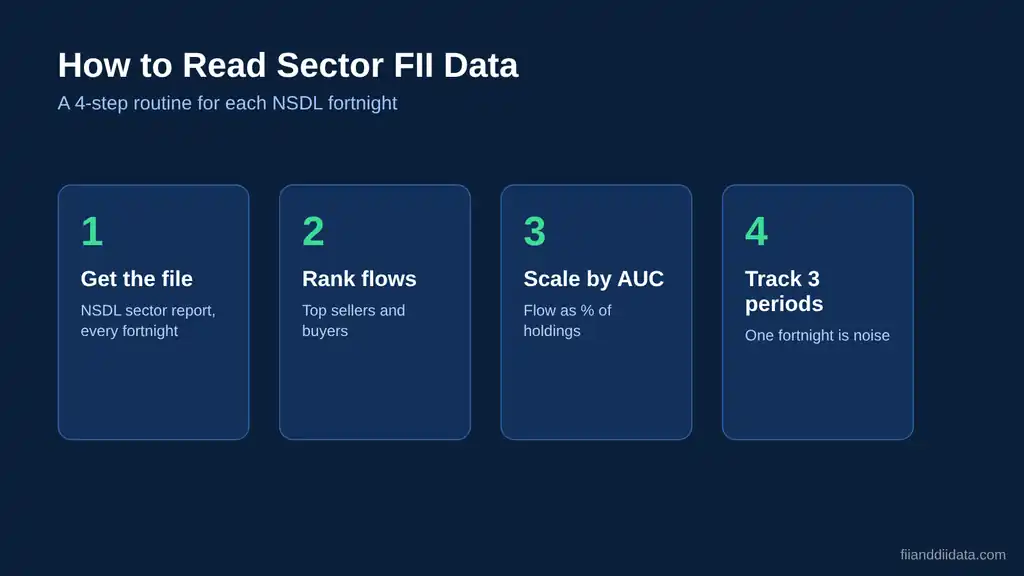
Use this four-step routine each fortnight:
- Open the NSDL fortnightly sector report after the 15th and the month end.
- Rank sectors by net flow and note the top five sellers and buyers.
- Divide each flow by that sector’s AUC to compare like with like.
- Compare with the previous two fortnights. Three periods in one direction is a trend; one is noise.
Common Mistakes and a Sector Flow Checklist
Sector flow data is easy to misread. These are the errors we see most often:
- Treating sector selling as stock selling. A ₹13,000 crore sector outflow can come from a few large names while others in the sector see buying.
- Mixing NSE and NSDL totals. Sector data comes from NSDL; daily cash data comes from NSE. Do not add or compare them directly.
- Ignoring the primary market. Large IPO allocations, such as anchor books, show up as inflows and can hide secondary market selling.
- Reading one fortnight as a turn. Healthcare went from +₹2,117 crore in September to −₹5,597 crore in early October.
- Forgetting DII buying. Domestic funds absorbed much of the selling, so heavy FPI exits did not always mean falling prices. See our monthly FII DII data for the offset.
Quick checklist before acting on sector FPI data:
- Is the selling at least three fortnights in a row?
- Is the outflow above 1% of the sector’s AUC?
- Are DIIs and mutual funds also selling, or are they buying the same sector?
- Has the sector index already fallen enough to price in the selling?
- Does the macro driver (crude, yields, dollar) still point the same way?
FAQ
What are the top FII selling sectors in 2026?
Financial services is the largest FII selling sector of 2026, with over ₹91,000 crore sold between January and April alone. Oil and gas, IT, autos and FMCG complete the top five, based on NSDL fortnightly sector data.
Where can I find sector-wise FII data in India?
NSDL publishes fortnightly sector-wise FPI investment data on its FPI Monitor website, for the 1st to 15th and the 16th to month end. It shows net investment and assets under custody for each sector.
Why are FIIs selling banking and financial stocks?
Financials are about 30% of FPI equity holdings in India, so any overall cut hits them first. High US bond yields, a strong dollar and a weak rupee in 2026 pushed foreign funds to reduce India exposure, and banks are the most liquid way to sell in size.
Which sectors did FIIs buy in 2026?
FPIs bought power, capital goods and metals in April and May 2026, consumer services, services and healthcare in September, and IT worth ₹2,599 crore in the first half of October 2026.
Does FII selling in a sector mean its stocks will fall?
Not always. Domestic institutions often absorb the selling, and a sector outflow can come from a few large stocks. Check if the selling lasts three or more fortnights and is large relative to holdings before drawing conclusions.
The Bottom Line
Financial services, oil and gas, IT, autos and FMCG carried most of the 2026 foreign exit. Financials topped the list in rupee terms mainly because FPIs own so much of them, while oil and gas saw heavier selling relative to holdings. Pockets such as services, capital goods, metals and, more recently, IT still drew foreign money.
Sector flows are a useful map of where foreign money is moving, but they are not timing signals on their own. As a next step, check the NSDL report after each fortnight, scale the flows by AUC and compare them with the daily FII and DII data before changing any sector bets. You can find more guides on our blog.
Sources: NSDL fortnightly sector-wise FPI data; Business Standard (PTI), 11 October 2026; Finnovate, September 2026 sector flows; Angel One, May 2026 sector flows; IPO Watch (24 October 2026); NiftyTrader (25 June 2026); Craytheon sector flow charts.
Disclaimer: This article is for educational purposes only and is not investment advice. Please consult a SEBI-registered advisor before making investment decisions.