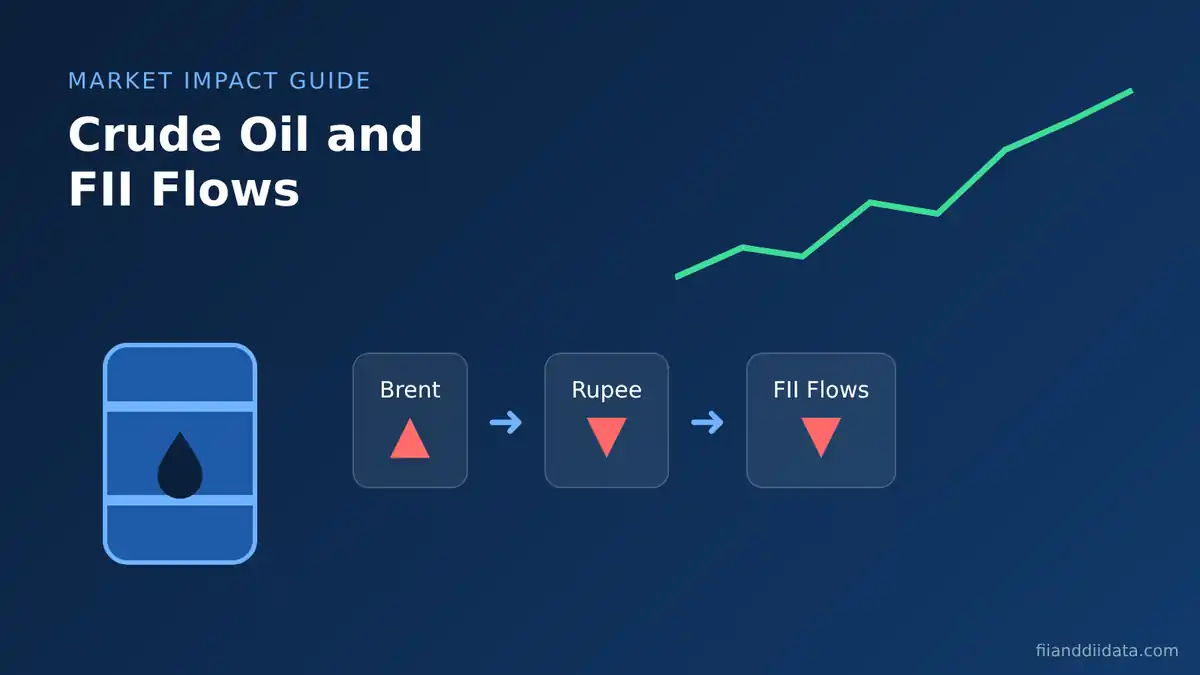
The crude oil impact on FII flows is simple to state: when Brent crude rises sharply, foreign investors usually sell Indian stocks, and when it cools, they often return. October 2026 shows it clearly. Brent December futures climbed from $100.20 on 7 October to $116.72 on 23 October, and FPIs sold a net ₹53,337 crore of Indian equities in the month to 23 October. This guide explains why, with data, a worked example and a checklist.
Key Takeaways
- India imported 88.6% of its crude oil needs in FY26 (to January 2026), so oil prices hit its trade balance and currency directly.
- Costlier oil widens the current account deficit, weakens the rupee and cuts the dollar return of foreign investors.
- Brickwork Ratings estimates every $10 rise in oil widens the CAD by about 50 basis points of GDP.
- The record FPI sale of ₹1,17,775 crore in March 2026 came as crude moved above $100 during the West Asia war.
- Watch Brent, the rupee and US yields together; oil alone rarely explains a full month of FII selling.
In this guide:
- What Is the Crude Oil Impact on FII Flows?
- Why Crude Oil Matters So Much for India
- How Crude Oil Reaches FII Flows: 6 Steps
- Latest Data: Brent and FPI Flows in October 2026
- What History Says: Crude Spikes and FPI Selling
- Sector Impact: Where FIIs Cut and Where They Hold
- How to Track the Crude Oil Impact on FII Flows
- Common Mistakes When Reading Oil and FII Data
- FAQs
- The Bottom Line
What Is the Crude Oil Impact on FII Flows?
Foreign institutional investors (FIIs), now officially called foreign portfolio investors (FPIs), buy and sell Indian shares through the stock exchanges. Their net buying or selling each day is what we call FII flows. You can follow these numbers on our FII and DII data page, which updates after the NSE provisional release around 6 PM IST on trading days.
Crude oil affects these flows because India buys most of its oil from abroad and pays for it in US dollars. When oil gets expensive, India needs more dollars, the rupee tends to weaken and inflation risk goes up. A foreign fund that measures returns in dollars sees two hits at once: possible stock price falls and a weaker currency. So it trims exposure to India, or at least stops adding.
The link is not one-to-one. A heavy FII sale on a day when Brent jumps may also reflect US bond yields or a block deal. Oil is one strong input, not the only one. To see why it carries so much weight, start with India’s oil imports.
Why Crude Oil Matters So Much for India
India is one of the most import-dependent large oil consumers. In a written reply in the Rajya Sabha reported on 11 March 2026, the Minister of State for Petroleum said import dependence was 88.2% in FY25 and 88.6% in FY26 up to January 2026. In other words, close to nine of every ten barrels India refines come from overseas.
That dependence shows up in the balance of payments. The RBI data released on 1 September 2026 showed the current account deficit (CAD) for April to June 2026 widened to $4.2 billion, or 0.5% of GDP, from $3.4 billion a year earlier. The merchandise trade deficit rose to $86.1 billion from $68.9 billion, and economists linked part of the gap to higher commodity prices, as Business Standard reported.
The same RBI release showed portfolio investment recorded a $9.6 billion outflow in that quarter, against a $1.6 billion inflow a year earlier. A wider CAD and portfolio outflows together pushed the overall balance of payments to an $8.1 billion deficit. That is the macro backdrop behind every rupee move. Next, let us trace the exact path from an oil price spike to an FII sell order.
How Crude Oil Reaches FII Flows: 6 Steps
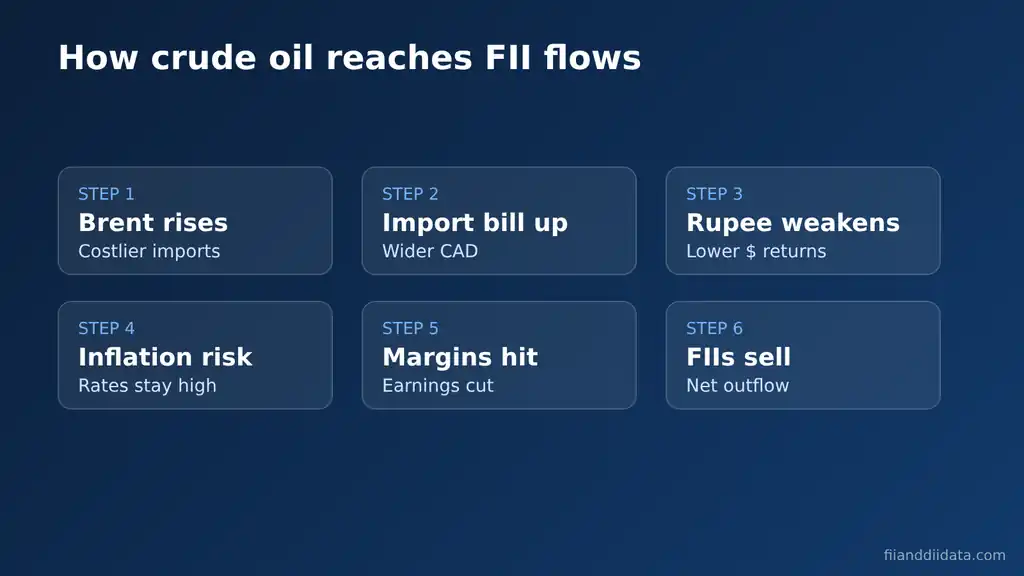
- Brent rises. Supply fears, such as attacks on Gulf facilities or shipping lanes, push the global benchmark higher.
- The import bill goes up. India pays more dollars for the same barrels, so the trade and current account deficits widen.
- The rupee weakens. Extra dollar demand from oil importers pressures the currency, and FPI selling adds to it.
- Inflation risk rises. Fuel, freight and input costs climb, which makes the RBI less likely to cut rates.
- Company margins shrink. Oil marketing, paints, aviation and chemical firms face higher costs, and analysts cut earnings estimates.
- FIIs sell. Lower expected dollar returns and earnings downgrades lead foreign funds to reduce India weight.
Steps 3 and 6 feed each other. When FPIs sell, they convert rupees to dollars, which weakens the rupee further and can trigger more selling. This loop is why oil shocks often cause bursts of heavy FII selling rather than a slow drip.
How to Estimate the Crude Oil Impact on FII Flows: A Worked Example
Take a hypothetical foreign fund that invests $100 million in Nifty stocks when the rupee is at ₹92 per dollar. Its rupee investment is ₹920 crore. Now assume an oil spike pushes the Nifty down 5% and the rupee weakens 3% to ₹94.76.
| Item | Calculation | Result |
|---|---|---|
| Rupee value after a 5% Nifty fall | ₹920 crore × 0.95 | ₹874 crore |
| New exchange rate | ₹92 × 1.03 | ₹94.76 per $ |
| Dollar value | ₹874 crore ÷ ₹94.76 | $92.23 million |
| Loss in dollar terms | ($92.23m ÷ $100m) – 1 | -7.77% |
An Indian investor sees a 5% loss. The foreign fund sees a 7.77% loss because the currency adds 2.77 percentage points of damage. That gap is the main reason oil shocks hurt FII flows more than DII flows. Domestic funds such as mutual funds and insurers measure returns in rupees, so they often buy when FIIs sell.
You can apply the same logic at the macro level. Brickwork Ratings estimated in March 2026 that every $10 rise in oil widens the CAD by about 50 basis points of GDP. Brent rose $16.52 between 7 and 23 October 2026, which, if sustained, works out to roughly 0.8% of GDP using that rule of thumb. Here is what the actual October data shows.
Latest Data: Brent and FPI Flows in October 2026
| Date (2026) | Brent Dec futures settle ($/bbl) | What moved it |
|---|---|---|
| 7 Oct | 100.20 | Month low; IEA members backed faster stock release |
| 16 Oct | 109.86 | Attacks cut Hormuz crude flows to about 8.5 million bpd |
| 20 Oct | 108.79 | Houthi claims on Aramco sites; intraday high $111.99 |
| 21 Oct | 108.82 | Drone attack on Shaybah reported |
| 22 Oct | 113.17 | Aramco evacuated Dhahran headquarters |
| 23 Oct | 116.72 | Month peak; highest close since 29 April |
| 26 Oct | 115.81 | Saudi, Pakistani and Turkish officials met in Tehran |
| 27 Oct | 113.88 | Fire reported near Ras Tanura |
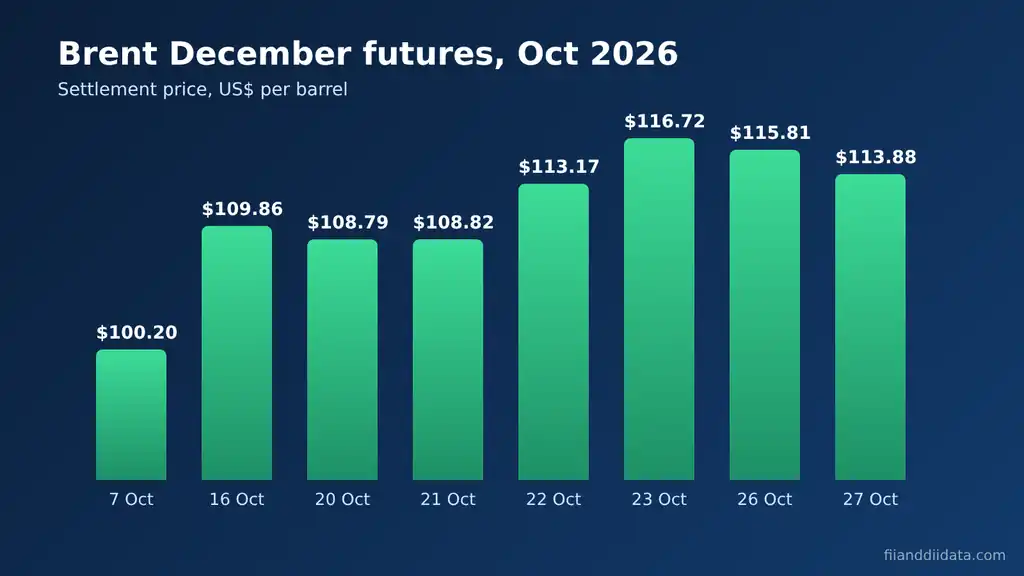
Over the same period, FPIs sold a net ₹53,337 crore of Indian equities through the exchanges in October up to 23 October, while putting ₹5,281 crore into IPOs, according to IANS on 25 October 2026. Geojit’s VK Vijayakumar put total FPI selling through the exchanges in 2026 at ₹3,69,164 crore. FIIs were net sellers for the tenth straight week, and analysts named $100 Brent as a key threshold.
The picture was not one-way. In the week to 23 October, FIIs cut their selling and turned buyers on two days, as the US 10-year yield eased from 5.36% to about 5% and the rupee firmed to 94.94 per dollar. On 28 October, with Brent back above $115 after a reported strike on Saudi Arabia’s largest refinery, FIIs still bought a net ₹871.80 crore as per NSE provisional data. That mix is a reminder that yields and the rupee can offset oil for a few sessions. For the day-by-day numbers, see our FII DII data today page. History shows how far this pattern can run.
What History Says: Crude Spikes and FPI Selling
| Period | Oil backdrop | FPI equity flow |
|---|---|---|
| Calendar 2022 | Volatile oil, Russia-Ukraine war, Fed hikes | Net outflow of about ₹1.21 lakh crore, then a record |
| March 2026 | Crude above $100 during the West Asia war | Net outflow of ₹1,17,775 crore, biggest month on record |
| 15 June 2026 | Brent fell over 5% after a US-Iran deal | FIIs turned net buyers (₹200 crore) after 11 selling sessions |
| 1 to 23 October 2026 | Brent rose from $100.20 to $116.72 | Net outflow of ₹53,337 crore via exchanges |
Two lessons stand out. First, the largest selling phases come when an oil shock arrives with something else, such as US rate hikes in 2022. That year, FPIs pulled out about ₹1.21 lakh crore, beating the 2008 outflow of ₹53,000 crore, as Business Standard reported. Second, the reversal can be quick. On 15 June 2026, a 5% drop in Brent was enough to end an 11-session FII selling streak, according to Angel One.
March 2026 is the clearest case. NSDL data reported by The Tribune showed FPIs sold ₹1,17,775 crore that month as crude crossed $100 and the rupee fell about 4% from the start of the war. For the full year picture, read our breakdown of FPI outflow in 2026. Not every sector suffers equally in these phases, which is where stock pickers find their edge.
Sector Impact: Where FIIs Cut and Where They Hold
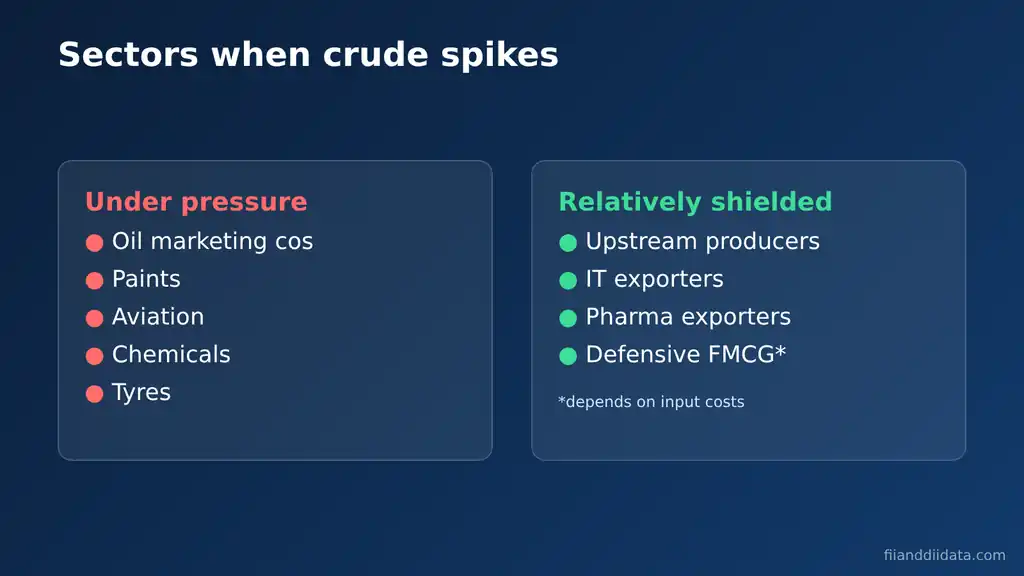
When oil spikes, foreign funds tend to reduce holdings in businesses that use crude as a direct input or cannot pass costs on quickly. The usual list includes oil marketing companies, paints, aviation, chemicals, tyres and logistics. Reports on the 28 October Brent move named aviation, paints, chemicals, logistics and oil marketing as the most exposed.
On the other side, upstream oil producers earn more per barrel, and IT and pharma exporters gain from a weaker rupee because they earn in dollars. These sectors are relatively shielded. This is a general pattern, not a rule: a paint maker with strong pricing power may hold up better than a weak exporter, so check the latest shareholding data before assuming FIIs are exiting a stock. The next section turns this into a weekly routine.
How to Track the Crude Oil Impact on FII Flows
- Check Brent. Note the weekly close and whether it is above or below $100, the level analysts flagged in October 2026.
- Check the rupee. A sharp weekly fall in the rupee often comes with heavier FII selling, as in March 2026.
- Check US yields. Oil and yields often move together; read our guide on US bond yield impact on the Indian market.
- Check FII cash flows. Compare the week’s net figure with the prior four weeks on our monthly FII DII data page.
- Check DII absorption. If DIIs buy more than FIIs sell, the index impact is usually smaller.
- Check sector moves. If oil-sensitive sectors fall more than the Nifty, oil is the main driver that week.
If Brent, the rupee and FII flows all move against India in the same week, oil is likely the lead factor. If only one moves, look for another cause, such as a large block deal or index rebalancing. Even with a checklist, a few errors are common.
Common Mistakes When Reading Oil and FII Data
- Blaming oil for every sale. In 2026, US yields above 5%, the RBI stance and valuations also drove selling. Our analysis of crude-driven FII selling and other causes covers the full list.
- Using one day of data. A single session can swing on a block deal. Use at least a week.
- Mixing NSE and NSDL figures. NSE provisional data and NSDL FPI data differ in scope and timing; compare like with like.
- Ignoring the rupee. Oil hurts FII returns mainly through the currency, so a stable rupee can soften the effect.
- Expecting intraday signals. FII figures come after market close, so they explain moves; they do not predict the next candle.
- Forgetting the base effect. A $10 rise from $60 is a 17% jump; from $110 it is about 9%. The percentage change matters for inflation.
The broader market story of 2026 is covered in our piece on the reasons behind the Nifty fall in 2026. Below are quick answers to the questions readers ask most.
Frequently Asked Questions
What is the crude oil impact on FII flows in India?
When crude oil prices rise, India’s import bill grows, the rupee tends to weaken and inflation risk rises. This lowers the dollar returns of foreign investors, so FIIs usually sell Indian equities. When oil falls, the pressure eases and FIIs often return, as seen on 15 June 2026.
Why do FIIs sell Indian stocks when oil prices rise?
India imported about 88.6% of its crude needs in FY26 to January 2026. Higher oil widens the current account deficit and weakens the rupee, which cuts the dollar value of a foreign fund’s holdings even if share prices hold steady.
Does a fall in crude oil bring FIIs back to India?
Often, but not always. On 15 June 2026, a 5% drop in Brent helped FIIs turn net buyers after 11 selling sessions. Lasting inflows also need stable US yields, a firm rupee and reasonable valuations.
Which sectors do FIIs sell when crude prices rise?
FIIs usually reduce holdings in oil-sensitive sectors such as oil marketing companies, paints, aviation, chemicals and tyres. Exporters like IT and pharma, and upstream oil producers, tend to be less affected.
How much does a $10 rise in crude oil affect India’s current account deficit?
Brickwork Ratings estimated in March 2026 that every $10 per barrel rise in oil widens India’s current account deficit by about 50 basis points of GDP. The actual effect depends on how long prices stay high and on the rupee.
The Bottom Line
Crude oil is one of the strongest outside forces on foreign money in Indian stocks. Because India imports close to 89% of its oil, a Brent spike widens the current account deficit, weakens the rupee and cuts the dollar returns of FIIs. The record ₹1,17,775 crore sale in March 2026 and the ₹53,337 crore outflow in October up to the 23rd both came with crude above $100.
Still, oil works alongside US yields, the rupee and valuations, and quick reversals are possible when Brent cools. A practical next step is to run the six-point weekly checklist above every Friday and note how Brent, the rupee and FII flows moved together. More guides are in our FII DII blog.
Sources: Oil & Gas Middle East, Brent price drivers, October 2026; HDFC Sky, Brent crude price, 28 October 2026; IANS, FPI selling in October, 25 October 2026; Business Standard, Q1 FY27 current account data, 1 September 2026; The Tribune citing NSDL, March 2026 FPI outflows, 5 April 2026; Business Standard, FPI outflows in 2022, 28 December 2022; Kashmir Life, Rajya Sabha reply on crude import dependence, 11 March 2026; IANS, Brickwork Ratings report, 21 March 2026; Angel One, FII flows on 15 June 2026; NSE provisional FII DII data, 28 October 2026.
Disclaimer: This article is for educational purposes only and is not investment advice. Please consult a SEBI-registered advisor before making investment decisions.