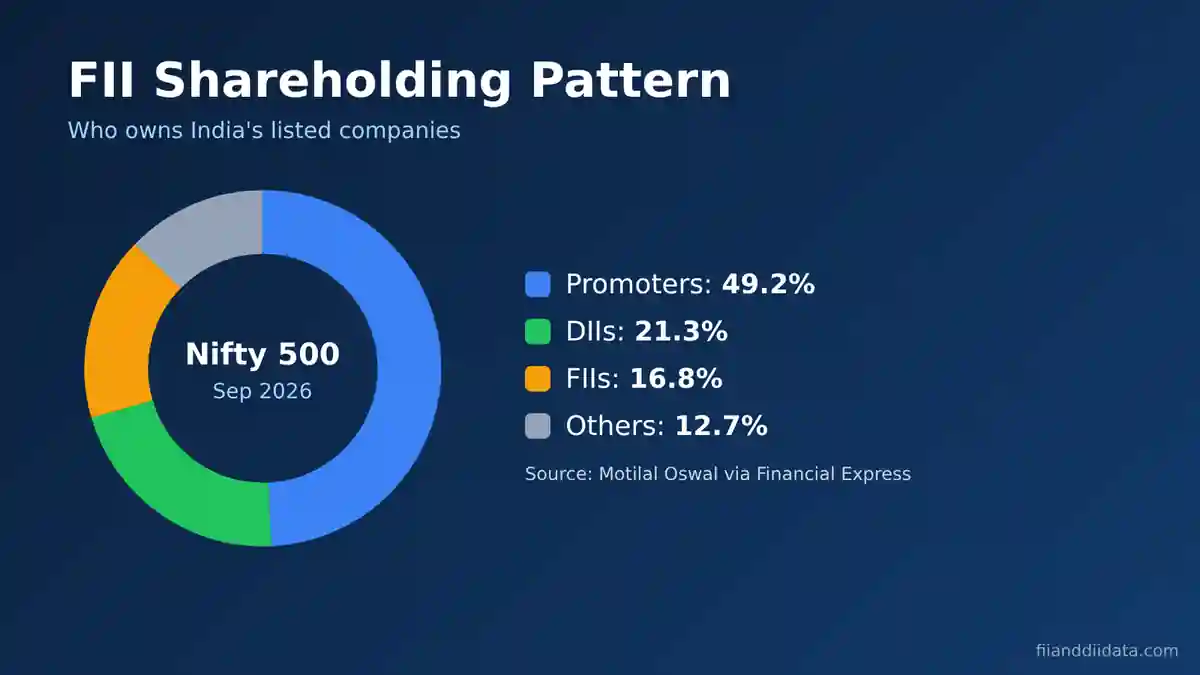
The FII shareholding pattern shows how much of a listed company foreign institutional investors own, and it is updated every quarter in the company’s filing with NSE and BSE. It matters right now because foreign ownership is shrinking: FIIs held 16.8% of Nifty 500 companies in September 2026, while domestic institutions held a record 21.3%. This guide shows where to find the number, how to read it and how to use it.
Key Takeaways
- FII holding sits under “Institutions (Foreign)” in the public shareholding table, split into FPI Category I and Category II.
- Listed companies must file the pattern within 21 days of each quarter end under SEBI LODR Regulation 31.
- FIIs owned 16.8% of the Nifty 500 in September 2026, down 170 basis points in a year; DIIs owned a record 21.3%.
- A single FPI must stay below 10% of a company’s paid-up capital; all FPIs together are capped at the sectoral limit.
- Read the trend over four quarters, not one number, and always check whether the stock price agrees.
In this guide
- What Is the FII Shareholding Pattern?
- Where FIIs Appear in a Shareholding Pattern
- Why FII Holding Matters to Investors
- FII Shareholding Pattern Data: September 2026
- How to Check the FII Shareholding Pattern of a Stock
- Worked Example: Reading a Quarterly FII Stake Change
- Common Mistakes When Reading FII Holding
- FAQs
- The Bottom Line
What Is the FII Shareholding Pattern?
A shareholding pattern is a table that breaks a company’s equity into owner groups: promoters, domestic institutions, foreign institutions, retail investors and others. The FII figure is the foreign institutional slice of that table. It tells you what percentage of the company’s shares sits with overseas pension funds, mutual funds, sovereign funds, insurers and similar investors.
In official filings you will rarely see the word “FII”. Since SEBI’s 2014 rules, these investors register as Foreign Portfolio Investors (FPIs), so the filing uses FPI labels. Market talk still says FII, and both terms point to the same money. Our explainer on FII vs FPI and the SEBI categories covers that change in detail.
How it differs from daily FII flow data
Daily flow data shows how much FIIs bought or sold across the whole market on one day. The shareholding pattern shows how much of one company they own at the end of a quarter. Flows are a speedometer; holding is the odometer. You need both. For the daily side, our FII DII data today page tracks the NSE provisional numbers released after market close.
Next, let us see exactly where these investors sit inside the filing.
Where FIIs Appear in a Shareholding Pattern
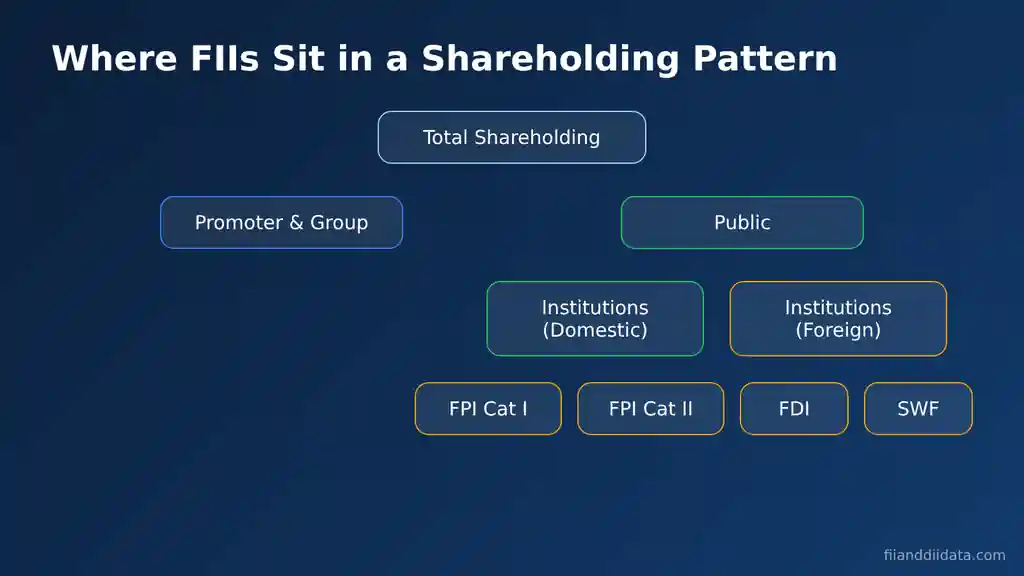
Every listed company files the pattern in a SEBI-prescribed format. The top split is “Promoter and Promoter Group” versus “Public”. FIIs are almost always part of the Public category, inside the institutional block.
SEBI’s circular of 30 June 2022 (SEBI/HO/CFD/PoD-1/P/CIR/2022/92), effective from the quarter ended 30 September 2022, split institutions into “Institutions (Domestic)” and “Institutions (Foreign)”. The foreign block includes these rows:
- Foreign Portfolio Investors Category I: lower-risk, regulated investors such as sovereign funds, central banks and regulated pension or mutual funds.
- Foreign Portfolio Investors Category II: other eligible foreign investors that do not meet Category I tests.
- Foreign Direct Investment: strategic foreign holders that are not portfolio investors.
- Sovereign wealth funds: shown separately where applicable.
To get the total FII holding, add the FPI Category I and Category II rows. Do not add the FDI row unless you are studying all foreign ownership, because strategic investors behave very differently from portfolio funds. The same circular also requires companies to name any public shareholder owning 1% or more, which lets you see the large foreign funds by name.
The foreign ownership limits table
The 2022 circular added a separate table (Table VI) that shows the board-approved foreign ownership limit and how much of it is used, as on the shareholding date and at the end of each of the previous four quarters. This is useful in banks and other capped sectors, where FIIs can run out of room to buy.
Knowing where the number sits is half the job. The other half is knowing why it deserves your attention.
Why FII Holding Matters to Investors
Foreign institutions manage large pools of money and run deep research teams. When their stake in a company rises over several quarters, it usually reflects a considered view on earnings, governance or valuation. A steady fall can signal the opposite, or simply a shift of money to other countries.
- Liquidity: stocks with meaningful FII ownership tend to trade in larger volumes, which keeps spreads tight.
- Price pressure: when a high-FII stock sees sustained foreign selling, the stock can fall even if business news is fine.
- Index flows: FII-heavy stocks react more to global index rebalancing, US yields and the rupee.
- Headroom: in capped sectors, a stock near its foreign limit has fewer buyers left among FIIs.
The 2026 data shows why this matters. An Economic Times analysis published on 2 November 2026 found that 21 of the 50 Nifty stocks saw FII holding fall in each of the March, June and September 2026 quarters, and 18 of those 21 also fell in price during the year. To see how that selling shows up in daily flows, read our piece on the 2026 FPI outflow.
So what does the latest ownership picture look like? The numbers below answer that.
FII Shareholding Pattern Data: September 2026
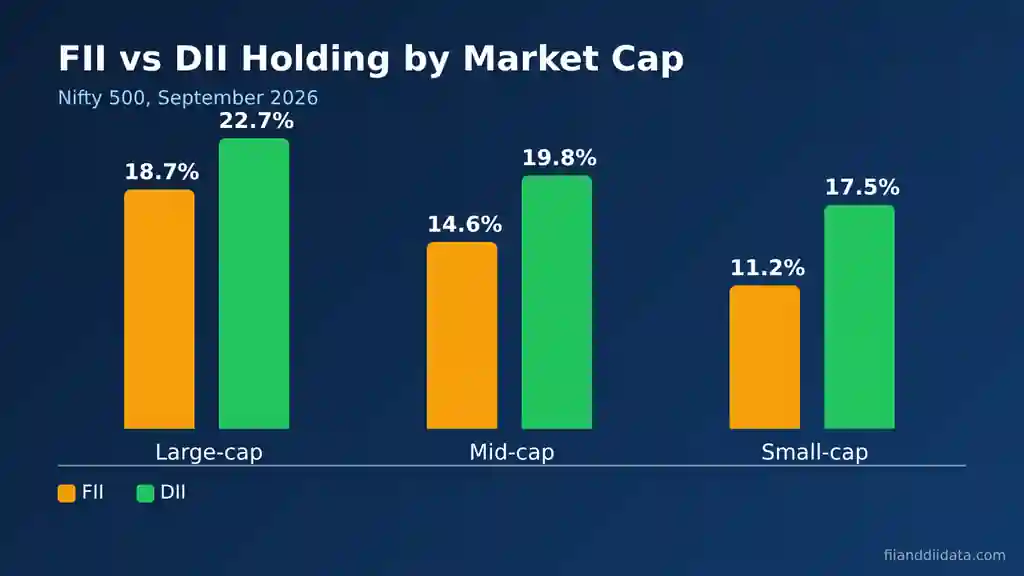
The September 2026 quarter filings confirmed a long trend: foreign ownership is falling and domestic institutions are filling the gap. According to Motilal Oswal’s October 2026 strategy report, as reported by Financial Express on 30 October 2026, FII holding in the Nifty 500 fell to 16.8%, down 170 basis points year on year and 20 basis points quarter on quarter. DII holding rose to a record 21.3%.
| Segment (September 2026) | FII holding | DII holding | Gap (DII minus FII) |
|---|---|---|---|
| Nifty 500 | 16.8% | 21.3% | 4.5 pts |
| Nifty 50 | 22.4% | 26.2% | 3.8 pts |
| Large-cap | 18.7% | 22.7% | 4.0 pts |
| Mid-cap | 14.6% | 19.8% | 5.2 pts |
| Small-cap | 11.2% | 17.5% | 6.3 pts |
Three points stand out. First, in the Nifty 50, FII holding fell from 24.7% to 22.4% over the year while DII holding rose from 24.7% to 26.2%, so the two groups were level a year ago. Second, the gap is widest in small caps, where FIIs have always been thin. Third, private banks remain the biggest FII bet, with FIIs holding about 40% of the sector even after cutting stakes in 21 of 28 sectors year on year.
The broader market tells the same story. Business Standard reported on 17 August 2026 that FPI ownership of NSE-listed companies fell to 15.1% in the June 2026 quarter, a 17-year low, while DIIs held 19.5% and domestic mutual funds alone held a record 11.6%.
For a list of companies that went against this trend, see our FII holding increase stocks for Q2 FY27. For why domestic money keeps outbidding foreign money, our guide on the difference between FII and DII explains how each group invests. Now, here is how to pull these numbers for any stock yourself.
How to Check the FII Shareholding Pattern of a Stock
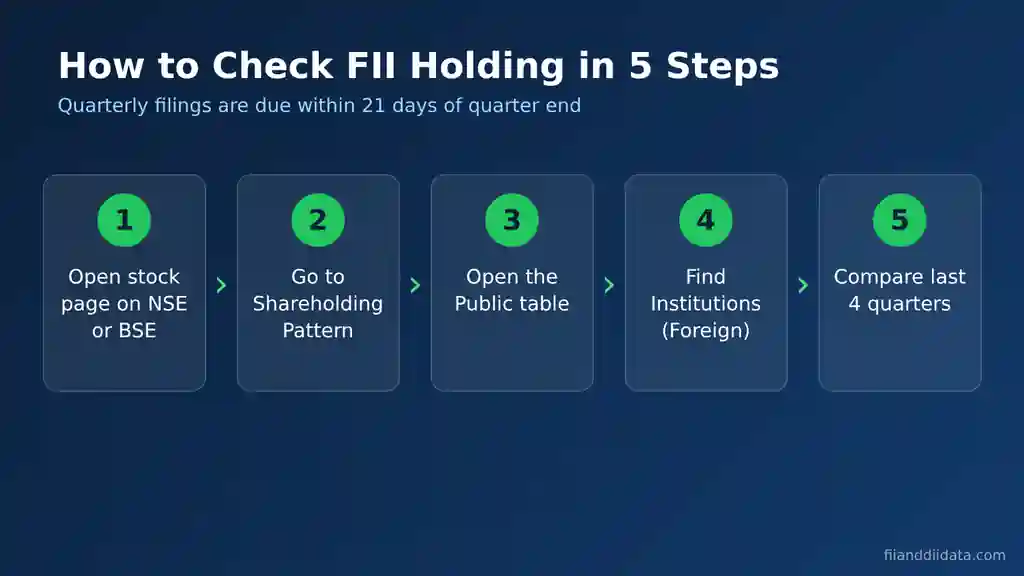
The primary source is the exchange filing. Under SEBI LODR Regulation 31, a listed company must file its shareholding pattern within 21 days from the end of each quarter, and also within 10 days of any capital restructuring that changes paid-up capital by more than 2%. So data for the quarter ended 30 September is due by 21 October.
- Open the stock page on nseindia.com or bseindia.com by searching the company name or symbol.
- Go to the shareholding pattern section under corporate information or filings, and pick the latest quarter.
- Open the public shareholding table (Table III), not just the summary, so you can see the sub-categories.
- Find “Institutions (Foreign)” and add the FPI Category I and Category II percentages to get total FII holding.
- Compare the last four quarters side by side, and note any foreign fund named in the 1%-plus list.
Broker apps and screeners also show a ready-made FII column, which is handy for a quick scan. Use the exchange filing when a decision depends on the number, because third-party sites sometimes merge FDI or depository receipts into the FII figure. The next section shows how to turn a raw change into something you can act on.
Worked Example: Reading a Quarterly FII Stake Change
Take a hypothetical private bank, XYZ Bank, with 100 crore shares in issue and a share price of Rs 500. Its filings show:
- June 2026 quarter: FPI Category I + II = 18.40%
- September 2026 quarter: FPI Category I + II = 16.90%
- DII holding moved from 20.1% to 21.8% over the same period
Step 1, the change: 16.90% minus 18.40% is a fall of 1.5 percentage points. In relative terms, FIIs cut their position by about 8.15%.
Step 2, the shares: 1.5% of 100 crore shares is 1.5 crore shares sold, net, by foreign investors during the quarter.
Step 3, the money: at Rs 500 a share, that is roughly Rs 750 crore of net foreign selling. The actual figure depends on the prices at which they sold.
Step 4, who bought: DII holding rose 1.7 points, slightly more than the FII fall, so domestic funds absorbed all of it. If retail holding had risen instead, the signal would be weaker, because retail demand tends to be less steady.
Step 5, the headroom: if the bank’s sectoral cap is 74%, FIIs at 16.90% have about 57.1 points of room left, so the cap is not the reason for selling. The likelier causes are global, such as the rupee or US yields, or stock-specific, such as earnings.
The rule behind Step 5 is set by the FEMA (Non-debt Instruments) Rules, 2019. Each FPI or investor group must hold less than 10% of a company’s paid-up equity on a fully diluted basis, and since 1 April 2020 the combined FPI limit equals the sector’s foreign investment cap. If an FPI crosses the limit and does not sell down within five trading days, its whole holding is reclassified as FDI. With the method clear, here are the traps that catch most readers.
Common Mistakes When Reading FII Holding
- Judging one quarter in isolation. A single fall can come from one fund’s rebalancing. Three or four quarters in the same direction carry far more weight.
- Treating it as a timing tool. The data is up to 21 days old when it arrives and shows quarter-end positions only. FIIs may have already reversed course.
- Mixing FDI with FPI. A parent company’s stake is not portfolio money and does not react to market moods.
- Ignoring dilution. After a QIP, rights issue or merger, the FII percentage can fall even if FIIs bought more shares. Check the share count, not only the percentage.
- Assuming high FII holding is always good. A stock with 40% FII ownership can fall sharply when global funds cut India weight, as the 2026 selling showed.
- Forgetting the price. Rising FII stake with a falling price, or the reverse, deserves a closer look before you draw a conclusion.
A quick FII shareholding pattern checklist
- Have I added only FPI Category I and II rows?
- Is the trend the same for at least three quarters?
- Did the share count change because of dilution?
- Who took the other side: DIIs, retail or promoters?
- How much room is left under the foreign ownership limit?
- Does the market-wide flow picture in the monthly FII DII data support the stock-level change?
FAQs
What is FII shareholding pattern?
It is the share of a listed company’s equity held by foreign institutional investors, shown in the quarterly shareholding pattern filed with NSE and BSE. In the filing it appears as FPI Category I and Category II under Institutions (Foreign).
Where can I check FII holding in a stock?
Open the company’s page on nseindia.com or bseindia.com and go to the shareholding pattern section. Broker apps and screeners also show it, but the exchange filing is the primary source.
How often is the shareholding pattern updated?
Every quarter. SEBI LODR Regulation 31 requires listed companies to file it within 21 days of the quarter end, and within 10 days of a capital restructuring that changes paid-up capital by more than 2%.
Is high FII holding good for a stock?
It usually means better liquidity and research coverage, but it also exposes the stock to global selling. In 2026, 18 of the 21 Nifty stocks where FIIs cut stakes for three straight quarters also fell in price.
What is the maximum FII holding allowed in an Indian company?
A single FPI or investor group must hold less than 10% of paid-up equity on a fully diluted basis. All FPIs together are capped at the sectoral foreign investment limit, which has applied since 1 April 2020.
The Bottom Line
This quarterly table is a slow but honest record of what foreign institutions actually own. In 2026 it has told a clear story: FIIs have cut their share of Indian companies to multi-year lows, and domestic institutions now own more than they do across every market-cap band.
Used alone, the number is too late for trading. Used with daily flows, price action and the limits table, it helps you judge whether a stock has steady institutional support or is exposed to more foreign selling.
A practical next step: pick three stocks you own, pull four quarters of FPI Category I and II data from the exchange filings, and compare the trend with our daily FII and DII data. You can find more guides like this on the FIIAndDIIData.com blog.
Sources: Motilal Oswal data via Financial Express and IndiaIPO (30 Oct 2026); Business Standard (17 Aug 2026); Economic Times (2 Nov 2026); SEBI circular SEBI/HO/CFD/PoD-1/P/CIR/2022/92 (30 Jun 2022); SEBI LODR Regulation 31; FEMA (Non-debt Instruments) Rules, 2019 summary, Taxmann.
Disclaimer: This article is for educational purposes only and is not investment advice. Please consult a SEBI-registered advisor before making investment decisions.