The retail investors vs FII question comes down to one simple trade-off: foreign institutional investors own more of India Inc, but individual investors now do far more of the daily trading. As of 30 June 2026, FIIs held 15.88% of NSE-listed companies, a 14-year low, while individuals made up 33.4% of NSE cash market turnover in FY26. Here is what that gap means for your money.
Key Takeaways
- FIIs owned 15.88% of NSE-listed companies on 30 June 2026; direct retail and HNI holding was about 9.5%.
- Individuals generated 33.4% of NSE cash market turnover in FY26, more than twice the 14.6% share of the FIs category.
- FIIs move prices through size; retail investors move them through volume, mood and SIP money routed via mutual funds.
- In the June 2026 quarter, mutual funds bought about ₹1.42 lakh crore while FIIs sold about ₹1.43 lakh crore.
- Retail traders lose heavily in F&O: SEBI found over 91% of individual traders had net losses in FY25.
In this article
- Who Are Retail Investors and FIIs?
- Retail Investors vs FII: 8 Key Differences
- Who Owns More of India Inc in 2026?
- Who Moves the Market Day to Day?
- How FII Selling Hits a Stock: A Worked Example
- Retail Investors vs FII in F&O
- How Retail Investors Should Read FII Data
- Common Mistakes Retail Investors Make
- FAQs
- The Bottom Line
Who Are Retail Investors and FIIs?
A retail investor is an individual who buys shares or mutual funds with personal savings, usually through a broker app and a demat account. In shareholding data, exchanges and data firms often split individuals into two buckets: small retail holders and high net worth individuals (HNIs), who hold larger amounts in a single company.
A foreign institutional investor (FII) is an overseas fund, such as a pension fund, sovereign fund, hedge fund or global mutual fund, that invests in Indian securities. SEBI now registers them as foreign portfolio investors (FPIs), but market reports still use both names for the same group. Their daily cash market activity is part of the FII and DII data that NSE publishes after market hours.
The two groups sit at opposite ends of the market. One is millions of people with small tickets; the other is a few thousand funds with very large tickets. That size gap shapes almost every other difference, which we cover next.
Retail Investors vs FII: 8 Key Differences
The table below compares the two groups on the points that matter most when you read market data. Use it as a quick reference.
| Point | Retail investors | FIIs |
|---|---|---|
| Who they are | Individuals and HNIs investing personal money | Overseas funds registered with SEBI as FPIs |
| Ticket size | Small, from a few hundred rupees upward | Large, often hundreds of crores in one stock |
| Number of players | Over 13.1 crore unique registered investors on NSE (31 May 2026) | A few thousand registered funds |
| Main drivers | Salary flows, SIP habit, local news, market mood | Global interest rates, dollar, crude, valuations, index weights |
| Research | Limited; often tips, apps and social media | Dedicated analyst teams and models |
| Currency risk | None; they invest and spend in rupees | High; returns are measured in dollars |
| Preferred stocks | More presence in mid and small caps | Large, liquid stocks and index heavyweights |
| Data source | Quarterly shareholding, NSE turnover reports | Daily NSE provisional data, NSDL FPI data |
Why currency risk changes FII behaviour
Currency is the difference most retail investors ignore. If Nifty rises 5% but the rupee falls 5% against the dollar, a foreign fund earns close to nothing in dollar terms, while an Indian investor still earns 5%. This is why FIIs often sell when the rupee weakens, even if Indian company earnings look fine. A retail investor does not face this risk, which is one reason both groups can act in opposite ways on the same day.
With the basic differences clear, the next question is simple: who actually owns more of the market today?
Who Owns More of India Inc in 2026?
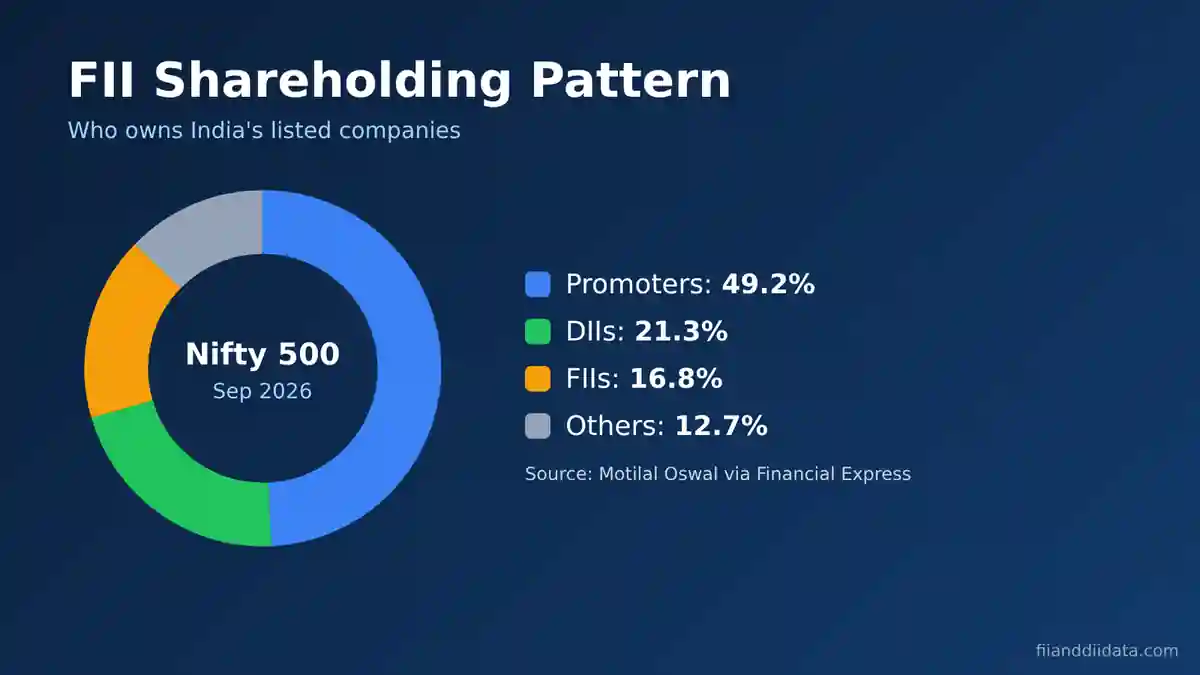
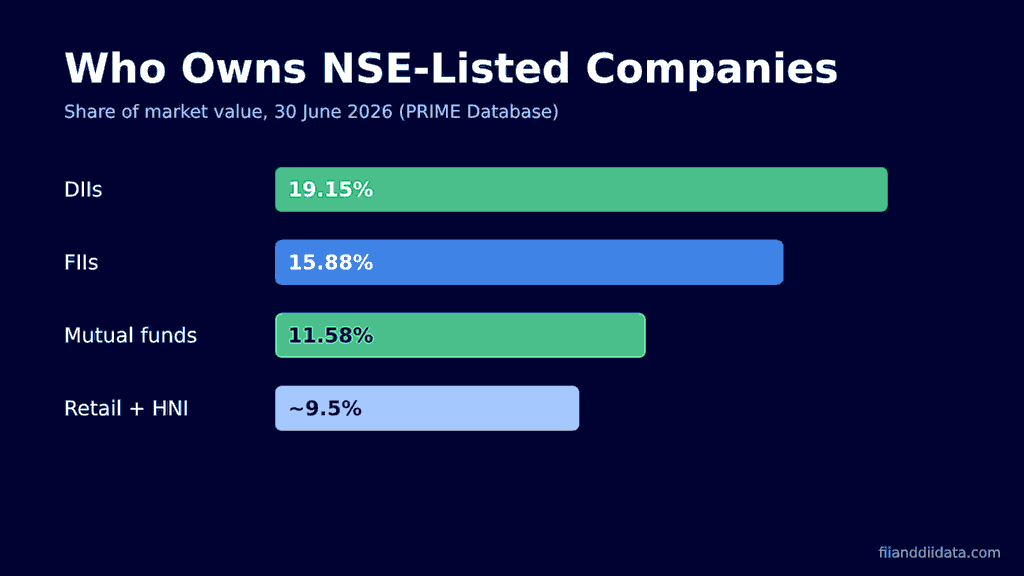
PRIME Database tracks the shareholding of all NSE-listed companies every quarter. Its June 2026 report, released on 4 August 2026, shows FII ownership slipping to 15.88%, a 14-year low, from about 16.1% in March 2026. Domestic institutional investors (DIIs) held 19.15%, and domestic mutual funds alone reached an all-time high of 11.58%.
| Investor group | 31 Mar 2026 | 30 Jun 2026 |
|---|---|---|
| FIIs / FPIs | 16.13% | 15.88% |
| DIIs (all) | 19.24% | 19.15% |
| Domestic mutual funds | 11.46% | 11.58% |
| Retail (direct) | 7.12% | Not reported separately |
| HNIs (direct) | 1.99% | Not reported separately |
| Retail + HNI (direct) | 9.11% | About 9.51% (derived) |
On direct holding alone, FIIs still own more than individuals. The picture changes once you count the money individuals put in through mutual funds. NSE reported that individuals, directly and through mutual funds, held 18.7% of NSE-listed market capitalisation as of 31 March 2026, which is above the FII share of 16.13% on the same date.
Retail investors vs FII ownership in rupee terms
NSE put the total market value of its listed companies at about ₹462.2 lakh crore in its June 2026 release. Applying the March 2026 ownership shares gives a rough sense of scale:
- FIIs at 16.13%: about ₹74.6 lakh crore
- Retail + HNI direct at 9.11%: about ₹42.1 lakh crore
- Individuals including mutual fund holdings at 18.7%: about ₹86.4 lakh crore
These are estimates built from two published figures, not official values, but they show the point clearly. Through SIPs, the ordinary Indian saver has quietly become a bigger owner than foreign funds. Read our guide on the difference between FII and DII to see how mutual funds fit into the DII bucket.
Who Moves the Market Day to Day?
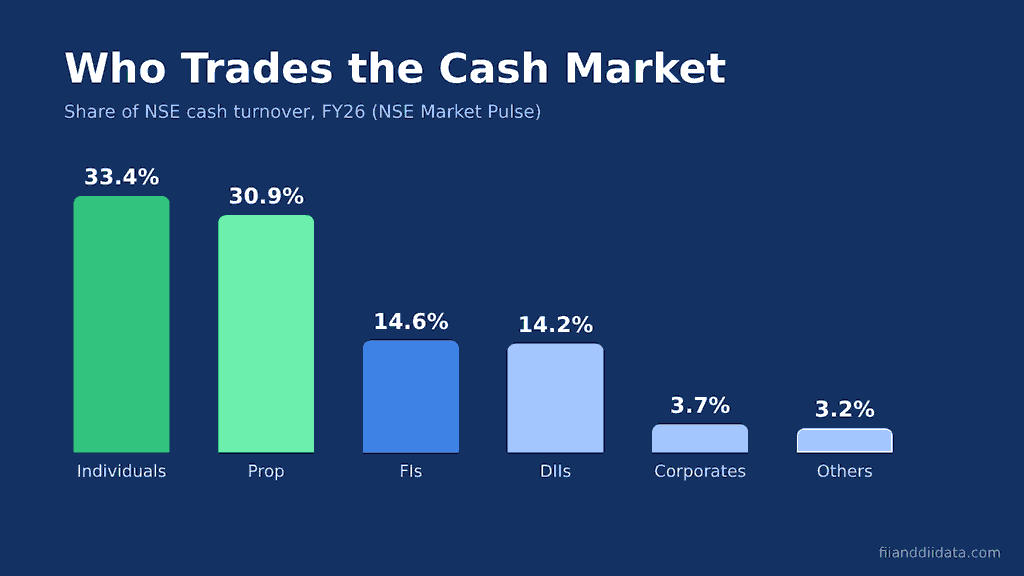
Ownership tells you who holds the shares. Turnover tells you who trades them. NSE’s Market Pulse report for April 2026 shows that individuals accounted for 33.4% of gross cash market turnover in FY26, the largest single group. Proprietary traders (brokers trading their own money) followed at 30.9%.
| Client category | FY26 gross turnover (₹ ‘000 crore) | Share |
|---|---|---|
| Individuals | 17,431 | 33.4% |
| Proprietary traders | 16,108 | 30.9% |
| FIs | 7,611 | 14.6% |
| DIIs | 7,377 | 14.2% |
| Corporates | 1,906 | 3.7% |
| Others | 1,692 | 3.2% |
So individuals trade more than twice as much as the FIs category, yet the market often reacts more sharply to FII flows. The reason is direction. Retail trades are spread across many stocks and often cancel each other out; one person buys what another sells. FII trades tend to point the same way across many funds at once, especially when global factors such as US bond yields or the dollar change. NSE data also shows individuals were small net sellers of ₹5,803 crore in the FY26 cash market, a tiny figure next to their gross turnover.
That is why our FII DII data today page focuses on net flows rather than gross volume. Net flows show conviction. Gross volume shows activity. The next section turns that idea into numbers.
How FII Selling Hits a Stock: A Worked Example
Take a hypothetical large-cap company with 100 crore shares. FIIs own 20% (20 crore shares) and retail investors own 12% (12 crore shares). On a normal day, about 40 lakh shares change hands for delivery.
- A few global funds decide to cut their combined stake by 2 percentage points. That means selling 2 crore shares.
- 2 crore shares divided by 40 lakh shares a day equals five full days of the stock’s normal delivery volume.
- Someone has to absorb that supply. If domestic funds are not buying, the price must fall until new buyers appear.
- Now compare retail. Even if 1 lakh retail investors each sell 200 shares on the same day, that is 2 crore shares too, but it rarely happens in one direction at once.
The lesson is that FII selling is concentrated and coordinated by the same global triggers. Retail selling is scattered. This is why a single week of heavy FII exit can push a stock down even when retail investors keep buying.
How retail SIP money absorbs FII selling
In the June 2026 quarter, PRIME Database reported that FIIs pulled out about ₹1.43 lakh crore while domestic mutual funds invested about ₹1.42 lakh crore. In simple terms, mutual funds absorbed roughly 99% of the FII outflow in that quarter. Much of that mutual fund money comes from retail SIPs, which hit a record ₹32,490 crore in September 2026, according to AMFI data. Our post on FII selling vs DII buying in 2026 tracks this tug of war month by month.
The cash market is only half the story. In derivatives, the gap between retail and foreign players is much wider.
Retail Investors vs FII in F&O
Futures and options (F&O) are where retail traders and foreign funds meet most directly, and where the results differ most. SEBI’s study of equity derivatives, released on 7 July 2025, found that more than 91% of individual traders made net losses in FY25. Their combined net loss was ₹1,05,603 crore after costs, about 41% higher than ₹74,812 crore in FY24.
The study covered about 96 lakh unique individual traders at the top 13 brokers. Spread across them, the FY25 loss works out to roughly ₹1.1 lakh per trader on average. Institutions, foreign funds and proprietary desks were on the other side of many of those trades, often selling options and hedging large portfolios.
FIIs mostly use index futures and options to hedge or to express a view on the whole market. Retail traders mostly buy options for quick gains. Our analysis of Pro vs Client open interest shows how differently these groups position before expiry, and SEBI’s new F&O rules for 2026 were designed partly to reduce retail losses.
Knowing who wins and loses is useful. Knowing how to use FII data in your own decisions is more useful, which brings us to a practical routine.
How Retail Investors Should Read FII Data
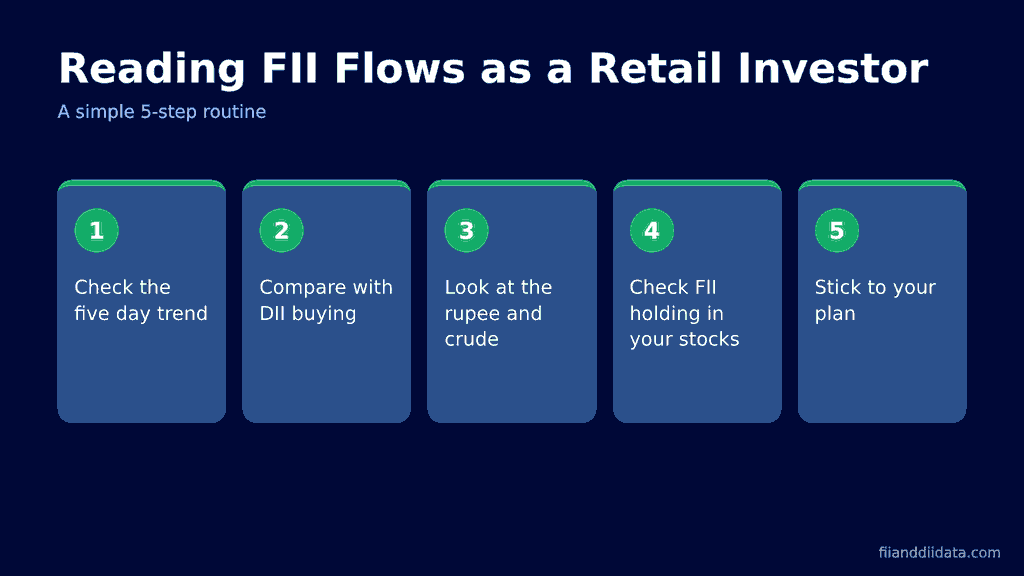
FII data is released after market close: NSE publishes provisional cash market figures around 6 PM IST on trading days, and NSDL publishes final FPI data the next working day. It is never live. Use this five-step checklist once a week rather than reacting to one day’s number.
- Check the five-day trend. A single day of ₹3,000 crore selling means little. Five straight days of selling means a real shift.
- Compare with DII buying. If DIIs are buying more than FIIs are selling, the market usually holds up.
- Look at the rupee, crude oil and US bond yields. These three explain most FII moves in 2026.
- Check FII holding in your own stocks. Quarterly shareholding patterns show whether foreign funds are adding or cutting.
- Stick to your plan. If your goal is 10 years away, FII flows should change your timing a little, not your strategy.
For a fuller explanation of the link between flows and index moves, see how FII flows affect the stock market.
Common Mistakes Retail Investors Make
- Copying FIIs blindly. FIIs may sell India because of a dollar move or a better opportunity elsewhere, not because your stock is weak.
- Panic selling during FII exits. FPIs pulled a record ₹3.08 lakh crore from Indian equities in 2026 up to 12 October, yet SIP investors who stayed invested kept buying at lower prices.
- Reading one day’s number. Provisional NSE data can differ from final NSDL data, and single days are noisy.
- Ignoring currency. A falling rupee often explains FII selling better than company news.
- Trading options to match FII moves. FIIs hedge large portfolios; a retail option buyer has no such cushion.
Most of these mistakes come from treating FIIs as smarter investors. They are bigger investors with different goals, which is a very different thing. The questions below cover what readers ask most often.
FAQs
Who is bigger in the market, retail investors vs FII?
FIIs own more directly: 15.88% of NSE-listed companies on 30 June 2026 against about 9.5% for retail and HNI investors. But individuals held 18.7% on 31 March 2026 once mutual fund holdings are included, which is more than the FII share.
Do retail investors move the Indian stock market?
Yes, mainly through volume and through SIP money. Individuals made up 33.4% of NSE cash market turnover in FY26, and SIP inflows fund the mutual fund buying that has absorbed much of the FII selling in 2026.
Why does FII selling affect prices more than retail selling?
FII selling is large, concentrated in big stocks and usually driven by the same global factors, so many funds sell at once. Retail selling is spread across many stocks and many people, so buyers and sellers often offset each other.
Should retail investors follow FII buying and selling?
Use FII data as context, not as a signal to copy. Check the five-day trend, compare it with DII buying and look at the rupee and crude oil before changing any long-term plan.
Where can I see FII and retail data?
Daily FII and DII cash data comes from NSE around 6 PM IST on trading days, with final FPI data from NSDL the next working day. Retail ownership appears in quarterly shareholding patterns and in NSE and PRIME Database reports.
The Bottom Line
Retail investors and FIIs play different games in the same market. FIIs still own more shares directly and can move prices quickly because their trades are large and point the same way. Retail investors trade more often and, through mutual funds, now own more of India Inc than foreign funds do.
For a long-term investor, that balance is good news. Steady SIP money has cushioned the record FPI exit of 2026. The risk lies in short-term trading, especially options, where SEBI data shows most individuals lose money.
A practical next step: check the five-day FII and DII trend each weekend and review the FII holding in the stocks you own once a quarter. You can find more explainers on our blog.
Sources: PRIME Database via The Tribune (4 Aug 2026); Business Standard (5 May 2026); NSE Market Pulse, April 2026; Business Standard on NSE investor base (8 Jun 2026); Business Standard on the SEBI F&O study (7 Jul 2025); Free Press Journal on 2026 FPI outflows (13 Oct 2026); AMFI monthly data (September 2026).
Disclaimer: This article is for educational purposes only and is not investment advice. Please consult a SEBI-registered advisor before making investment decisions.