
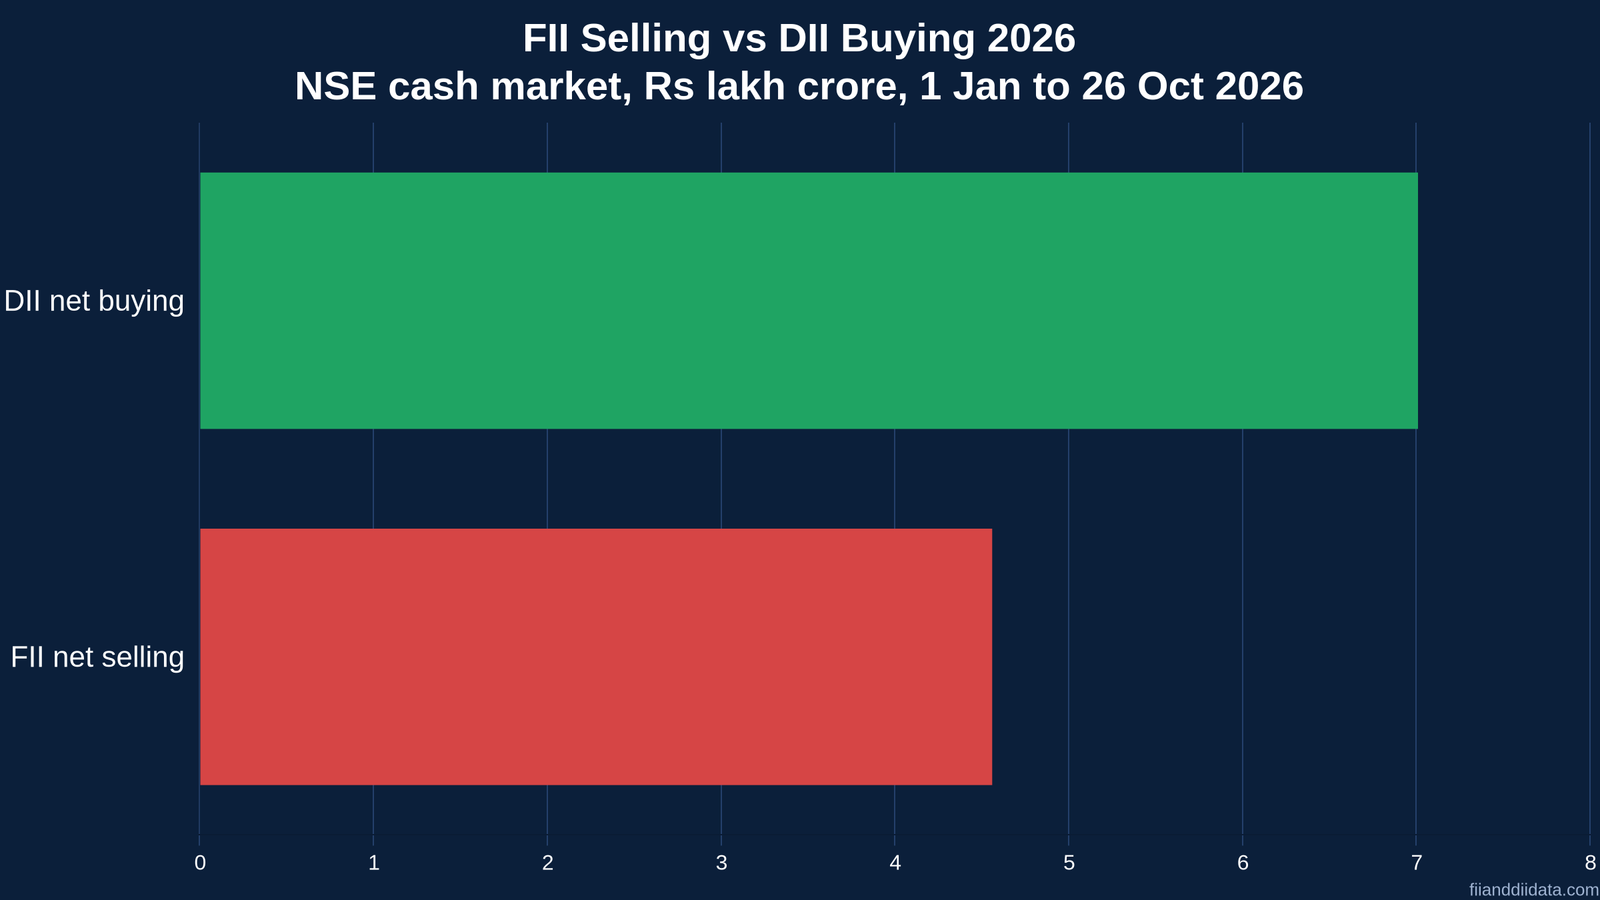
The FII selling vs DII buying 2026 contest has a clear winner so far: domestic institutions bought ₹7.01 lakh crore of Indian shares in the NSE cash market between 1 January and 26 October 2026, while foreign institutions sold ₹4.56 lakh crore. That is ₹1.54 of domestic buying for every ₹1 of foreign selling. Yet the Nifty 50 was still down 14.4% for the year by 13 October. Here is what the numbers say, and what they do not.
Key Takeaways
- NSE provisional data shows DIIs bought ₹7.01 lakh crore and FIIs sold ₹4.56 lakh crore from 1 January to 26 October 2026.
- DIIs out-bought FIIs in nine of ten months; April was the only month they absorbed less than foreigners sold.
- Strong domestic buying cushioned the fall but did not stop it: the Nifty 50 was down 14.4% for the year as of 13 October.
- Record SIP inflows of ₹32,490 crore in September 2026 are the main fuel behind DII buying.
- DIIs owned 21% of Nifty 500 companies in June 2026 against 17% for FIIs, per MOFSL.
In this article:
- FII Selling vs DII Buying 2026: The Scoreboard
- Month-wise FII Selling vs DII Buying 2026
- Why Nifty Fell Even Though DIIs Bought More
- Where the DII Money Comes From
- The Ownership Shift: DIIs Now Own More Than FIIs
- Can DII Buying Keep Absorbing FII Selling?
- How Traders Can Use the FII vs DII Flow Gap
- FAQ
- The Bottom Line
FII Selling vs DII Buying 2026: The Scoreboard
FIIs (foreign institutional investors, also called FPIs) are overseas funds that buy and sell Indian shares. DIIs (domestic institutional investors) are Indian mutual funds, insurance companies, banks and pension funds. Every trading day, NSE publishes a provisional net figure for each group around 6 PM IST. Add those daily numbers and you get the year so far.
- FII net selling, NSE cash market, 1 January to 26 October 2026: ₹4,55,994 crore.
- DII net buying, same period: ₹7,01,253 crore.
- Net institutional flow: about +₹2.45 lakh crore of domestic money left over after covering every rupee of foreign selling.
- Full-year 2025 DII buying, for comparison: ₹7.88 lakh crore, per Business Standard (13 October 2026). With two months left, 2026 is already close to that record.
You will also see a smaller foreign figure in the news. NSDL, the depository, puts the 2026 FPI outflow at about ₹3.08 lakh crore because it counts IPO and QIP money that NSE’s exchange data leaves out. Business Standard reported ₹3.64 lakh crore of FPI selling on exchanges up to 12 October, offset by ₹56,485 crore of primary market buying. We explain the gap in our guide on why NSE and NSDL FII numbers differ. For this article we use the NSE cash data, because that is the money that actually meets on the exchange every day.
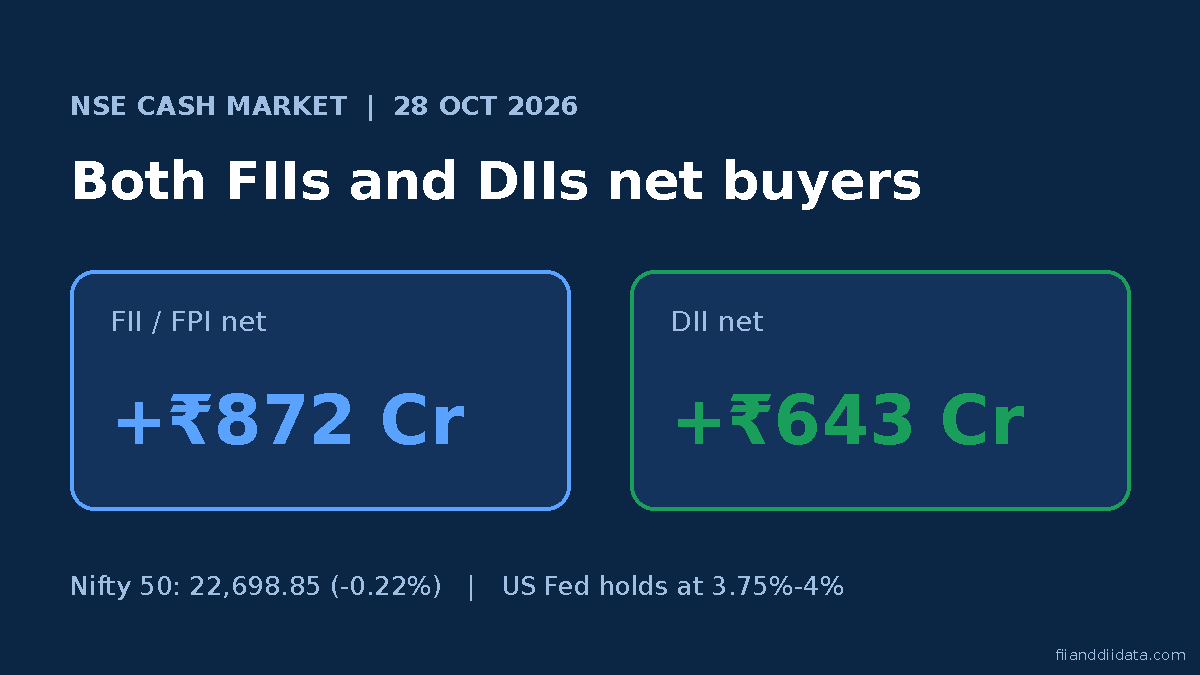
The latest session added a twist. On 27 October 2026, FIIs were net buyers of ₹4,240 crore while DIIs sold ₹1,250 crore, as we covered in our FII DII data for 27 October 2026. One day does not change the year, but it shows the roles can flip. The monthly pattern tells the fuller story.
Month-wise FII Selling vs DII Buying 2026
The table below shows the net figure for each group by month, plus a column we call the absorption ratio. It is simply DII net buying divided by FII net selling. A ratio above 1.0 means domestic institutions bought more than foreigners sold that month.
| Month (2026) | FII net (₹ crore) | DII net (₹ crore) | Absorption ratio |
|---|---|---|---|
| January | -41,435 | +69,221 | 1.67x |
| February | -6,641 | +38,423 | 5.79x |
| March | -1,22,540 | +1,42,960 | 1.17x |
| April | -70,135 | +51,064 | 0.73x |
| May | -55,963 | +82,669 | 1.48x |
| June | -49,029 | +85,800 | 1.75x |
| July | -5,779 | +35,099 | 6.07x |
| August | -7,532 | +58,268 | 7.74x |
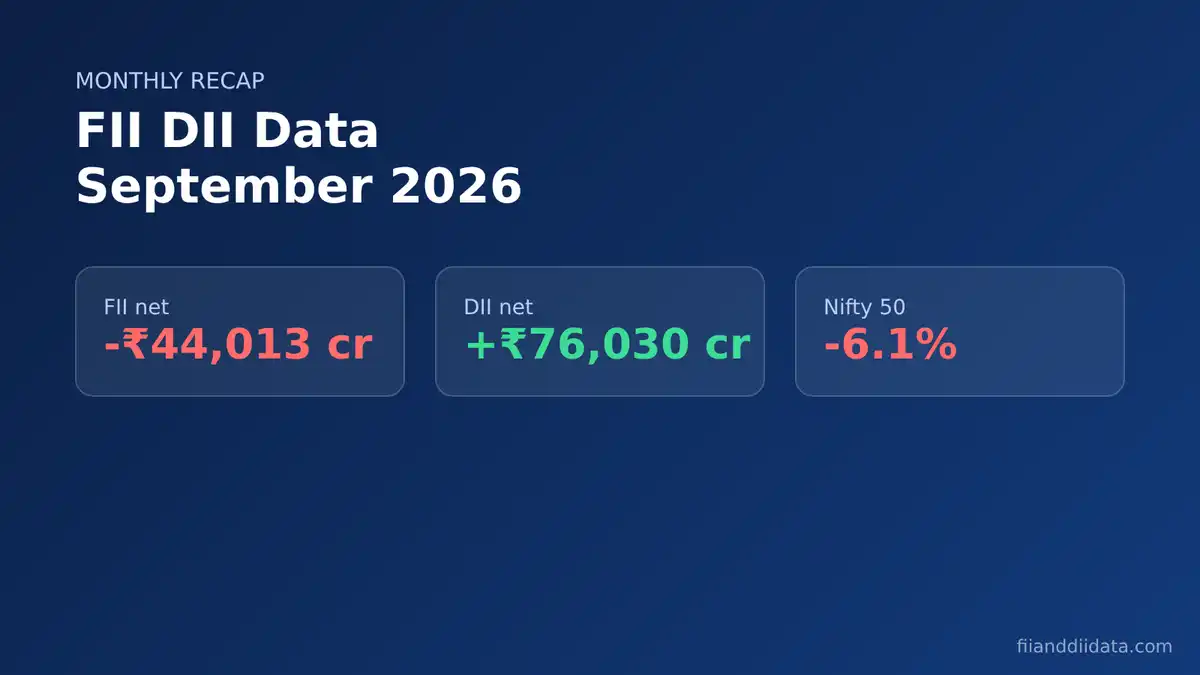
| September | -44,013 | +76,030 | 1.73x |
| October (to 26 Oct) | -52,927 | +61,719 | 1.17x |
| Total | -4,55,994 | +7,01,253 | 1.54x |
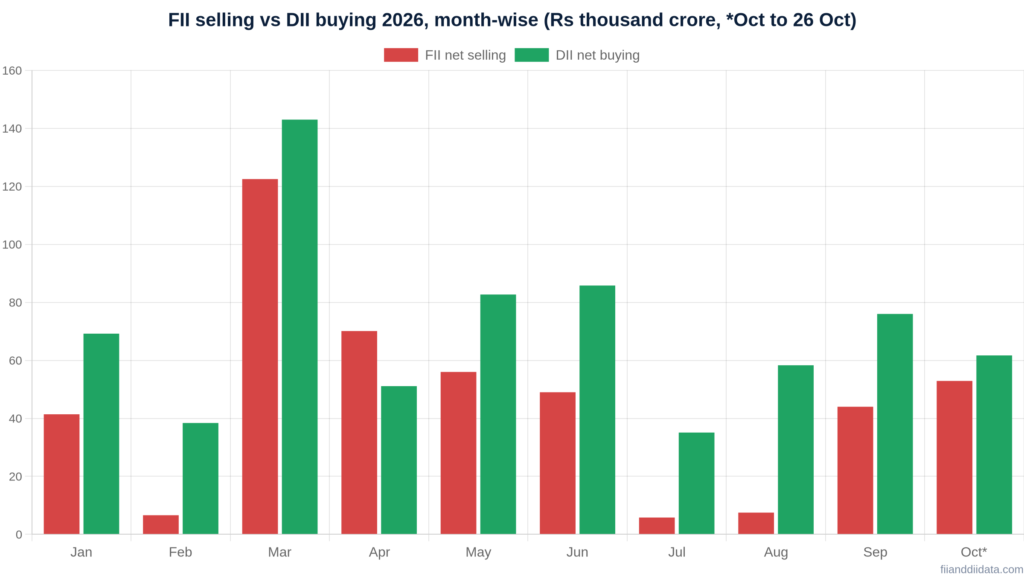
What the FII selling vs DII buying 2026 table shows
Three things stand out. First, FIIs were net sellers in every single month on NSE data, even in July and August when NSDL showed foreign inflows thanks to IPO money. Second, March was the stress test: FIIs sold ₹1.23 lakh crore and DIIs answered with ₹1.43 lakh crore, their biggest month of the year. Third, April is the exception. DIIs bought only ₹51,064 crore against ₹70,135 crore of foreign selling, leaving about ₹19,000 crore of net supply for the market to digest.
The first half of the year did the heavy lifting. From January to June, DIIs bought ₹4.70 lakh crore while FIIs sold ₹3.46 lakh crore. You can track every month as it closes on our FII selling vs DII buying data, month by month. If domestic money won every month but one, why did the index still fall?
Why Nifty Fell Even Though DIIs Bought More
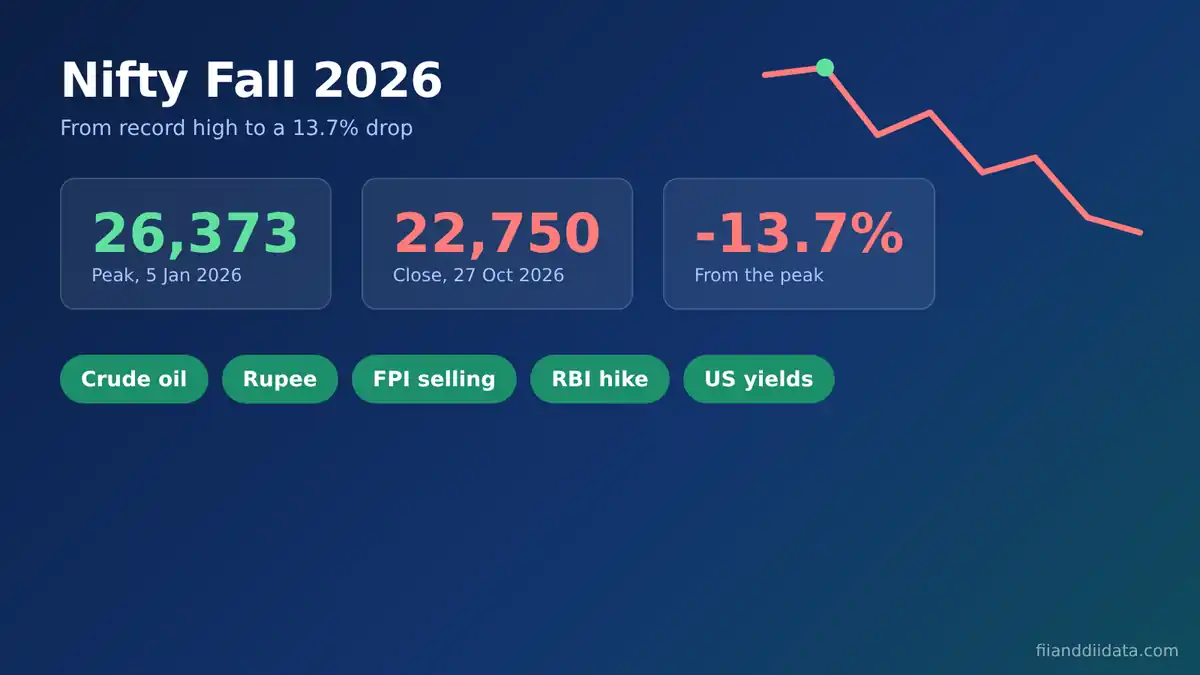
This is the question most readers ask, and the honest answer is that net flows are only one input. Business Standard reported the Nifty 50 down 14.4% and the Sensex down 15.6% for 2026 as of 13 October, despite the domestic surplus. A few reasons explain the gap.
- Price is set at the margin. Flows tell you who bought and sold, not at what price. A seller who must exit, such as a global fund meeting redemptions, can push prices lower even when buyers are plentiful.
- Different stocks. FIIs hold large, liquid index names. When they sell private banks and IT heavyweights, the Nifty feels it directly. DII money is spread wider, across mid-caps, small-caps and new listings.
- Extra supply from new issues. Domestic money also funded IPOs, QIPs and block deals. That cash creates new shares rather than lifting the price of existing index stocks.
- Global pressure. A US 10-year Treasury yield above 5.2% and Brent crude above $100 a barrel in October hurt sentiment, as we explain in our FPI outflow 2026 analysis.
Worked example: reading the absorption ratio
Take October up to 26 October. FIIs sold ₹52,927 crore and DIIs bought ₹61,719 crore.
- Absorption ratio: 61,719 ÷ 52,927 = 1.17x.
- Net institutional surplus: 61,719 – 52,927 = ₹8,792 crore.
- Compare with August: 58,268 ÷ 7,532 = 7.74x, with a surplus of ₹50,736 crore.
Both months show DIIs winning. But October’s cushion was less than one-fifth of August’s, which is why the market felt much heavier. A falling ratio, even above 1.0, is an early warning that domestic support is being stretched.
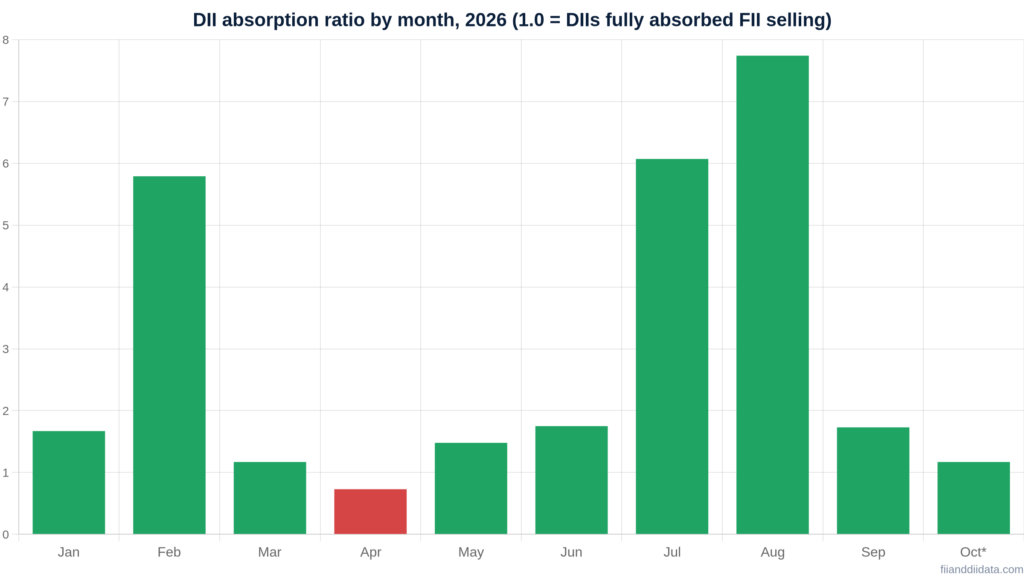
So the size of the cushion matters as much as its direction. That raises the next question: where does all this domestic money come from?
Where the DII Money Comes From
Most DII buying starts with ordinary savers. A SIP (systematic investment plan) is a fixed monthly investment into a mutual fund. Fund managers must then invest that cash, usually within days, whatever the market mood.
- SIP inflows, September 2026: a record ₹32,490 crore, up from ₹32,297 crore in August and ₹29,361 crore a year earlier (AMFI data via Outlook Money, 12 October 2026).
- Net equity mutual fund inflows, September 2026: ₹38,307 crore, up about 31% from August.
- Other DIIs: insurers such as LIC, pension funds and banks add to this steady base.
A monthly SIP book of over ₹32,000 crore works out to more than ₹3.8 lakh crore a year from SIPs alone. That is more than the entire 2026 FPI outflow on NSDL data so far. This is why DII buying looks structural rather than tactical. Our report on SIP inflow in September 2026 covers the trend in detail. Over time, this steady buying has changed who owns Indian companies.
The Ownership Shift: DIIs Now Own More Than FIIs
Years of foreign selling and domestic buying show up in shareholding data. According to a Motilal Oswal Financial Services (MOFSL) report cited by Business Today on 31 July 2026, ownership of Nifty 500 companies in June 2026 looked like this:
| Holder | March 2026 | June 2026 |
|---|---|---|
| Promoters | 49.4% | 49.5% |
| DIIs | 20.9% | 21.0% (record) |
| FIIs | 17.1% | 17.0% |
| Retail | 12.7% | 12.6% |
June 2026 was the ninth straight quarterly rise in DII ownership. Business Today also reported that DIIs raised holdings in 19 of 24 sectors over the year, with the heaviest buying in private banks, telecom, real estate, IT and healthcare. FIIs cut stakes in private banks, technology, real estate and autos, but added in metals, PSU banks, NBFCs and capital goods.
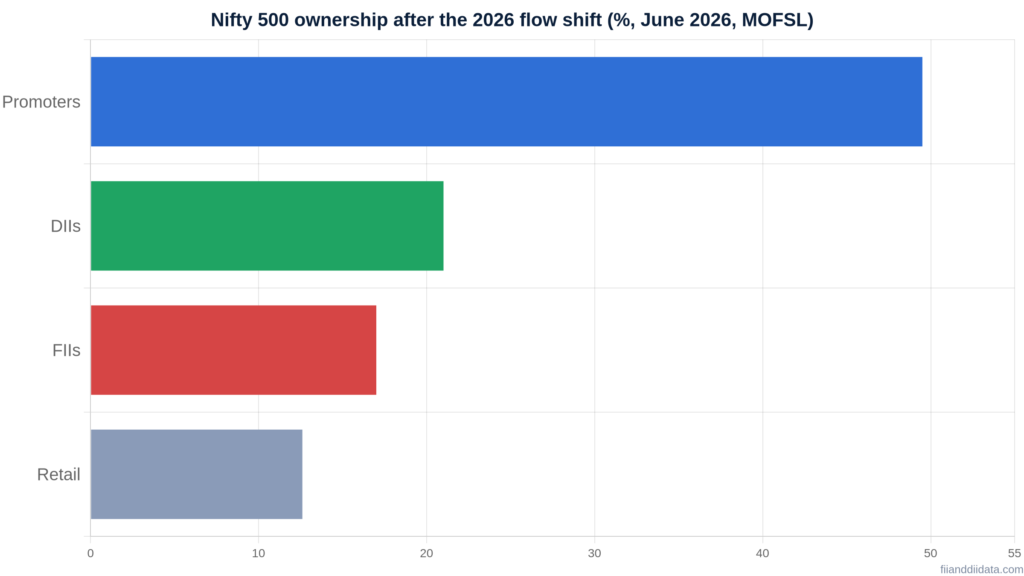
The practical takeaway: when FIIs and DIIs disagree on a sector, the domestic side now has the bigger balance sheet in many stocks. Our guide to the difference between FII and DII explains why the two groups behave so differently. Bigger, though, does not mean unlimited.
Can DII Buying Keep Absorbing FII Selling?
The domestic cushion has held through a record foreign exit, but it has limits worth watching. DII buying depends on retail investors continuing their SIPs. If a long fall in prices starts to hurt confidence, SIP stoppages could rise and the monthly pool would shrink. Mutual funds also hold some cash, and they can slow purchases when valuations look stretched.
Foreign selling may not ease quickly either. Geojit’s V K Vijayakumar told Business Standard that pulling money out of India is rational for FPIs while US bond yields stay high. There is a positive reading too. Centrum’s Jignesh Desai told Business Standard he expects foreign selling to slow over the next 12 months if the AI trade cools and the rupee stabilises. If that happens, DIIs would no longer need to carry the market alone.
Common mistakes when reading FII selling vs DII buying 2026 data
- Assuming net DII buying means prices must rise. 2026 proves otherwise.
- Mixing NSE and NSDL totals. The ₹4.56 lakh crore NSE figure and the ₹3.08 lakh crore NSDL figure measure different things.
- Reading one day as a trend. FII buying of ₹4,240 crore on 27 October came after weeks of selling.
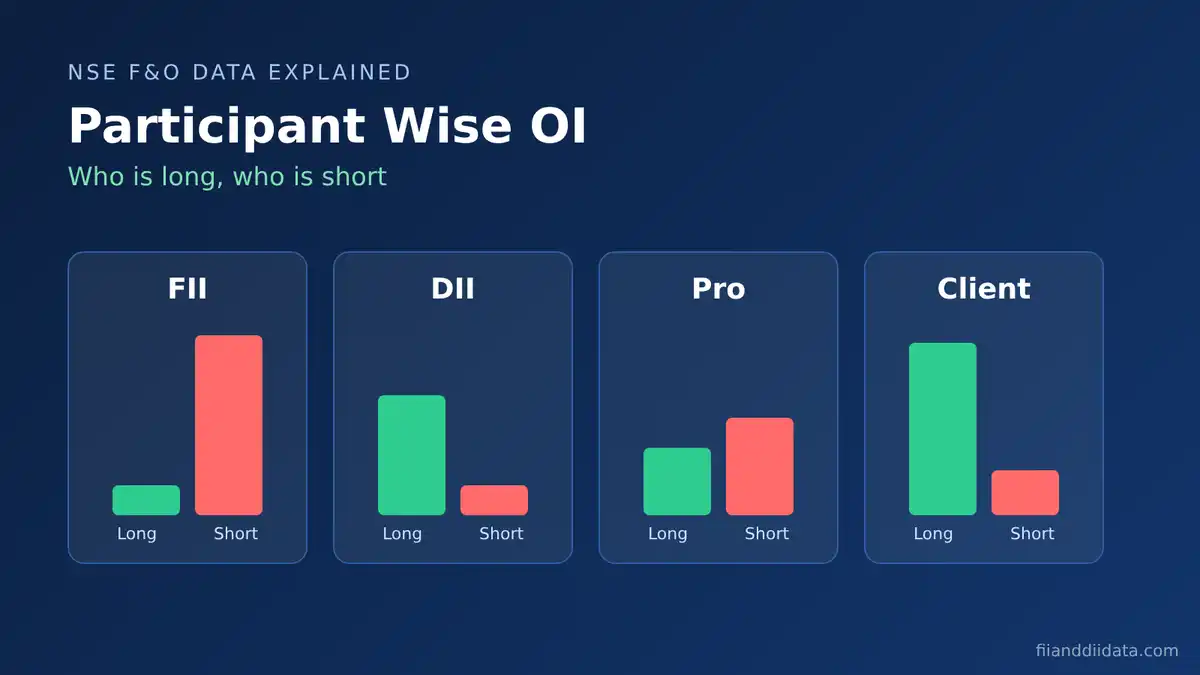
- Ignoring the derivatives side. Cash flows without index futures positions give only half the picture.
Keep these traps in mind, and the flow gap becomes a useful tool rather than a headline.
How Traders Can Use the FII vs DII Flow Gap: A Checklist
We suggest a simple weekly routine using the daily FII DII cash market summary:
- Add up the week. Sum FII and DII net figures for five sessions instead of reacting to each one.
- Work out the absorption ratio. Divide DII buying by FII selling. Above 1.5x is a comfortable cushion; between 1.0x and 1.2x is thin; below 1.0x means net supply.
- Watch the trend of the ratio. A ratio falling for three weeks in a row matters more than its level.
- Check monthly SIP data. AMFI releases it around the 10th of each month. A drop in SIP inflows would weaken the DII side.
- Look for a role reversal. Several sessions of FII buying with DII selling, like 27 October, can signal foreign money returning to large caps.
Flow data works best alongside price levels and global cues, not as a stand-alone buy or sell signal. For live charts and all our free tools, visit the FII and DII data home page.
Frequently Asked Questions
What is the FII selling vs DII buying 2026 total so far?
NSE provisional cash market data shows FIIs sold ₹4,55,994 crore and DIIs bought ₹7,01,253 crore between 1 January and 26 October 2026. Domestic institutions bought about ₹1.54 for every ₹1 that foreign institutions sold.
Why is the market falling if DIIs are buying more than FIIs are selling?
Net flows do not set prices on their own. FIIs sold large index stocks, new IPOs added fresh supply, and global factors such as US bond yields above 5% and crude above $100 weighed on sentiment. The Nifty 50 was down 14.4% for 2026 as of 13 October.
Which month saw the highest DII buying in 2026?
March 2026, when DIIs bought ₹1,42,960 crore in the NSE cash market while FIIs sold ₹1,22,540 crore.
Why do DIIs buy when FIIs sell?
Most DII money comes from monthly SIP contributions that mutual funds must invest regardless of market mood. SIP inflows hit a record ₹32,490 crore in September 2026. Lower prices after foreign selling can also make valuations more attractive for domestic funds.
Do DIIs own more of Indian companies than FIIs?
Yes. A MOFSL report cited by Business Today showed DIIs owned 21% of Nifty 500 companies in June 2026, a record, against 17% for FIIs.
The Bottom Line
On the numbers, FII selling vs DII buying 2026 is not close. Domestic institutions have bought ₹7.01 lakh crore against ₹4.56 lakh crore of foreign selling, and they now own more of India’s listed companies than foreign funds do. Without that cushion, a record foreign exit would likely have caused a much deeper fall.
Still, winning the flow battle has not protected prices, and October’s thinner 1.17x cushion shows domestic support has limits. Our practical next step: work out the weekly absorption ratio every Friday and treat a sustained drop below 1.0x, or a run of FII buying, as the signals worth acting on.
Sources: NSE provisional FII/DII cash market data (compiled 26 October 2026); Business Standard (13 October 2026); AMFI data via Outlook Money (12 October 2026); MOFSL via Business Today (31 July 2026); MOFSL via IANS (5 May 2026).
Disclaimer: This article is for educational purposes only and is not investment advice. Please consult a SEBI-registered advisor before making investment decisions.


1 thought on “FII Selling vs DII Buying 2026: ₹4.56 Lakh Cr Out, ₹7 Lakh Cr In”