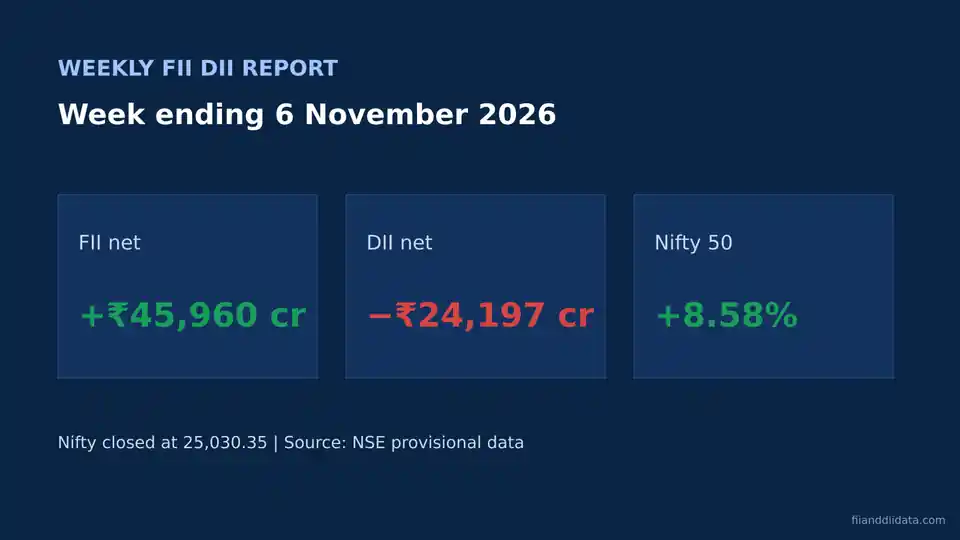
The FII weekly buying record was set in the week ended Friday, 6 November 2026, when foreign investors bought a net ₹45,960 crore of Indian shares in five sessions. Domestic institutions sold a net ₹24,197 crore, their largest weekly outflow ever, yet the Nifty 50 still jumped 8.58% to 25,030.35, its best week since February 2021. Here is what drove the flows, how to read them, and what to check next.
Key Takeaways
- FIIs bought a net ₹45,960 crore from 2 to 6 November 2026, a record for a single week.
- DIIs sold a net ₹24,197 crore, their largest weekly outflow on record.
- Nifty 50 rose 8.58% in the week and closed at 25,030.35 on 6 November, its seventh straight gain.
- DIIs supplied about 53% of what foreign funds bought, so institutions together still added ₹21,763 crore.
- FIIs cut index futures shorts by 40,403 contracts on Friday, but they remain net short.
- What happened in the record week
- FII weekly buying record: the daily numbers
- How to read the FII weekly buying record
- What F&O data adds
- A 5-step checklist for next week
- FAQ
- The Bottom Line
What Happened in the Record Week
Indian shares rallied for seven sessions in a row. On Friday, 6 November, the Sensex closed at 81,028.02, up 1,718.01 points or 2.17%, and the Nifty 50 ended at 25,030.35, up 2.01%. For the week, the Nifty gained 8.58% and the Sensex 8.82%, according to Business Standard. The combined market value of Nifty 50 companies rose by ₹14.83 trillion to ₹200.81 trillion.
The rally was narrow, though. On Friday, 2,400 stocks fell and only 1,681 rose, as reported by HDFC Sky. The Nifty Smallcap 250 slipped 0.85%. Private banks led the gains, with the Nifty Private Bank index up 3.2% on Friday.
Why foreign money came back so fast
Three triggers lined up. First, a sharp global sell-off in AI-linked technology stocks pushed funds toward markets with less tech exposure. The Nasdaq Composite fell 5.5% on Thursday, yet Indian shares rose the next day. Second, crude oil cooled: Brent fell nearly 18% over the week, its biggest weekly drop since 2020. Third, the US midterm results raised hopes of easing tension in West Asia.
The rupee confirmed the inflow. It closed at 93.91 per dollar on Friday, its strongest close since 22 April 2026. The next section shows how the buying built up, day by day.
FII Weekly Buying Record: The Daily Numbers
FIIs (foreign institutional investors, also called FPIs) are overseas funds. DIIs (domestic institutional investors) are Indian mutual funds, insurers, banks and pension funds. NSE publishes provisional net figures for both groups around 6 PM IST on every trading day. You can track each session on our FII DII data today page.
| Date | FII net (₹ crore) | DII net (₹ crore) | Combined (₹ crore) |
|---|---|---|---|
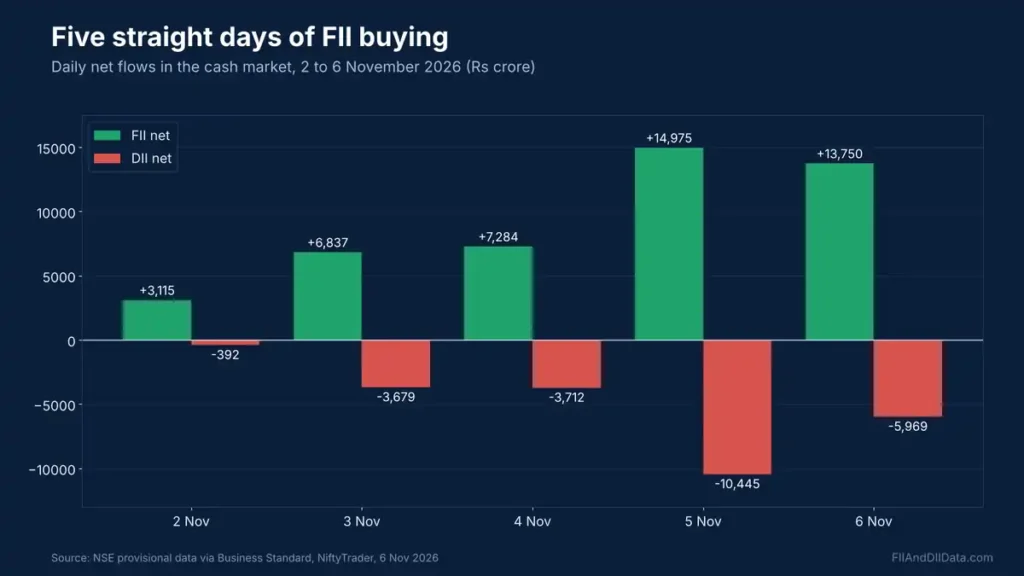
| 2 Nov 2026 | +3,114.68 | -392.20 | +2,722.48 |
| 3 Nov 2026 | +6,836.81 | -3,678.85 | +3,157.96 |
| 4 Nov 2026 | +7,284.03 | -3,712.23 | +3,571.80 |
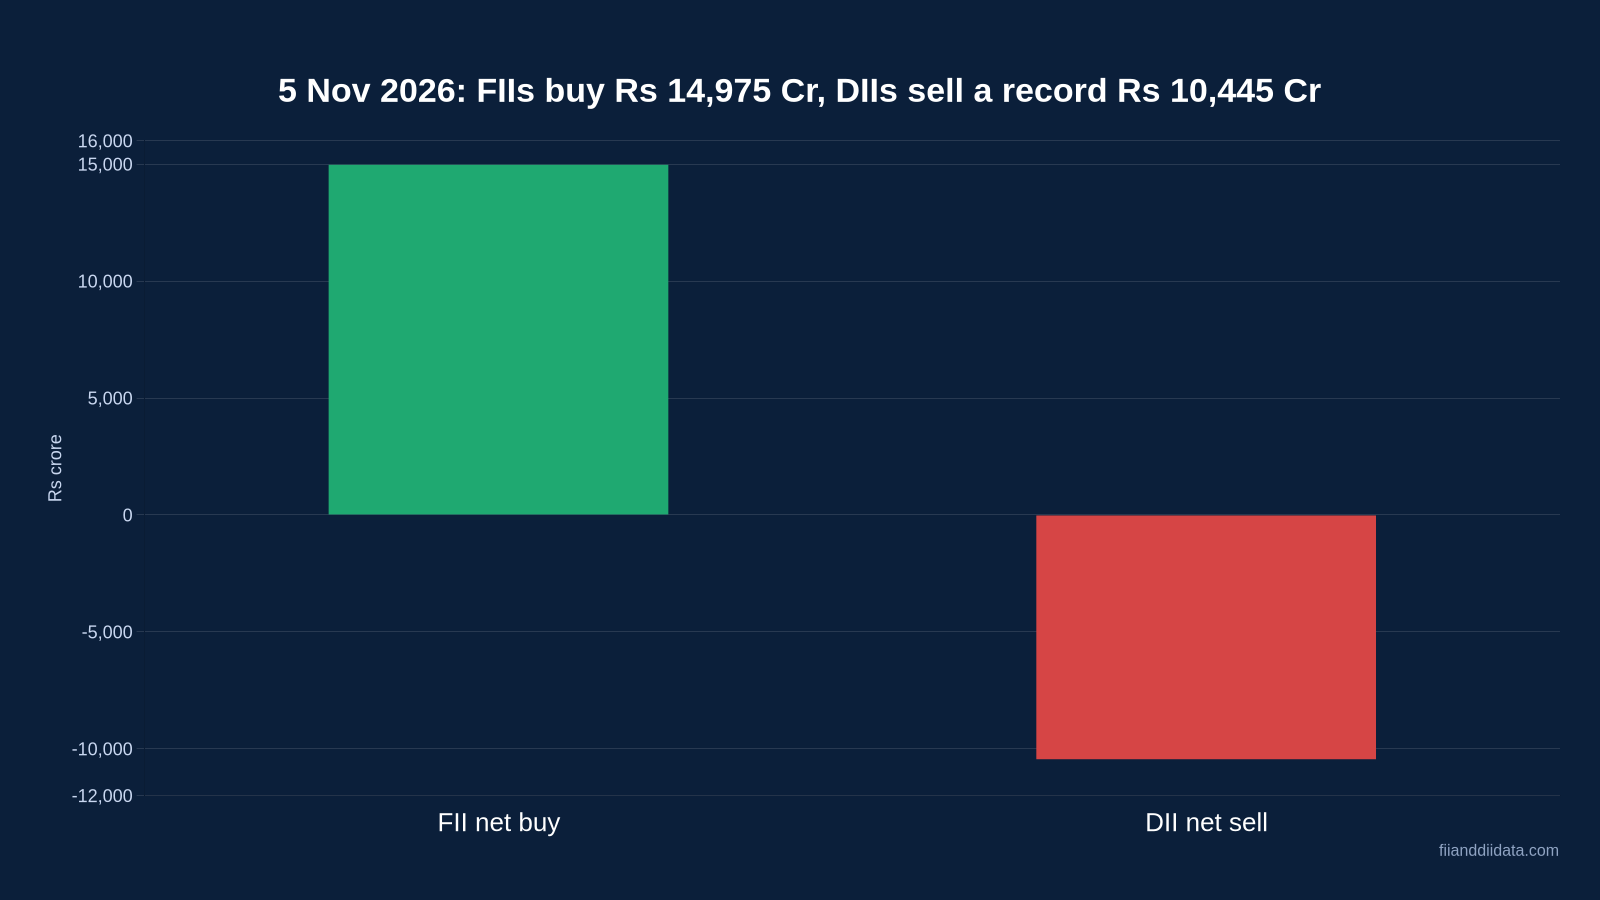
| 5 Nov 2026 | +14,974.68 | -10,444.54 | +4,530.14 |
| 6 Nov 2026 | +13,749.82 | -5,968.70 | +7,781.12 |
| Week total | +45,960.02 | -24,196.52 | +21,763.50 |
The two biggest days came at the end. Thursday’s ₹14,974.68 crore was the largest single-day FII purchase in nearly six years, and Friday added another ₹13,749.82 crore. We covered Thursday in detail in our report on the record single-day DII outflow.
Keep the bigger picture in mind. Even after this week, NSDL data cited by Angel One shows FPIs were net sellers of ₹2,72,452 crore in 2026 up to 5 November. So how much does one week really change? A simple calculation helps.
How to Read the FII Weekly Buying Record
A headline FII number tells you who bought. It does not tell you how strong the total demand was. Use these three steps with the week’s figures.
A worked example with the record week’s data
- Net institutional flow: ₹45,960 crore minus ₹24,197 crore equals ₹21,763 crore of fresh institutional buying.
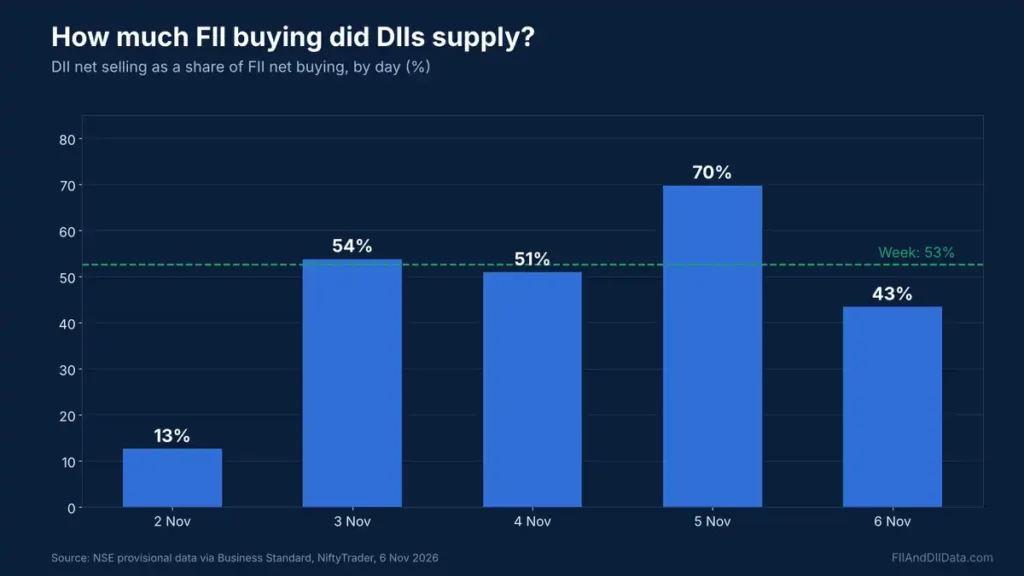
- Absorption ratio: ₹24,197 divided by ₹45,960 equals about 53%. DIIs supplied roughly half of the shares foreign funds bought.
- Price check: the Nifty still rose 8.58%, so buyers were more eager than sellers all week.
The daily ratio moved a lot. It was 13% on Monday, peaked at 70% on Thursday and eased to 43% on Friday. A falling ratio on a high-volume day means domestic funds were selling less into the rally, which is a firmer signal than the headline buying figure alone.
To compare this week with earlier months, see our monthly FII DII flow history. Cash data is only half the story, though. Derivatives show whether foreign funds believe the rally.
What F&O Data Adds
Business Standard noted heavy short covering. Nifty futures rose 8.4% over the week while open interest, the number of outstanding contracts, fell 17.6%. Rising prices with falling open interest usually means traders who bet on a fall are closing those bets.
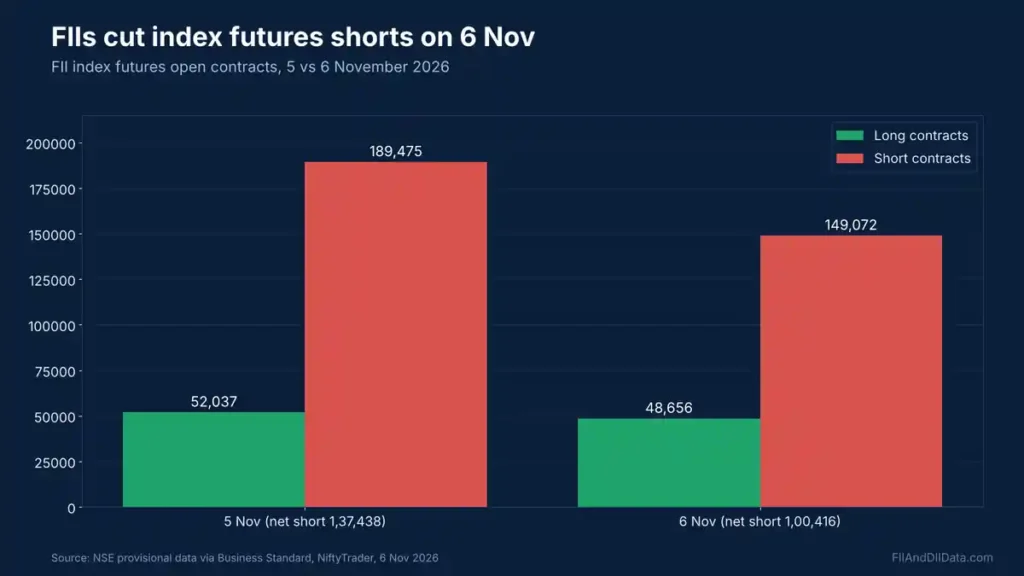
FII positions tell the same story. According to NiftyTrader, FIIs held 48,656 long and 1,49,072 short index futures contracts on 6 November, a net short of 1,00,416. On 5 November the net short was 1,37,438. So FIIs cut 40,403 short contracts in one day, but they still hold about three shorts for every long. That is hedged optimism, not an outright bullish bet.
Track these numbers on our participant-wise open interest page, the FII options activity tracker and the FII DII F&O data page. Here is how to put it all together.
A 5-Step Checklist for Next Week
- Check NSDL final data. NSE figures are provisional. NSDL publishes final FPI numbers on the next working day, and they can differ.
- Watch the absorption ratio. If DII selling stays above 60% of FII buying, the rally needs more foreign money to keep going.
- Follow FII futures shorts. Further short cuts would show rising conviction. New shorts would warn of a pause.
- Track crude and the rupee. Brent below $100 and a rupee near 94 helped this week. A reversal in either can slow inflows.
- Look at breadth. More declining stocks than rising ones on Friday means small caps have not joined yet.
Common mistakes to avoid: treating one record week as a new trend, reading DII selling as panic, and chasing small caps because the Nifty is up. The questions below cover what readers ask most.
FAQ
What is the FII weekly buying record set in November 2026?
Foreign institutional investors bought a net ₹45,960 crore of Indian shares in the week ended 6 November 2026, based on NSE provisional data. Business Standard described it as a record weekly purchase.
Why are FIIs buying Indian stocks now?
Reports cite a global sell-off in AI-linked tech stocks, a fall in Brent crude of nearly 18% in the week, and hopes of easing West Asia tension after the US midterm results.
Why did DIIs sell while FIIs bought?
No official reason has been given. Likely factors include profit booking after a fast rally and domestic funds supplying shares to heavy foreign demand. DIIs still sold only about 53% of what FIIs bought.
When is FII DII data released?
NSE releases provisional FII and DII cash data around 6 PM IST on each trading day. NSDL publishes final FPI data on the next working day.
Are FIIs bullish on Nifty now?
Partly. FIIs cut index futures shorts by 40,403 contracts on 6 November, but they still held a net short of 1,00,416 contracts, which points to hedged rather than outright bullish positioning.
The Bottom Line
The FII weekly buying record marks a sharp turn after months of foreign selling. Foreign funds bought ₹45,960 crore, domestic funds took profits, and institutions together were still strong net buyers as the Nifty crossed 25,000.
One week does not undo a year of outflows, and FIIs remain net short in index futures. As a next step, follow the next three sessions of FII and DII data and the NSDL final figures before changing your positions. More analysis is on our blog.
Sources: Business Standard, 6 Nov 2026; HDFC Sky market close report, 6 Nov 2026; Angel One, November 2026; NiftyTrader FII derivatives data; NSE provisional FII/DII data.
Disclaimer: This article is for educational purposes only and is not investment advice. Please consult a SEBI-registered advisor before making investment decisions.