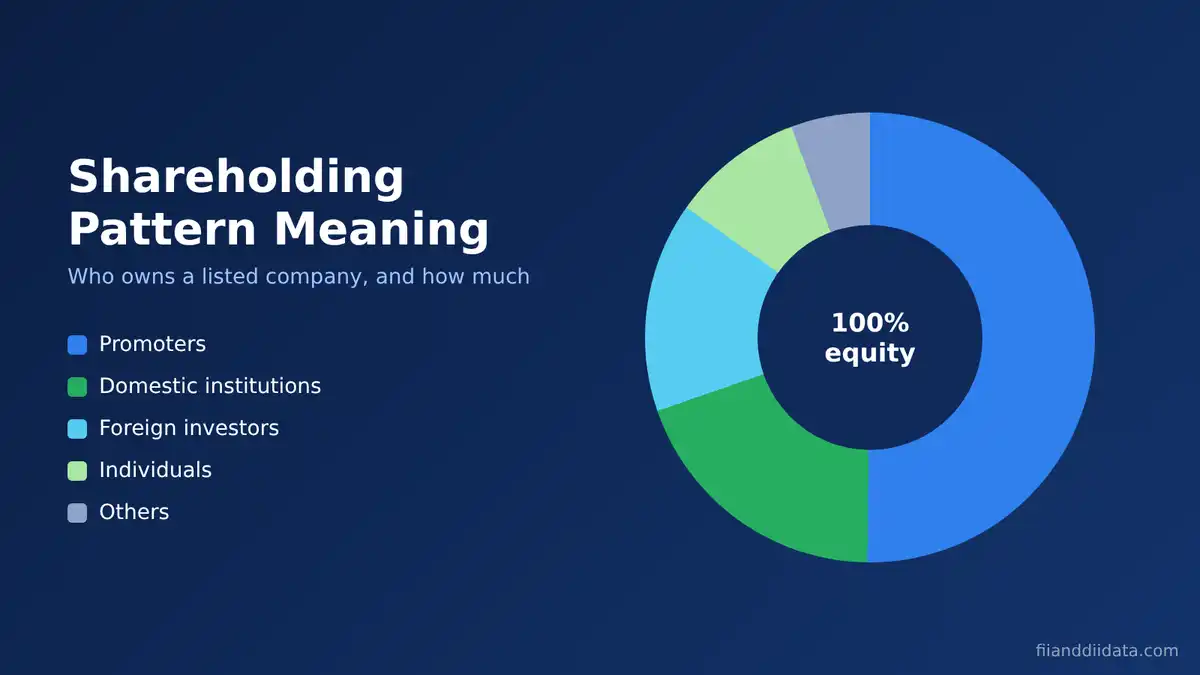
The shareholding pattern meaning is simple: it is a quarterly table that shows who owns a listed company and in what proportion, split between promoters and the public. It matters because ownership is shifting fast. In the June 2026 quarter, foreign portfolio investors held just 15.1% of NSE-listed companies, a 69-quarter low, while domestic institutions held 19.5%, according to NSE. This guide explains every block of the table and how to read it.
Key Takeaways
- A shareholding pattern splits a company’s equity into the promoter group and the public, with institutions and individuals shown inside the public block.
- Listed companies file it every quarter within 21 days of quarter end under SEBI LODR Regulation 31.
- In June 2026, promoters held 50.2% of NSE-listed companies, DIIs 19.5%, FPIs 15.1% and individuals 9.5% directly.
- Pledged promoter shares sit in the same filing and are often the most important number to check.
- One quarter tells you little. Read four quarters together and compare with the share price.
In this guide
- Shareholding Pattern Meaning: What the Table Shows
- The Structure: Promoter, Public and Non-Public Groups
- Why the Shareholding Pattern Matters
- Shareholding Pattern Meaning in Numbers: India Inc in June 2026
- How to Read a Shareholding Pattern in 5 Steps
- Worked Example: Reading One Company Over Two Quarters
- Green Flags, Red Flags and Common Mistakes
- FAQs
- The Bottom Line
Shareholding Pattern Meaning: What the Table Shows
Every listed company in India is owned by thousands of shareholders. The shareholding pattern groups them into categories so an investor can see, in one table, how much belongs to the founders, how much to institutions such as mutual funds and foreign funds, and how much to ordinary individuals.
Think of it as an ownership map. The share price tells you what the market thinks a company is worth. The shareholding pattern tells you who is actually holding the shares at that price, and whether those holders are getting more or less committed over time.
Shareholding pattern meaning in plain words
Three terms do most of the work. Promoters are the founders, parent companies or the government that control the business. The public is everyone else who owns shares, including large institutions. Pledged shares are promoter shares given as security for a loan. If you understand these three, you can read most of the filing.
Next, let us look at how the official format arranges these groups.
The Structure: Promoter, Public and Non-Public Groups
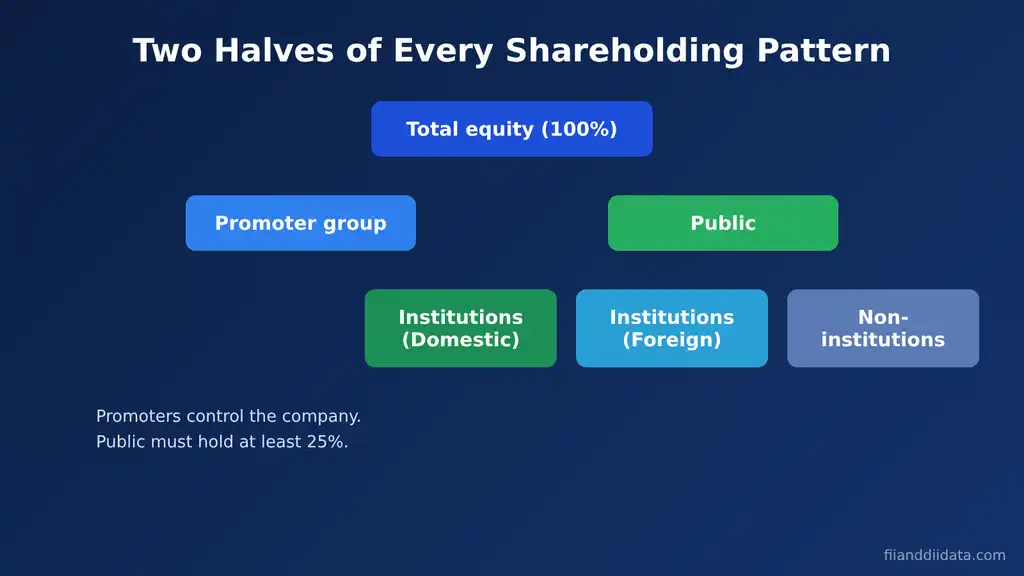
SEBI prescribes a standard format so every company reports in the same way. The summary table divides equity into three top-level categories: Promoter and Promoter Group, Public, and Non-Promoter Non-Public. Detailed tables then break each category down.
| Category | Who is inside | What to look for |
|---|---|---|
| Promoter and Promoter Group | Founders, their families, holding companies, the government in PSUs, foreign parent companies | Size of stake, quarterly change, pledged or encumbered shares |
| Public: Institutions (Domestic) | Mutual funds, banks, insurance companies, provident and pension funds, alternative investment funds | Steady buying by mutual funds and insurers |
| Public: Institutions (Foreign) | Foreign portfolio investors (Category I and II), foreign direct investors, sovereign funds | Trend over several quarters; room left under foreign limits |
| Public: Non-Institutions | Resident individuals, HNIs, NRIs, corporate bodies, trusts, IEPF | Rising retail share during a falling price |
| Non-Promoter Non-Public | Shares held by employee benefit trusts and custodians of depository receipts | Usually small; check after ESOP changes |
Since the quarter ended 30 September 2022, under a SEBI circular dated 30 June 2022, the format names every public shareholder holding 1% or more and includes a table on foreign ownership limits. For the foreign rows in detail, read our guide to the FII shareholding pattern.
The minimum public shareholding rule
Under the Securities Contracts (Regulation) Rules, 1957, a listed company must keep at least 25% of its shares with the public. This is why promoter holding in most companies stops at 75%. A March 2026 amendment (G.S.R. 184(E), dated 13 March 2026) gave very large new listings longer, staged timelines to reach 25%, up to 10 years in some cases, as summarised by law firm AZB & Partners. Now that the layout is clear, the next question is why any investor should care.
Why the Shareholding Pattern Matters
Ownership changes slowly, but it reveals intent. A promoter who keeps adding shares is backing the business with personal money. A promoter who sells or pledges heavily may need cash. Institutions spend large sums on research, so their buying and selling over several quarters is a useful second opinion.
- Control and alignment: a meaningful promoter stake means the people running the company share the gains and the losses with you.
- Pledge risk: if a pledged stock falls sharply, lenders can sell the shares, which pushes the price down further.
- Liquidity: stocks with a large public float and institutional holders usually trade more easily.
- Flow sensitivity: a stock with heavy FII ownership reacts more to global events, the rupee and US yields.
- Support in sell-offs: a rising domestic institutional base can absorb foreign selling, as 2026 showed.
The data does not tell you what to buy. It tells you who you are standing next to as a shareholder. The latest market-wide numbers show how that group has changed.
Shareholding Pattern Meaning in Numbers: India Inc in June 2026
NSE publishes a quarterly ownership tracker built from company filings. Its June 2026 edition, released in August 2026, covers all NSE-listed companies as of 30 June 2026. The headline: promoters still own about half of India Inc, and domestic money now clearly outweighs foreign money.
| Owner group (NSE-listed companies) | Share, June 2026 | Change vs March 2026 |
|---|---|---|
| Promoters (total) | 50.2% | +21 bps |
| Private Indian promoters | 32.1% | +29 bps |
| Government as promoter | 9.75% | -53 bps |
| Foreign promoters | 8.9% | +46 bps |
| Domestic institutions (DIIs) | 19.5% | -8 bps |
| Domestic mutual funds (within DIIs) | 11.6% | +35 bps |
| Foreign portfolio investors (FPIs) | 15.1% | -74 bps |
| Individuals (direct holding) | 9.5% | +36 bps |
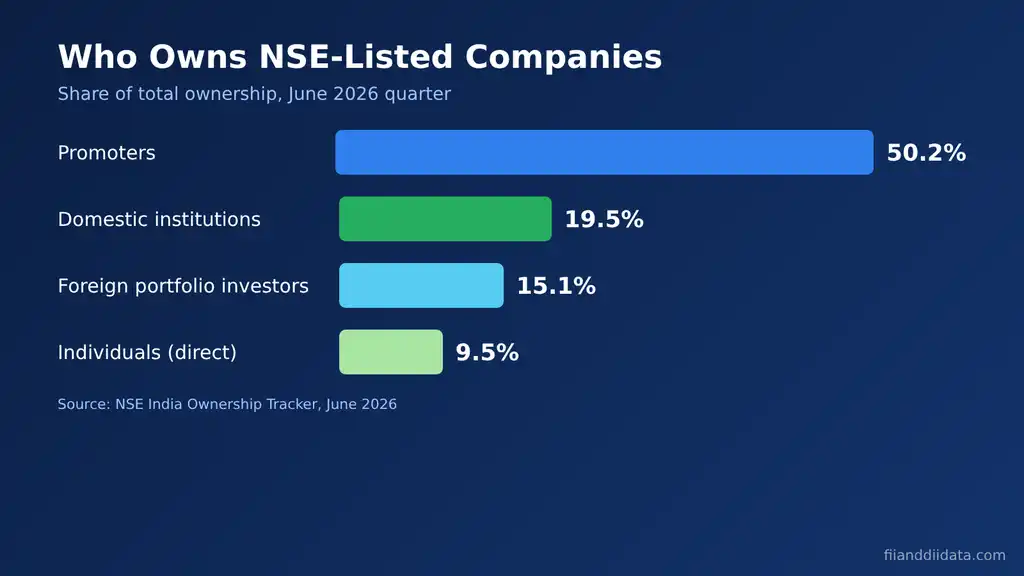
Three points stand out. First, the FPI share of 15.1% was the lowest in 69 quarters, after record FPI outflows of US$15.1 billion in the quarter. Second, domestic mutual funds raised their share for the 12th quarter in a row to a record 11.6%. Third, when holdings through mutual funds are added, individuals owned a record 19.3% of the market, more than FPIs for the seventh straight quarter. Business Standard reported the same 15.1% and 19.5% figures on 17 August 2026.
In the Nifty 50, the picture is similar: promoters held 40.4% and FPIs 21.1% in June 2026, the latter a 14.5-year low. For stock-level examples of domestic buying, see our list of stocks where DIIs increased their stake. With the big picture in hand, here is how to read the table for a single company.
How to Read a Shareholding Pattern in 5 Steps
Companies must file the pattern one day before listing, every quarter within 21 days of quarter end, and within 10 days of any capital restructuring, as set out in SEBI LODR Regulation 31. The same regulation requires all promoter shares to be held in demat form. So the September 2026 quarter data was due by 21 October 2026 and is already available.
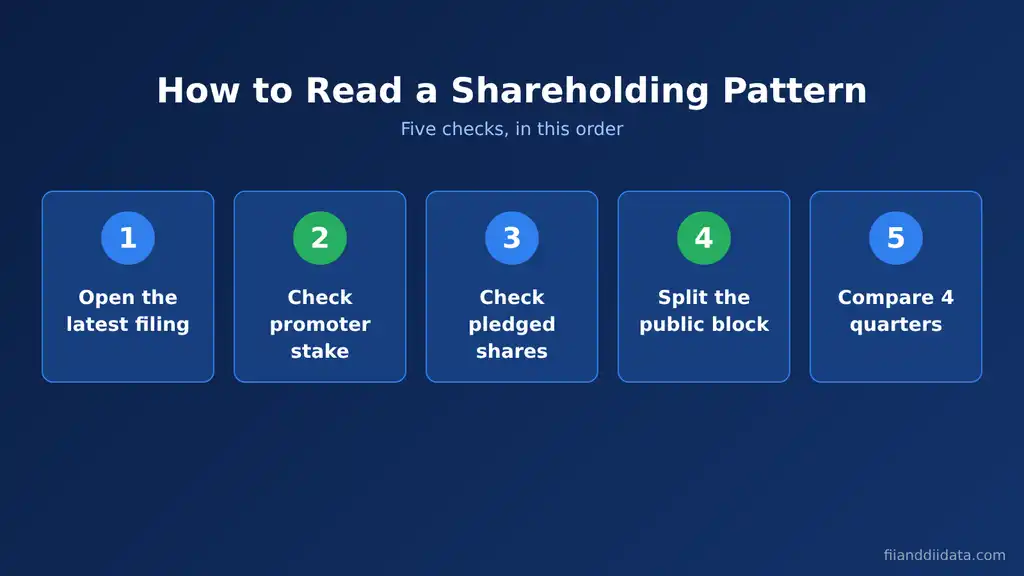
- Open the latest filing. Search the company on nseindia.com or bseindia.com and open the shareholding pattern under corporate filings. Use the full tables, not only the summary.
- Check the promoter stake. Note the percentage and the change from the previous quarter. Read any promoter reclassification note.
- Check pledged shares. Look at the encumbered column for promoters. Express it as a share of promoter holding and of total equity.
- Split the public block. Separate domestic institutions, foreign institutions and individuals, and scan the 1%-plus holders list for named funds.
- Compare four quarters. Put the numbers side by side and match them against the price chart for the same period.
How to read shareholding pattern changes alongside flows
Quarterly holdings show where money settled. Daily flows show how it moved. Pairing the two helps. Our FII DII data today page tracks the NSE provisional cash market figures released after market close. The worked example below applies the five steps to sample numbers.
Worked Example: Reading One Company Over Two Quarters
Take a hypothetical company, ABC Ltd, with 80 crore shares in issue and a share price of ₹400. Its market value is ₹32,000 crore. The filings show the following:
| Item | June 2026 quarter | September 2026 quarter |
|---|---|---|
| Promoter holding | 55.0% (44 crore shares) | 52.5% (42 crore shares) |
| Promoter shares pledged | 12 crore | 12 crore |
| Public holding | 45.0% | 47.5% |
Step 1, the promoter change: the stake fell 2.5 percentage points. That is 2 crore shares, worth about ₹800 crore at ₹400.
Step 2, the pledge ratio: 12 crore pledged shares were 27.3% of promoter holding in June. Because the pledge did not change while the holding fell, the ratio rose to 28.6% in September. Pledged shares equal 15% of total equity.
Step 3, the disclosure trigger: under SEBI Takeover Regulation 31, promoters must disclose the creation, release or invocation of a pledge within seven working days. They must also give detailed reasons once total encumbrance reaches 50% of their holding or 20% of the company’s share capital. ABC is below both lines, but rising toward them is a warning sign.
Step 4, the free float: public holding of 47.5% means shares worth about ₹15,200 crore are with the public. A larger float usually means better liquidity and a higher index weight.
Step 5, the verdict: a promoter sale plus a steady pledge is not automatically bad. It could fund a debt cut. But if the price also fell and institutions sold, the combination deserves caution. The next section lists the patterns that matter most.
Green Flags, Red Flags and Common Mistakes
Green flags
- Promoter stake rising, or stable at a healthy level, with no pledge.
- Mutual fund and insurance holdings rising over three or four quarters.
- New well-known funds appearing in the 1%-plus holders list.
- Pledge being reduced or released.
Red flags
- Pledged shares rising as a share of promoter holding.
- Promoters selling for several quarters while the price is falling.
- Institutions exiting while retail holding jumps, a sign that the selling is going to less informed buyers.
- Frequent reclassification of promoters or sudden changes in the promoter group.
Common mistakes when reading the table
- Ignoring dilution. After a QIP, rights issue or merger, a stake can fall in percentage terms even if the number of shares stayed the same. Check share counts.
- Treating a high promoter stake as always good. It can also mean a small float, low liquidity and limited institutional interest.
- Reading one quarter. A single change can come from one fund rebalancing.
- Using it for trading. The data can be up to 21 days old when it arrives, so it is a slow, long-term signal.
- Mixing FDI and FPI. A foreign parent is a promoter-like holder, not portfolio money.
Retail ownership deserves its own lens. Our study of retail investors versus FIIs shows how the two groups behave differently in a sell-off, and our explainer on the difference between FII and DII covers the institutional side.
FAQs
What is the shareholding pattern meaning in the stock market?
It is the quarterly breakdown of who owns a listed company. It shows the percentage held by promoters and by the public, with the public split into domestic institutions, foreign institutions and non-institutional holders such as individuals.
How often is the shareholding pattern updated?
Every quarter. Under SEBI LODR Regulation 31, companies file it within 21 days of the quarter end, one day before listing, and within 10 days of any capital restructuring. SME-listed companies file every half year.
What is a good promoter holding percentage?
There is no fixed number. A stable or rising stake without pledges is usually read as a positive sign. Promoter holding cannot exceed 75% for long because listed companies must keep at least 25% with the public.
Why do promoters pledge shares?
Promoters pledge shares as collateral to raise loans, often for the group or for personal needs. Heavy pledging is risky because lenders can sell the shares if the price falls, which can push it lower.
Where can I check the shareholding pattern of a company?
Open the company page on nseindia.com or bseindia.com and go to the shareholding pattern under corporate filings. Company investor pages and broker apps also show it, but the exchange filing is the primary source.
The Bottom Line
A shareholding pattern is the most direct record of who owns a company and how committed they are. Promoter stake and pledges tell you about the people in control. The split between domestic institutions, foreign funds and individuals tells you who supports the stock and who may sell in a shock.
The 2026 data shows why this matters now. Foreign ownership of NSE-listed companies fell to 15.1% in June 2026 while domestic mutual funds hit a record. Stocks that depend on foreign money behave differently from those backed by steady domestic buying.
A practical next step: pick two stocks you own, pull four quarters of shareholding data from NSE or BSE, and note the promoter, pledge and institutional trends. Then compare them with market-wide FII and DII data. You can find more guides on the FIIAndDIIData.com blog.
Sources: NSE India Ownership Tracker, June 2026 edition (Aug 2026); Business Standard (17 Aug 2026); SEBI LODR Regulation 31; SEBI SAST Regulation 31; AZB & Partners note on SCRR Amendment Rules 2026 (28 Apr 2026); SEBI circular SEBI/HO/CFD/PoD-1/P/CIR/2022/92 (30 Jun 2022).
Disclaimer: This article is for educational purposes only and is not investment advice. Please consult a SEBI-registered advisor before making investment decisions.