DII selling meaning: it describes a session when domestic institutional investors sell more shares than they buy, so their net cash-market figure turns negative. DIIs include mutual funds, insurers, banks and pension funds. From 2 to 11 November 2026, they were net sellers on all eight reported sessions, offloading about ₹40,504 crore while FIIs bought about ₹65,735 crore.
Key Takeaways
- DII selling means domestic institutions sold more shares than they bought, so the day’s net figure is negative.
- It is not automatically bearish. DIIs often sell into strong foreign buying and rebalance their books.
- From 2 to 11 November 2026, DIIs sold a net ₹40,504 crore, about 62% of what FIIs bought.
- Always read the DII figure next to the FII figure, the Nifty move and the length of the streak.
- NSE data is provisional until the exchange and NSDL numbers settle, so treat the first print as a guide.
- What Is the DII Selling Meaning in Simple Terms?
- Who Sits Behind DII Selling?
- How to Read DII Selling: A Worked Example
- DII Selling in November 2026: What the Data Shows
- Why Do DIIs Sell? Five Common Reasons
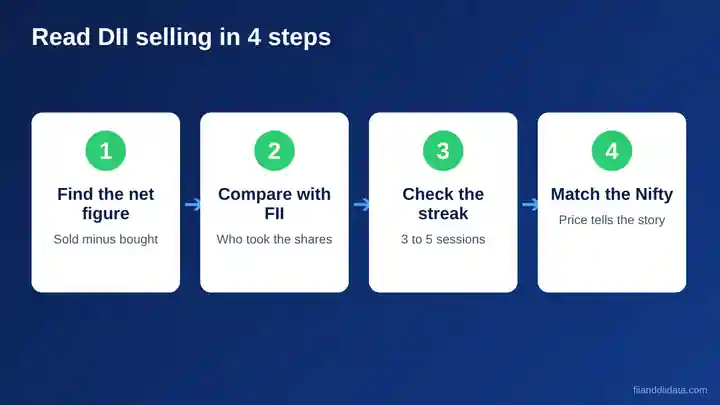
- A 4-Step Checklist for Reading DII Selling
- Common Mistakes When Reading DII Selling
- DII Selling vs FII Selling: Key Differences
- FAQ
- The Bottom Line
What Is the DII Selling Meaning in Simple Terms?
Every trading day, the exchanges publish how much each investor group bought and sold in the cash market. The DII line shows the net result for domestic institutions. If they bought ₹8,000 crore and sold ₹10,000 crore, the DII net figure is minus ₹2,000 crore. That negative number is what the market calls DII selling.
The idea is the mirror image of what we cover in our guide to what DII buying means. A negative net figure shows that domestic institutions were supplying shares to the market on that day. It does not tell you why, and it does not tell you whether prices will rise or fall next.
DII selling meaning for traders
For traders, the sign and the size both matter. A small negative figure on a quiet day is routine, because funds trim positions all the time. A large negative figure, especially when it repeats for several days, tells you that a big domestic seller is active and that someone else, often foreign funds, is absorbing the supply.
Next, it helps to know exactly who these sellers are.
Who Sits Behind DII Selling?
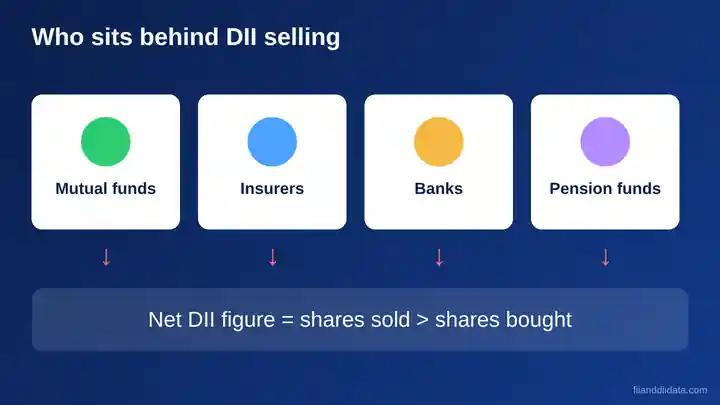
DII is a broad label. It covers four main groups of Indian institutions that invest large pools of money in shares. Each group sells for different reasons, which is why one DII number can hide several different stories.
- Mutual funds: the biggest group. They invest money from monthly SIPs and lump sums, and they sell when investors redeem or when fund managers rebalance.
- Insurance companies: they invest policyholder money in shares within regulated limits and sell to stay inside those limits.
- Banks: they hold equity mainly through treasury and investment arms, and trade less actively than funds.
- Pension funds and other domestic institutions: long-horizon investors that adjust holdings gradually.
For a fuller comparison with foreign investors, see our explainer on the difference between FII and DII.
How to Read DII Selling: A Worked Example
Use 5 November 2026, the heaviest DII selling day of the month so far, as a working example. NSE provisional data, as reported by Tapetide, shows FIIs bought a net ₹14,974.68 crore and DIIs sold a net ₹10,444.54 crore. Here is how to read those two numbers in three steps.
- Find the sign. DII net is minus ₹10,444.54 crore, so this was DII selling. FII net is plus ₹14,974.68 crore, so foreign funds were buyers.
- Add the two. ₹14,974.68 crore minus ₹10,444.54 crore gives a combined institutional net of plus ₹4,530.14 crore. Institutions together were still buyers.
- Measure the absorption. Divide DII selling by FII buying: 10,444.54 ÷ 14,974.68 is about 70%. Roughly seven of every ten rupees of foreign buying were met by domestic selling.
That last step is the one most articles skip, and it is the most useful. A high absorption share says the foreign demand was met largely by domestic supply, so the Nifty may not have needed fresh retail or institutional money to move higher.
Now let us apply the same method to the full month.
DII Selling in November 2026: What the Data Shows
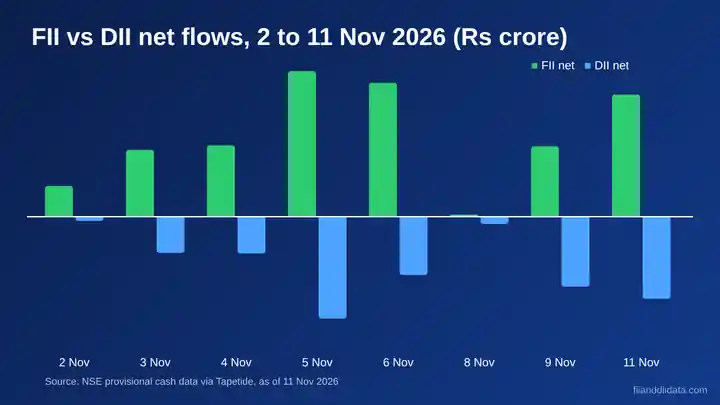
The table below lists every reported session from 2 to 11 November 2026. All eight sessions show DII selling. Over the period, DIIs sold a net ₹40,503.89 crore, while FIIs bought a net ₹65,735.32 crore, leaving institutions together at a net ₹25,231.43 crore of buying.
| Date | FII net (₹ crore) | DII net (₹ crore) | Combined (₹ crore) |
|---|---|---|---|
| 2 Nov 2026 | +3,114.68 | -392.20 | +2,722.48 |
| 3 Nov 2026 | +6,836.81 | -3,678.85 | +3,157.96 |
| 4 Nov 2026 | +7,284.03 | -3,712.23 | +3,571.80 |
| 5 Nov 2026 | +14,974.68 | -10,444.54 | +4,530.14 |
| 6 Nov 2026 | +13,749.82 | -5,968.70 | +7,781.12 |
| 8 Nov 2026 | -0.25 | -700.31 | -700.56 |
| 9 Nov 2026 | +7,212.22 | -7,172.53 | +39.69 |
| 11 Nov 2026 | +12,563.33 | -8,434.53 | +4,128.80 |
| 2 to 11 Nov total | +65,735.32 | -40,503.89 | +25,231.43 |
Four numbers stand out. DII selling averaged about ₹5,063 crore a session. Four of the eight sessions crossed ₹5,000 crore: 5 Nov (₹10,445 crore), 11 Nov (₹8,435 crore), 9 Nov (₹7,173 crore) and 6 Nov (₹5,969 crore). On 11 November, DIIs absorbed about 67% of FII buying, and over the whole period the figure was about 62%. For day-by-day updates, check our FII DII data today page after 6 PM IST.
You can also read the full breakdown of the record DII selling day on 5 November.
Why Do DIIs Sell? Five Common Reasons
No official body explains why DIIs sell on a given day, and the November 2026 selling has no confirmed single cause. The reasons below are the common ones that market participants and analysts cite for DII selling in general. Treat them as a checklist of possibilities, not as findings about any one session.
| Reason | What happens | What to watch |
|---|---|---|
| Profit booking after a rally | Funds sell winners after a sharp rise to lock in gains | Nifty up strongly in the previous days |
| Supplying shares to foreign buyers | DIIs sell into heavy FII demand at higher prices | FII net buying high on the same day |
| Redemptions and rebalancing | Funds sell to meet investor withdrawals or to restore target weights | Month-end and quarter-end sessions |
| Equity limits at insurers and hybrid funds | Higher prices push equity above allowed limits, forcing sales | Sustained selling after a steady market rise |
| Raising cash for new issues | Funds free up money for IPOs, follow-on offers or block deals | Busy primary market calendar |
Notice that most of these reasons are neutral. They describe how large funds manage money, not a loss of faith in Indian shares. That is why DII selling alone rarely justifies a bearish call.
Next, here is a simple routine to turn the raw numbers into a view.
A 4-Step Checklist for Reading DII Selling
We use the same four checks every evening when the NSE provisional data arrives. They take about two minutes and keep the focus on context, not on one scary number.
- Check the size. As a working rule, we call DII selling heavy above ₹5,000 crore in one session. This is our own yardstick, not an official threshold.
- Check the FII side. Is foreign money buying or selling? DII selling with FII buying is a handover. DII selling with FII selling is a stress signal.
- Check the streak. One day is noise. Three or more sessions in a row deserve attention, and eight in a row, as in early November 2026, is a clear pattern.
- Check the price. If the Nifty rises while DIIs sell, the market is absorbing supply well. If it falls while both groups sell, be careful.
If you are new to reading these tables, our guide on how to check FII DII data walks through the official sources step by step.
Common Mistakes When Reading DII Selling
Most misreadings come from a handful of habits. Avoid these and your read of the data will already be better than most social media posts.
- Treating DII selling as bearish by default. On 5 November 2026 the DII figure was the most negative of the month, yet institutions together were net buyers.
- Reading provisional data as final. NSE’s first print comes around 6 PM IST on trading days, and figures can be refined later.
- Ignoring the FII column. The same DII number means different things depending on whether foreigners are buying or selling.
- Judging from one session. A single large day can reflect a block trade or month-end rebalancing, not a trend.
- Comparing raw numbers across years. Market size has grown, so scale the figure against turnover or the Nifty move before calling anything a record.
One more comparison is worth making before you act: how DII selling differs from FII selling.
DII Selling vs FII Selling: Key Differences
Both groups can sell, but the meaning, motive and market impact differ. The table sets the contrast side by side.
| Feature | DII selling | FII selling |
|---|---|---|
| Who sells | Indian mutual funds, insurers, banks, pension funds | Overseas funds registered as foreign portfolio investors |
| Main drivers | Rebalancing, redemptions, equity limits, profit booking | Global rates, dollar strength, risk appetite, rupee moves |
| Currency impact | None directly, as flows stay in rupees | Can pressure the rupee when money leaves India |
| Typical reading | Often a portfolio decision, frequently neutral | More often read as a sentiment signal for the Nifty |
| Data source | NSE provisional cash data, after market close | NSE provisional data, then NSDL final data next working day |
For the foreign side of the story, read our analysis of FII selling versus DII buying in 2026, and track monthly totals on our FII DII monthly data page.
FAQ
What is the DII selling meaning?
DII selling means domestic institutional investors, such as mutual funds, insurers, banks and pension funds, sold more shares than they bought in the cash market on a day, so their net figure is negative.
Is DII selling good or bad for the market?
Neither by default. DII selling can be profit booking or rebalancing, and it is often absorbed by foreign buying. It becomes a worry when it continues while prices fall and FIIs are selling too.
Why are DIIs selling while FIIs are buying?
No official reason is published. Common explanations are profit booking after a rally, fund redemptions, equity limits at insurers and hybrid funds, and DIIs supplying shares to heavy foreign demand.
How much did DIIs sell in November 2026?
Based on NSE provisional data via Tapetide, DIIs sold a net ₹40,503.89 crore across eight sessions from 2 to 11 November 2026, while FIIs bought a net ₹65,735.32 crore.
When is DII selling data released?
NSE publishes provisional FII and DII cash-market data around 6 PM IST on each trading day. NSDL publishes final FPI data on the next working day. The figures are not available during market hours.
The Bottom Line
DII selling is a routine part of how large Indian funds manage money, and the November 2026 numbers show why context matters. DIIs sold on every reported session from 2 to 11 November, yet foreign buying was larger, and institutions together stayed net buyers.
As a practical next step, open the FII and DII data page after 6 PM IST, compute the absorption share for the day, and note whether the streak is growing. Those three habits will tell you more than any single headline figure.
Sources: NSE India; NSDL FPI Monitor; Tapetide FII DII flows report, November 2026; Business Standard, 5 Nov 2026.
Disclaimer: This article is for educational purposes only and is not investment advice. Please consult a SEBI-registered advisor before making investment decisions.