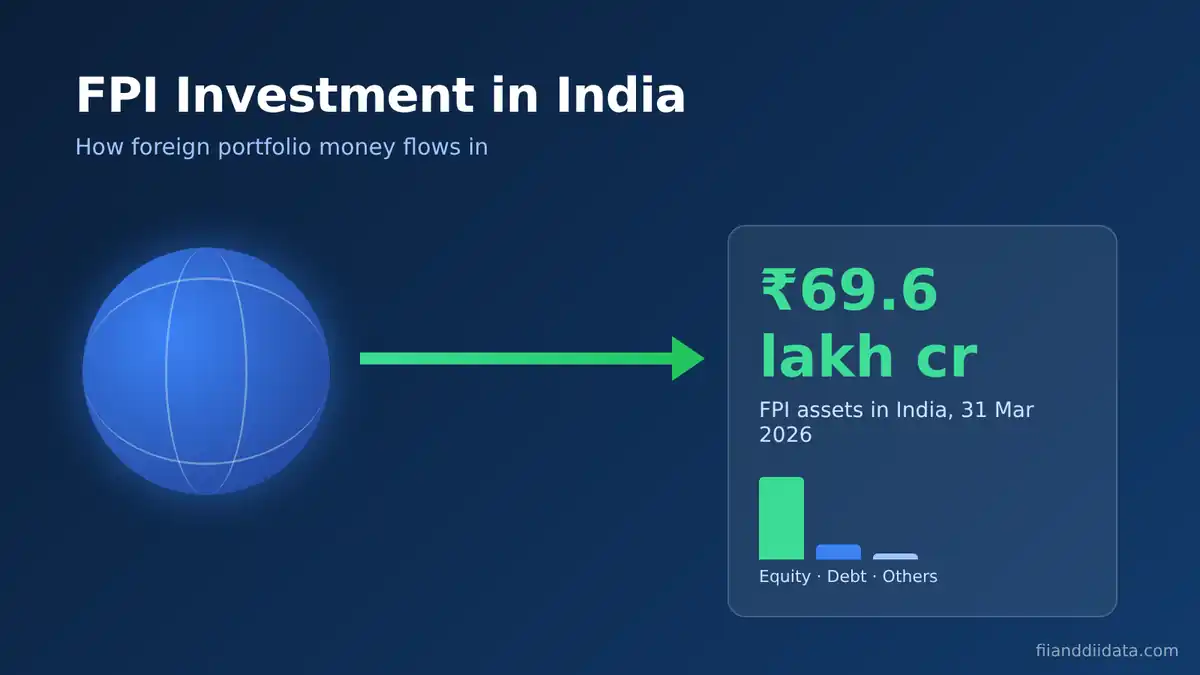
FPI investment in India is the money that registered foreign funds put into Indian shares, bonds and fund units without seeking control of any company. As of 31 March 2026, foreign portfolio investors held assets worth ₹69,57,108 crore in India, according to SEBI, yet 2026 has also seen a record equity exit of ₹3.08 lakh crore by 12 October. This guide explains how that money comes in, where it goes and how to track it.
Key Takeaways
- FPIs held ₹69.57 lakh crore of Indian assets on 31 March 2026, and about 90% of it was in equity (SEBI).
- A single FPI must stay below 10% of a listed company’s paid-up capital; the combined FPI limit equals the sector cap.
- FY 2025-26 saw a record net FPI outflow of ₹1,52,692 crore, with equity down ₹1,80,832 crore and debt up ₹25,807 crore.
- US-based investors account for about 40.7% of all FPI assets in India.
- NSDL publishes daily FPI flows; NSE’s provisional FII figures come around 6 PM IST on trading days.
In this guide:
- What FPI investment in India means
- How FPIs invest in India: routes and instruments
- FPI investment limits and rules in 2026
- FPI investment in India: the latest data
- Worked example: rupee, returns and the 10% cap
- How to track FPI flows: a 5-step checklist
- Common mistakes when reading FPI data
- FPI vs FDI and other related terms
- FAQs
- The Bottom Line
What FPI Investment in India Means
A foreign portfolio investor (FPI) is an overseas entity, such as a pension fund, sovereign fund, mutual fund, insurer or hedge fund, that is registered with SEBI to buy Indian securities. The word “portfolio” is the key. These investors buy small, tradable stakes for returns, not to run the business. If you want the background on the label itself, our guide on what an FPI is and how it differs from an FII covers the history.
FPI investment in India covers far more than shares. It includes government bonds, corporate bonds, units of Indian mutual funds, REITs, InvITs and exchange-traded derivatives. SEBI counted 12,199 registered FPIs on 31 March 2026, up 333 from a year earlier.
Why FPI investment in India matters to ordinary investors
FPIs move large sums quickly, so their buying or selling shows up in the Nifty, in bank and IT stocks, and in the rupee. When they sell heavily, the rupee usually weakens because they convert rupees back to dollars. When they buy, large caps often lead the rally. That is why traders check FII and DII data every evening. The next section shows the exact channels this money uses.
How FPIs Invest in India: Routes and Instruments
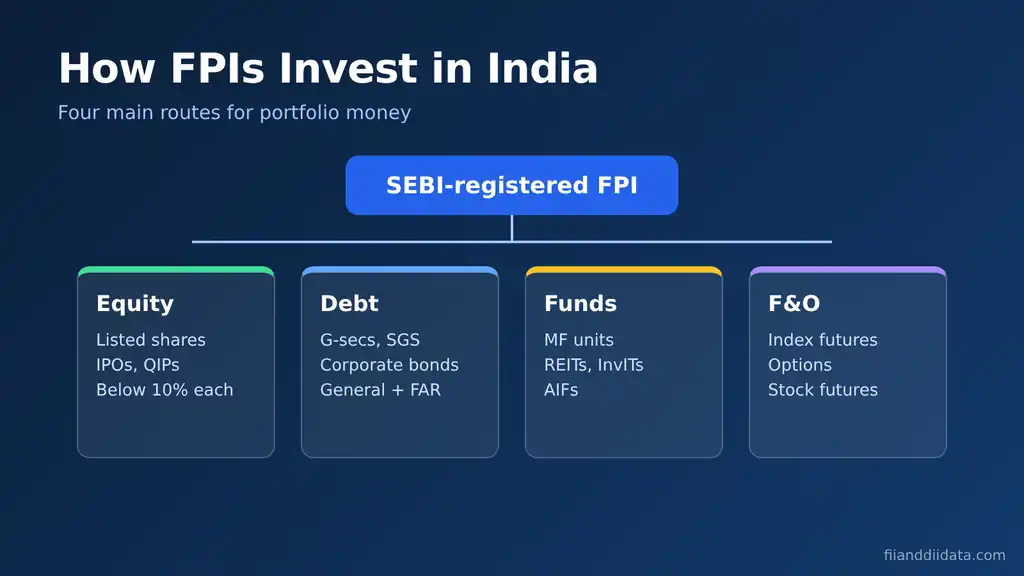
Before buying anything, a foreign fund must register with SEBI through a Designated Depository Participant, open a custody account and a rupee bank account, and complete KYC. Our step-by-step guide to the FPI registration process explains the paperwork and fees. Once registered, money enters through these routes.
| Route | What FPIs buy | Key condition |
|---|---|---|
| Equity (stock exchange) | Listed shares bought on NSE or BSE | Below 10% of a company per FPI group |
| Equity (primary market) | IPOs, QIPs, anchor book, preferential issues | Price not below the price offered to residents |
| Debt: General Route | G-secs, state bonds, corporate bonds | Limits of 6%, 2% and 15% of outstanding stock |
| Debt: Fully Accessible Route (FAR) | Specified government bonds | No investment cap on these bonds |
| Funds and trusts | Mutual fund units, REITs, InvITs, AIFs | As permitted by SEBI and RBI |
| Derivatives | Index and stock futures and options | Exchange position limits apply |
One 2026 change matters here. From 1 April 2026, RBI folded the Voluntary Retention Route (VRR) into the General Route, so all VRR holdings now count against General Route limits. FAR bonds are still counted separately. With the routes clear, the next question is how much any one investor can own.
FPI Investment Limits and Rules in 2026
Limits keep portfolio money from turning into control. There are two layers in equity and one set of caps in debt.
- Individual limit: one FPI, together with its investor group, must hold less than 10% of a listed company’s total paid-up capital on a fully diluted basis.
- Aggregate limit: since 1 April 2020, all FPIs together can own up to the sectoral cap that applies to the company. Where FDI is prohibited, the aggregate cap is 24%.
- Breach rule: if an FPI crosses 10%, it can sell the excess within five trading days of settlement. If it does not, its whole holding is treated as FDI.
- Debt caps for FY 2026-27: 6% of outstanding G-secs, 2% of state bonds and 15% of corporate bonds. In rupee terms, the total debt limit is ₹16,32,640 crore for October 2026 to March 2027.
How FPI investment in India is taxed
Gains are taxed under section 115AD. As per the Income Tax Department’s page on special rates (as amended by the Finance Act, 2026), short-term gains on listed shares where STT is paid are taxed at 20%. Long-term gains on such shares are taxed at 12.5% on the amount above ₹1.25 lakh. Treaty benefits can change the final outgo, so funds work with Indian tax advisers. Now let us look at what the money has actually done.
FPI Investment in India: The Latest Data
The stock of FPI money is large, but the flow has turned sharply negative. SEBI’s annual data shows the size, while NSDL’s flow data shows the direction.
| Metric | Value | Period |
|---|---|---|
| FPI assets under custody (total) | ₹69,57,108 crore | 31 March 2026 |
| Of which equity | ₹62,46,545 crore (89.8%) | 31 March 2026 |
| Of which debt | ₹6,41,933 crore (9.2%) | 31 March 2026 |
| Assets under custody a year earlier | ₹73,76,495 crore | 31 March 2025 |
| Net FPI investment, all segments | -₹1,52,692 crore | FY 2025-26 |
| Net equity investment | -₹1,80,832 crore | FY 2025-26 |
| Net debt investment | +₹25,807 crore | FY 2025-26 |
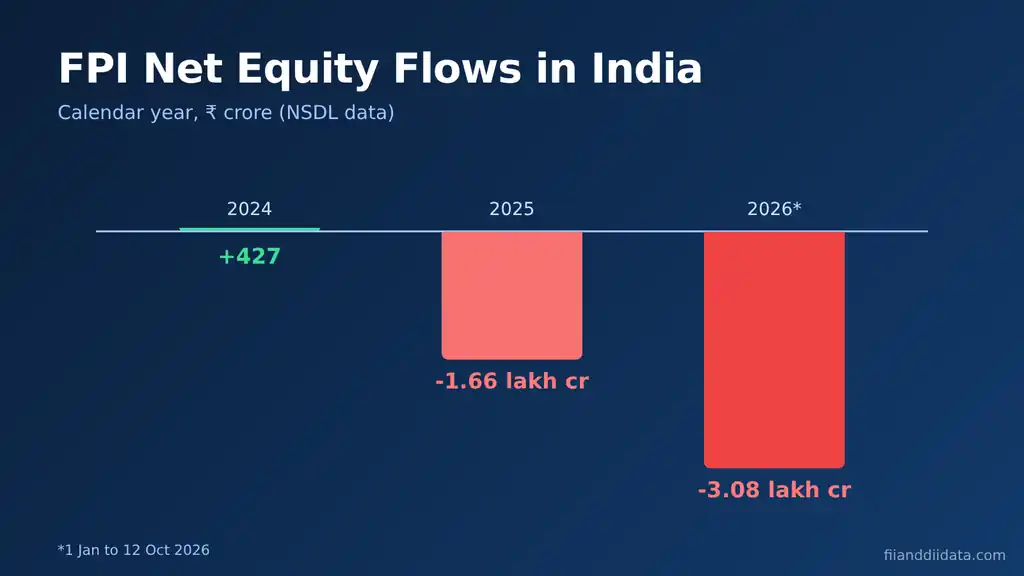
| Net equity investment | -₹3.08 lakh crore | 1 Jan to 12 Oct 2026 |
| Primary market equity (within the above) | +₹56,485 crore | 1 Jan to 12 Oct 2026 |
| Net equity investment | -₹1.66 lakh crore | Calendar 2025 |
| Net equity investment | +₹38,971 crore | Week to 6 Nov 2026 |
Three points stand out. First, total FPI assets fell 5.7% in FY 2025-26 even though India’s market is bigger than ever. Second, FPIs kept buying IPOs and QIPs while selling in the secondary market, which shows they wanted specific new issues rather than the broad index. Third, the ₹38,971 crore weekly inflow in early November, driven by a global AI stock sell-off, is a reminder that this money can reverse fast. Our tracker of month-wise FPI outflow in 2026 shows how each month added up.
Where the money comes from
By country, the United States leads with ₹28,35,018 crore, about 40.7% of all FPI assets on 31 March 2026. Singapore follows at 8.1%, Luxembourg at 7.3% and Mauritius at 4.5%, per SEBI. So US interest rates and US fund flows matter more for Indian markets than any other single foreign factor. Ownership has also shrunk: NSE’s Market Pulse report (May 2026) put FPI ownership of NSE-listed companies at 15.8% for the March 2026 quarter, a 17-year low.
Worked Example: Rupee, Returns and the 10% Cap
Numbers make the rules easier to see. Here is a simple, hypothetical case of one fund.
Currency effect. A US fund brings $100 million into Indian shares when the rupee is at 88 per dollar. That buys ₹880 crore of stock. Over a year the portfolio rises 10% to ₹968 crore. But if the rupee weakens to 95 per dollar, the fund gets back only about $101.9 million. A 10% gain in rupees becomes roughly a 1.9% gain in dollars. This is why a falling rupee often triggers more FPI selling.
Stake cap. Now say the fund likes a listed company with 50 crore shares. Its group can hold fewer than 5 crore shares (below 10%). If a block purchase takes it to 5.2 crore shares, it has five trading days after settlement to sell at least the extra 0.2 crore shares and drop back below the cap. Otherwise its full stake is reclassified as FDI.
Tax. If the fund later sells shares held for more than a year at a long-term gain of ₹10 crore, tax at 12.5% on the gain above ₹1.25 lakh comes to about ₹1.25 crore, before any treaty relief. With the mechanics clear, here is how you can follow these flows yourself.
How to Track FPI Flows: A 5-Step Checklist
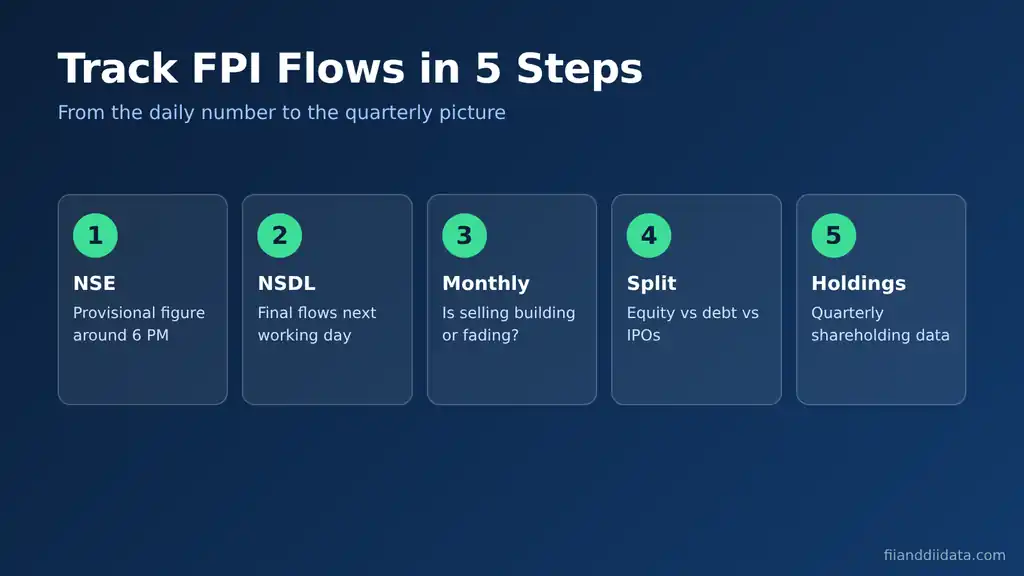
- Check the evening provisional number. NSE releases provisional FII and DII cash figures around 6 PM IST on trading days. Our FII DII data today page sums them up each evening.
- Confirm with NSDL the next working day. NSDL’s FPI Monitor shows final flows split into equity, debt, hybrid and fund units, plus stock exchange versus primary market.
- Look at the monthly trend. One day means little. Use our monthly FPI net investment data to see if selling is building or fading.
- Split equity from debt. In FY 2025-26, FPIs sold equity but bought debt. A headline total can hide that.
- Read quarterly shareholding. Company filings each quarter show which stocks FPIs actually held more or less of.
Following these steps in order keeps you from reacting to a single noisy day. Still, many readers trip over the same few errors.
Common Mistakes When Reading FPI Data
- Mixing NSE and NSDL numbers. NSE shows provisional exchange trades by trade date; NSDL shows settled custodial data and includes primary market deals. They will not match. Our explainer on why NSE and NSDL FII figures differ covers the gap.
- Expecting intraday figures. Official FPI figures come only after the market closes. Anything shown during the day is an estimate.
- Ignoring the primary market. Heavy IPO buying can soften a large secondary market sell figure, as the ₹56,485 crore of 2026 primary inflows shows.
- Reading crore and dollar totals as the same. When the rupee moves, rupee and dollar flows can tell different stories.
- Treating one week as a trend. A ₹38,971 crore week does not cancel a ₹3 lakh crore year by itself.
Many of these errors come from mixing up related terms, so the last section lines them up side by side.
FPI vs FDI and Other Related Terms
| Point | FPI | FDI |
|---|---|---|
| Stake size | Below 10% of a listed company | 10% or more, or any unlisted stake |
| Goal | Financial return, easy exit | Long-term control or business role |
| Speed of exit | Can sell on the exchange in a day | Slow, often through strategic sale |
| Effect on markets | Moves indices and the rupee daily | Builds plants, jobs and capacity |
| Regulator focus | SEBI registration, RBI limits | FDI policy, sector approvals |
FII is the older name for the same group and is still used in NSE’s daily reports. DIIs (domestic institutions such as mutual funds and LIC) are the other side of the trade and have absorbed most FPI selling in 2026. You can browse more explainers on our blog.
Frequently Asked Questions
What is FPI investment in India?
It is investment by SEBI-registered foreign funds in Indian shares, bonds, fund units and derivatives, where each investor group holds less than 10% of a listed company. The aim is financial return, not control.
What is the FPI investment limit in a company?
A single FPI and its investor group must stay below 10% of a listed company’s fully diluted paid-up capital. All FPIs together can go up to the sectoral cap, or 24% where FDI is prohibited.
How much money have FPIs invested in India?
SEBI data shows FPI assets under custody of ₹69,57,108 crore on 31 March 2026, of which ₹62,46,545 crore was equity and ₹6,41,933 crore was debt.
Is FPI investment good for the Indian economy?
It adds liquidity, lowers borrowing costs for companies and the government, and supports the rupee when it flows in. The downside is that it can leave quickly, which adds to market and currency swings.
Where can I check daily FPI data?
NSDL’s FPI Monitor publishes daily flows on the next working day, and NSE releases provisional FII figures around 6 PM IST on trading days. Our home page tracks both after the market closes.
The Bottom Line
FPI investment in India is still huge, at close to ₹70 lakh crore of assets, but 2026 has shown how quickly that money can leave. Rules such as the 10% stake cap, sector-linked aggregate limits and debt caps shape where it goes, while the rupee and US rates shape when it moves.
For investors, the useful habit is simple: watch the trend, not the day. Check the evening provisional figure, confirm it with NSDL, and compare it with the monthly picture before changing any position.
Sources: SEBI Annual Report 2025-26, Chapter 6; NSDL FPI Monitor; Business Standard, 13 October 2026; Income Tax Department, special tax rates; RBI A.P. (DIR Series) Circular No. 05, 6 April 2026; ANI, 8 November 2026; NSE Market Pulse, May 2026.
Disclaimer: This article is for educational purposes only and is not investment advice. Please consult a SEBI-registered advisor before making investment decisions.