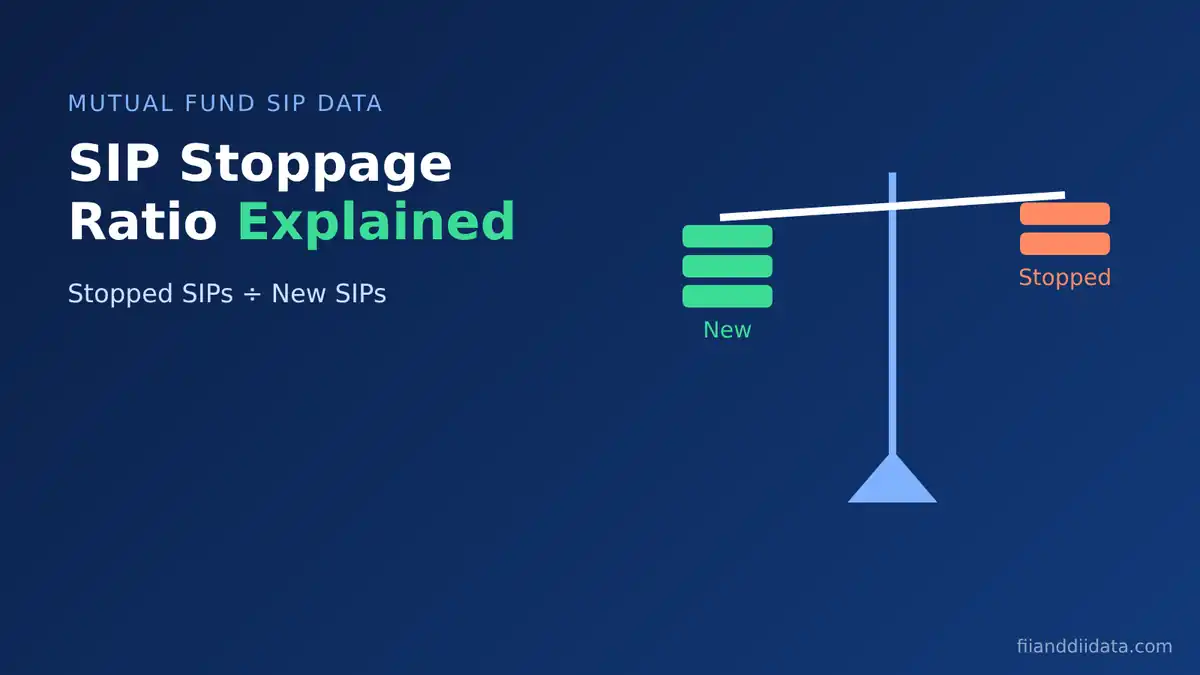
The SIP stoppage ratio tells you how many SIPs were stopped or matured in a month for every 100 new SIPs that were started. In September 2026 the ratio fell to 78.53%, the fifth monthly decline in a row, while SIP contributions hit a record ₹32,490 crore, according to AMFI data released on 13 October 2026. Here is what the number means, how to calculate it and where it misleads.
Key Takeaways
- SIP stoppage ratio = SIPs discontinued or matured in a month ÷ new SIPs registered in the same month.
- September 2026: 49.68 lakh SIPs stopped against 63.26 lakh new registrations, a ratio of 78.53%.
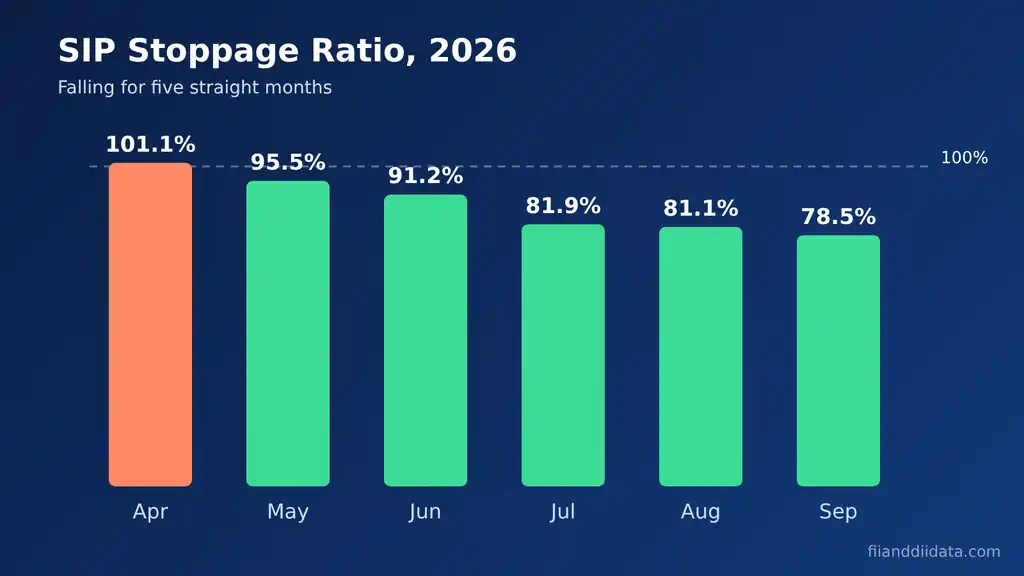
- The ratio fell from about 101% in April 2026 to 78.5% in September 2026.
- A ratio below 100% means the SIP base grew; above 100% means more SIPs closed than opened.
- Always read it with SIP inflows and active SIP accounts, because data clean-ups can distort it.
In this article:
- What Is the SIP Stoppage Ratio?
- How to Calculate the SIP Stoppage Ratio
- SIP Stoppage Ratio Data: April to September 2026
- Why SIPs Are Counted as Stopped
- How to Read the SIP Stoppage Ratio: A 4-Step Checklist
- Common Mistakes When Reading the Data
- SIP Stoppages, DII Flows and the Market
- FAQ
- The Bottom Line
What Is the SIP Stoppage Ratio?
A systematic investment plan (SIP) is a standing instruction to invest a fixed amount in a mutual fund scheme at regular intervals, usually every month. Each month, the Association of Mutual Funds in India (AMFI) publishes two numbers: how many new SIPs were registered and how many SIPs were discontinued or reached the end of their tenure.
The SIP stoppage ratio compares these two flows. It is not an official AMFI metric with its own column. Analysts and media calculate it from AMFI’s monthly figures, which is why you will see slightly different decimals across websites (78.5% in one report, 78.53% in another).
Think of it like a bus. New SIPs are passengers getting on, and stopped SIPs are passengers getting off. A ratio of 78.5% means that for every 100 people who got on in September 2026, about 79 got off. The bus still left the stop fuller than it arrived.
Why the SIP stoppage ratio matters
SIPs are the steady pipe that feeds equity mutual funds, and mutual funds are a major part of domestic institutional investors (DIIs). When foreign investors sell Indian shares, this SIP money is a big part of what absorbs that selling. So a sharp, lasting rise in the stoppage ratio would be an early warning that domestic support for the market is weakening. That is why traders who follow FII and DII data also watch this number. Next, let us see exactly how it is worked out.
How to Calculate the SIP Stoppage Ratio
The formula is simple:
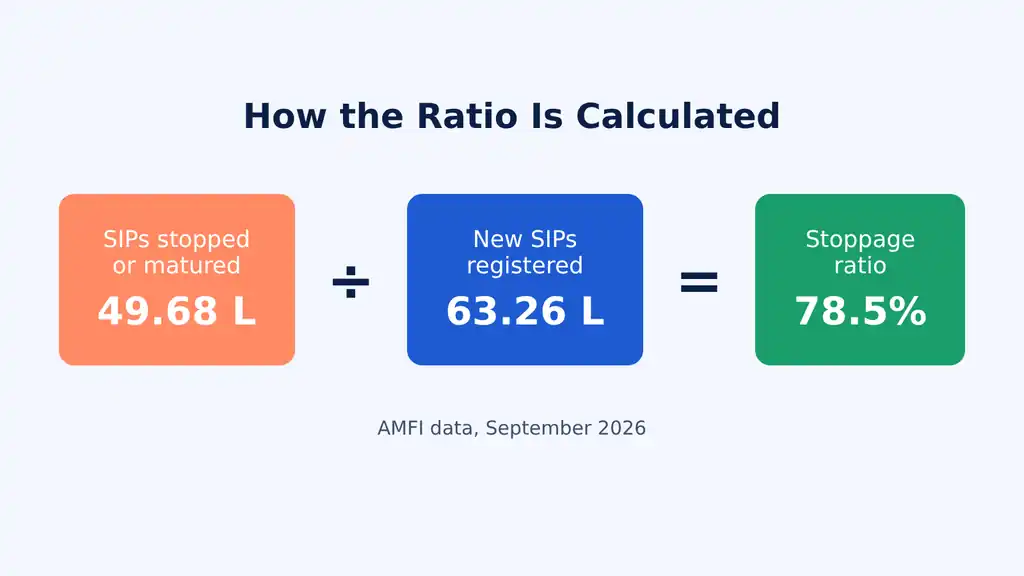
SIP stoppage ratio = (SIPs discontinued or matured in the month ÷ new SIPs registered in the month) × 100
Using AMFI data for September 2026: 49.68 lakh SIPs were stopped or completed and 63.26 lakh new SIPs were registered. So, 49.68 ÷ 63.26 × 100 = 78.53%. The net addition was 63.26 − 49.68 = 13.58 lakh SIP accounts.
Worked example with simple numbers
Suppose a fund house registers 2,50,000 new SIPs in a month.
- Case 1: 2,00,000 SIPs stop. Ratio = 2,00,000 ÷ 2,50,000 × 100 = 80%. The SIP book grew by 50,000 accounts.
- Case 2: 3,00,000 SIPs stop. Ratio = 3,00,000 ÷ 2,50,000 × 100 = 120%. The SIP book shrank by 50,000 accounts.
The key line is 100%. Below it, the number of SIP accounts is growing. Above it, the base is shrinking for that month. But the ratio says nothing about the rupee amount, so a month with a high ratio can still bring record money if the remaining SIPs are larger. The table in the next section shows how this played out in 2026.
SIP Stoppage Ratio Data: April to September 2026
The ratio crossed 100% in March and April 2026, when the Nifty 50 fell 11.3% in March before recovering 7.5% in April, as reported by Angel One on 13 May 2026. Since then it has come down every month.
| Month (2026) | New SIPs (lakh) | Stopped or matured (lakh) | SIP stoppage ratio | SIP contribution |
|---|---|---|---|---|
| April | 50.71 | 51.29 | 101.1% | ₹31,115 crore |
| May | n/a | n/a | 95.5% | n/a |
| June | n/a | n/a | 91.2% | ₹31,781 crore |
| July | 61.44 | 50.29 | 81.9% | ₹31,961 crore |
| August | 66.40 | 53.82 | 81.1% | ₹32,297 crore |
| September | 63.26 | 49.68 | 78.5% | ₹32,490 crore |
Three points stand out. First, registrations have beaten stoppages for five straight months. Second, monthly SIP money rose from ₹31,115 crore in April to ₹32,490 crore in September, up about 10.7% from ₹29,361 crore in September 2025. Third, contributing SIP accounts stood at about 10.06 crore in September 2026, against about 10.02 crore in August. You can compare these numbers with our September 2026 SIP inflow analysis.
One caution: SIP assets fell to ₹17.86 lakh crore in September 2026 from about ₹18.62 lakh crore in August, and total industry assets fell 5.1% to ₹82.64 lakh crore. That drop came from falling share prices, not from investors leaving. AMFI’s October 2026 data is expected in the second week of November, so September is the latest month available as of 5 November 2026.
Why SIPs Are Counted as Stopped
Many readers assume every stopped SIP is a scared investor. In practice, the “stopped” number mixes four very different events:
- Voluntary cancellation. The investor cancels the SIP, often after a market fall or because of a cash need.
- Tenure completed. Many SIPs are registered for a fixed period, such as three or five years. When that period ends, the SIP is counted as matured even if the investor starts a fresh one.
- Failed instalments. If debits keep bouncing, the SIP is discontinued. For daily, weekly, fortnightly and monthly SIPs, three consecutive failures lead to discontinuation, as INDmoney noted in its explainer on August 2026 data.
- Switching and restructuring. An investor who moves a SIP from one scheme to another, or changes the amount by closing and reopening, shows up as one stoppage and one new registration.
The April 2025 SIP stoppage ratio spike
The clearest example of a misleading reading came in April 2025, when the ratio jumped to nearly 300%. Angel One reported on 28 May 2025 that about 1.36 crore SIP accounts were closed or matured that month against about 46 lakh new ones. The cause was a reconciliation exercise by AMFI to match SIP records held by registrars and exchanges, which removed old, inactive SIPs from the books. By May 2025, the ratio was back near 72%, according to AMFI figures compiled by Finnovate. A technical clean-up, not panic, drove the spike. Keep this in mind for the checklist that follows.
How to Read the SIP Stoppage Ratio: A 4-Step Checklist
We use this short routine every month when AMFI releases its data:
- Check the level against 100%. Below 100% means the SIP base grew that month. Note the direction over three to six months, not one month.
- Compare with SIP contributions. If the ratio rises but monthly SIP money also rises, the investors who remain are putting in more. That is not a sign of distress.
- Track contributing SIP accounts. This counts SIPs that actually paid an instalment. A steady or rising count confirms real participation.
- Look for one-off events. Data clean-ups, new fund launches or a sharp market fall can push one month out of line. Read AMFI’s notes and news reports before drawing a conclusion.
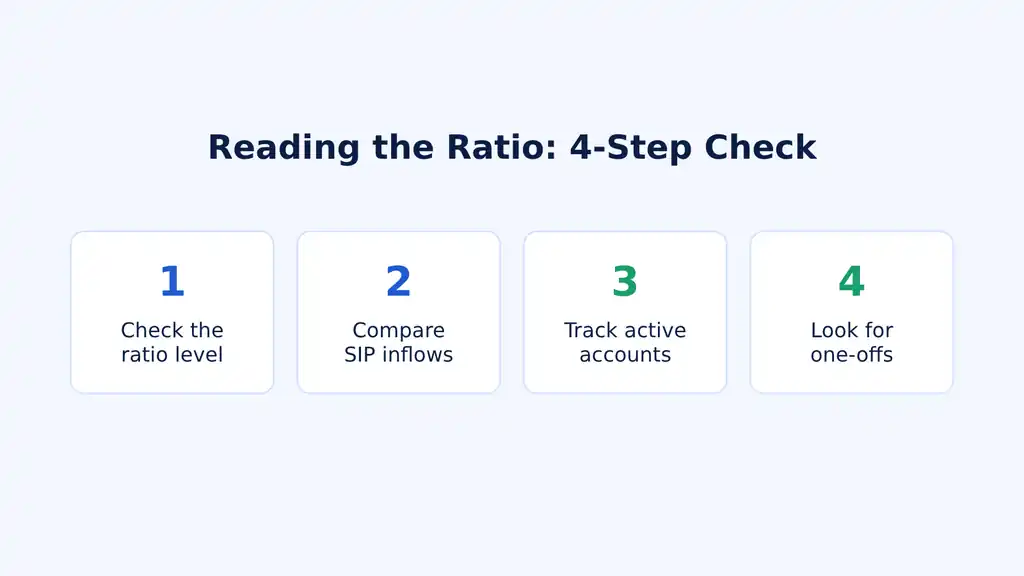
Applied to September 2026, all four checks point the same way: ratio below 100% and falling, record contributions, more active accounts and no known clean-up. That is a healthy reading. But the same checks can expose errors, which we cover next.
Common Mistakes When Reading the Data
- “78% of new SIPs were cancelled.” Wrong. The stopped SIPs in a month include SIPs started months or years ago. The ratio compares two flows; it does not track what happens to this month’s new SIPs.
- Treating a matured SIP as an exit. A three-year SIP that ends on schedule is counted as stopped, even if the investor keeps the units and starts a new plan.
- Ignoring the denominator. When new registrations fall, the ratio rises even if stoppages stay flat. In September 2026, registrations dropped 4.7% from August, yet the ratio still fell because stoppages fell faster.
- Reading category ratios without context. INDmoney’s August 2026 category data showed a ratio of 234.3% for overseas fund of funds. That was largely because industry limits on overseas investing restricted new registrations, not because investors rushed out.
- Comparing across sources without checking decimals. Different reports round differently. Always go back to the raw registration and stoppage counts.
Avoiding these errors makes the ratio far more useful, especially when you link it to institutional flows.
SIP Stoppages, DII Flows and the Market
SIP money flows into mutual funds every month, and fund managers deploy it into shares. This steady stream is one reason DIIs have been able to buy heavily on days when foreign investors sell, as our report on FII selling versus DII buying in 2026 shows. Equity mutual funds recorded ₹38,307 crore of net inflows in September 2026, their 67th straight month of positive flows, according to Angel One.
| Metric | What it measures | What it tells a trader |
|---|---|---|
| Stoppage ratio | Stopped SIPs as a share of new SIPs | Whether the retail SIP base is growing or shrinking |
| SIP contribution | Rupees collected through SIPs in a month | Size of the steady domestic buying pipe |
| Contributing SIP accounts | SIPs that paid an instalment | Real participation after removing dormant SIPs |
| DII net buying | Daily cash market purchases minus sales by domestic institutions | How much of that money actually reached the market |
A practical way to use this: when FIIs sell for several sessions, check whether the latest SIP stoppage ratio is stable or falling. If it is, domestic money is likely to keep cushioning the fall. You can follow daily institutional activity on our FII DII data today page and see longer trends in the monthly FII DII data table. For the wider fund flow picture, see our mutual fund equity inflow report.
FAQ
What is the SIP stoppage ratio?
The SIP stoppage ratio is the number of SIPs discontinued or matured in a month divided by the number of new SIPs registered in the same month, shown as a percentage. In September 2026 it was 78.53%, based on AMFI data.
Is a high SIP stoppage ratio bad?
A ratio above 100% means more SIPs closed than opened that month, which can signal weaker investor interest. But it can also come from matured SIPs, scheme switches or data clean-ups, so check SIP contributions and active accounts before concluding anything.
Why did the SIP stoppage ratio jump in April 2025?
The ratio rose to nearly 300% in April 2025 because AMFI ran a reconciliation exercise that removed old, inactive SIP records. It was a technical correction, and the ratio fell back to about 72% in May 2025.
Where can I find SIP stoppage data?
AMFI publishes new SIP registrations and discontinued SIPs in its monthly data, usually in the second week of the following month. Media reports and fund platforms then calculate the ratio from these figures.
Does a matured SIP count as stopped?
Yes. A SIP that reaches the end of its registered tenure is counted in the discontinued or matured figure, even if the investor keeps the units or starts a new SIP.
The Bottom Line
The SIP stoppage ratio is a quick health check on India’s retail investing habit. At 78.53% in September 2026, down from about 101% in April, it shows the SIP base growing again, backed by record monthly contributions of ₹32,490 crore.
Still, the ratio is a blunt tool. It mixes cancellations with matured plans and switches, and one-off clean-ups can distort it badly. Read it alongside SIP contributions, active accounts and DII flows rather than on its own.
Next step: when AMFI releases October 2026 data in the second week of November, run the four-step checklist above and compare the result with DII buying in our tracker. More explainers are on the FIIAndDIIData.com blog.
Sources: AMFI monthly data; Angel One, 13 October 2026; INDmoney, SIP stoppage ratio explained; Angel One, 13 May 2026 and 28 May 2025; 5paisa, 12 August 2026; Finnovate, SIP stoppage normalisation.
Disclaimer: This article is for educational purposes only and is not investment advice. Please consult a SEBI-registered advisor before making investment decisions.