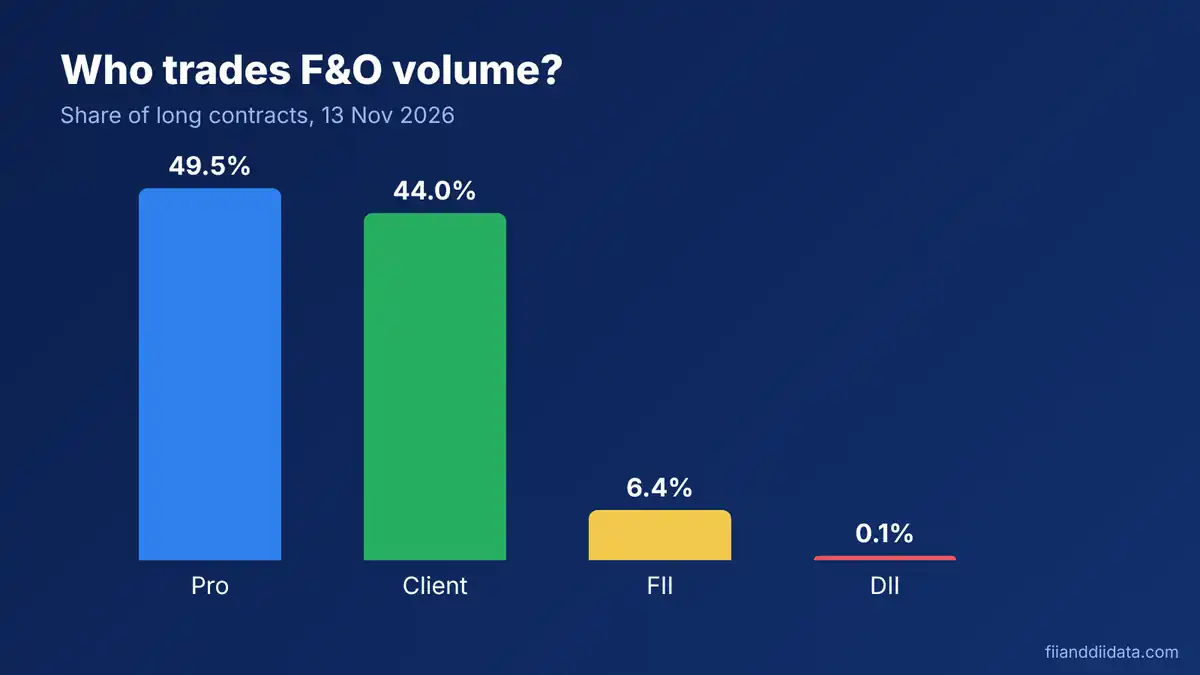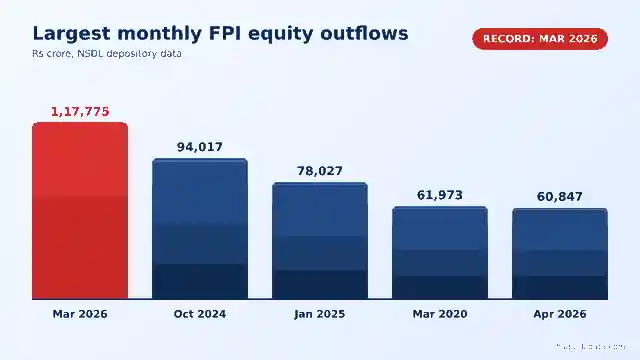
FII buying and selling is the daily record of how much foreign institutions bought and sold in Indian shares, and the net gap between the two. Provisional figures for 13 November 2026 showed FIIs buying Rs 18,340 crore and selling Rs 12,603 crore, a net buy of Rs 5,737 crore. This guide explains how to read those numbers, where they come from and what they cannot tell you. Daily summaries sit on our FII and DII data page.
Key Takeaways
- Every day has three figures: what FIIs bought, what they sold, and the net, which is buy minus sell.
- A positive net means foreigners added shares that day. A negative net means they trimmed their holdings.
- Daily figures arrive after the market closes and are often provisional, so they are never live.
- Across the five sessions listed below (6 to 13 November 2026), FIIs were net buyers every day while DIIs were net sellers every day.
- The numbers describe what already happened. They do not tell you where prices go next.
Table of Contents
- What FII Buying and Selling Means
- How FII Buying and Selling Is Reported
- Five Sessions of FII Buying and Selling
- How to Read Daily Flows Step by Step
- What Can Drive Foreign Buying and Selling
- FII Buying and Selling Compared With DII Flows
- Common Mistakes
- Worked Example: A Week of Flows
- Pros and Cons of FII Buying and Selling Data
- FAQ
- The Bottom Line
What FII Buying and Selling Means
An FII, or foreign institutional investor, is a large overseas organisation such as a pension fund, an insurer or an asset manager that invests in Indian securities. Under SEBI rules they register as foreign portfolio investors, or FPIs, and in daily market reports the two names point to the same group. If the terms are new to you, start with our guide on what FII and DII mean.
When people talk about buying and selling by this group, they usually mean the cash segment of the exchange, where shares are traded for immediate settlement. Each evening the exchange data shows how many rupees of shares the group purchased and how many it sold. The difference is the headline number reporters quote.
Gross buy, gross sell and net in FII buying and selling
Gross buy is the total value of purchases. Gross sell is the total value of sales. Net is gross buy minus gross sell. All three are quoted in Rs crore, and one crore is ten million rupees. Gross numbers show how active foreigners were, while the net shows which way they leaned.
FII buying and selling in plain words
Think of it as a daily statement for foreign money in Indian shares. Money going into shares is buying, money coming out is selling, and the balance tells you whether foreigners ended the day holding more or fewer shares than before.

How FII Buying and Selling Is Reported
The primary source is the NSE. Its FII/FPI and DII trading activity report covers the capital market segment. Many data sites repeat it in a friendlier layout. The exact publishing time may vary, so check the official site for the current schedule.
NSDL publishes a separate set of FPI net investment reports built from custodian data. These can include debt and primary market activity, so they do not always match the exchange cash figure. Our post on FII net investment explains why the two sets differ.
Provisional versus final FII buying and selling figures
Figures shown soon after the close are described as provisional, which means they can be revised once data is fully compiled. Always note the date and whether a number was provisional. Never call a daily figure live, because it is published only after trading ends. For a fuller walk-through of the cash columns, see our guide to FII cash market data.
Five Sessions of FII Buying and Selling
The table uses provisional cash segment figures for the five most recent sessions shown on the Quantsapp FII DII page when we checked on 13 November 2026. Values are in Rs crore. Confirm against the NSE report before relying on them. On 12 November the source shows a net of 7,831 while 20,273 minus 12,443 gives 7,830, a one-crore gap that comes from rounding in the underlying data.
| Date | FII buy | FII sell | FII net | DII net |
|---|---|---|---|---|
| 13 Nov 2026 | 18,340 | 12,603 | +5,737 | -2,254 |
| 12 Nov 2026 | 20,273 | 12,443 | +7,831 | -6,331 |
| 11 Nov 2026 | 30,087 | 17,524 | +12,563 | -8,435 |
| 9 Nov 2026 | 20,311 | 13,099 | +7,212 | -7,173 |
| 6 Nov 2026 | 30,456 | 16,706 | +13,750 | -5,969 |
| Five sessions | 119,467 | 72,375 | +47,093 | -30,162 |
Adding the five rows gives gross buying of Rs 119,467 crore against gross selling of Rs 72,375 crore. Foreigners bought about Rs 1.65 for every Rs 1 they sold. The net of Rs 47,093 crore is about 24.5 percent of total turnover, which is buy plus sell at Rs 191,842 crore. Subtracting the totals gives 47,092, and the one-crore difference is the same rounding noted above. DIIs, meanwhile, were net sellers on each of the five days.
Five sessions are a small sample and prove nothing about a trend. They do show the layout you will meet in real tables. For a daily summary, see our FII DII data today page.

How to Read Daily Flows Step by Step
- Confirm the segment. Make sure the figure is for the cash segment and not futures and options.
- Check the date and status. Note whether the number is provisional.
- Look at gross buy and gross sell first. Large values on both sides mean heavy activity.
- Read the net. Positive is net buying, negative is net selling.
- Divide net by turnover. A net that is a large share of turnover is a stronger lean than the same rupee amount on huge volumes.
- Add up several sessions. A week or a month is more useful than one day.
- Put DII flows beside it. Domestic institutions often take the other side, so read both rows together.
What Can Drive Foreign Buying and Selling
Daily flow data does not state a reason, so any explanation is an interpretation. Commonly discussed factors include interest rate expectations in large economies, movements in the rupee against the dollar, how Indian share valuations compare with other markets, and shifts in global risk appetite. Index rebalancing and large block trades can also swing a single day.
Why one day of FII buying and selling can mislead
A large one-off trade can dominate a session. That is why analysts prefer weekly or monthly totals and why you should be careful about building a story around a single figure.

FII Buying and Selling Compared With DII Flows
DII stands for domestic institutional investor, a group that includes mutual funds and insurers. The two groups are tracked side by side because they often trade in opposite directions. In the table above, DIIs were net sellers on all five days while FIIs were net buyers. Our explainers on DII buying meaning and DII selling meaning cover the domestic side in detail, and FII DII activity shows how to combine the two rows.
Reading FII buying and selling next to DII net
Add the FII net and the DII net for a quick view of combined institutional flow. For the five sessions above that is +47,093 plus -30,162, which equals +16,931 crore. Retail investors and other participants sit outside these two groups, so the combined figure is not the whole market.
Common Mistakes
- Mixing segments. A cash net and a futures position are different things.
- Treating one day as a trend. One block trade can change the sign of the net.
- Ignoring the source. Dashboards and the exchange may round or format numbers differently.
- Calling the data live. It is published after the close.
- Reading it as a forecast. Net buying today does not promise a rising market tomorrow.
Worked Example: A Week of Flows
These numbers are made up to show the method and are not real market data. Suppose FIIs traded the following over five sessions, in Rs crore.
| Day | Buy | Sell | Net | Running net |
|---|---|---|---|---|
| Day 1 | 9,200 | 9,900 | -700 | -700 |
| Day 2 | 8,400 | 7,900 | +500 | -200 |
| Day 3 | 10,100 | 10,600 | -500 | -700 |
| Day 4 | 7,600 | 8,300 | -700 | -1,400 |
| Day 5 | 8,800 | 8,100 | +700 | -700 |
| Week | 44,100 | 44,800 | -700 | -700 |
- Daily nets: 9,200 minus 9,900 is -700; 8,400 minus 7,900 is +500; 10,100 minus 10,600 is -500; 7,600 minus 8,300 is -700; 8,800 minus 8,100 is +700.
- Weekly buy: 9,200 plus 8,400 plus 10,100 plus 7,600 plus 8,800 equals 44,100.
- Weekly sell: 9,900 plus 7,900 plus 10,600 plus 8,300 plus 8,100 equals 44,800.
- Weekly net: 44,100 minus 44,800 equals -700, which matches the sum of the daily nets.
- Turnover: 44,100 plus 44,800 equals 88,900. The weekly net is about -0.79 percent of turnover (700 divided by 88,900).
The week shows small net selling on large turnover, so foreigners were active but nearly balanced. A reader who only saw Day 1 would have called it a selling week. The running net shows it swung back and forth and ended close to flat.
Pros and Cons of FII Buying and Selling Data
| Pros | Cons |
|---|---|
| Official, free and published by the exchange | Published after the close, so it lags the market |
| Shows real share purchases and sales | Daily figures are often provisional and can be revised |
| Simple buy, sell and net layout that is easy to track | Net can hide very large gross buying and selling |
| Easy to compare with domestic institutional flows | Does not explain why investors traded |
| Useful for spotting multi-week runs of buying or selling | Cannot predict future prices on its own |
FAQ
What is FII buying and selling?
It is the daily record of shares that foreign institutions bought and sold on Indian exchanges, shown as buy value, sell value and net value in Rs crore.
Where can I check FII buying and selling figures?
The NSE publishes an FII/FPI and DII trading activity report. Many data sites repeat it, but check the official site for current figures and the publishing schedule.
Is FII data live or real-time?
No. Daily figures are published after trading ends and are often provisional, so they can be revised later.
What does net selling by FIIs mean?
It means FIIs sold more shares by value than they bought on that day. For example, buying Rs 44,100 crore and selling Rs 44,800 crore gives a net of minus Rs 700 crore.
Does heavy FII selling mean the market will fall?
Not necessarily. Domestic investors, global events and company news also move prices. Use the figure as context about what happened, not as a signal to buy or sell.
The Bottom Line
FII buying and selling comes down to three numbers: gross buy, gross sell and the net between them. Read them for the right segment, note whether they are provisional, add up several sessions and place them beside DII flows. The provisional figures for 6 to 13 November 2026 show FIIs net buying and DIIs net selling, but they describe the past and are not a forecast.
Your next step is to open the NSE report, copy five days of figures and work out the weekly net and its share of turnover yourself. More explainers are on our blog.
Sources: NSE FII/FPI and DII trading activity report; NSDL FPI net investment reports; Quantsapp FII DII data page; SEBI operational guidelines for FPIs. Checked 13 November 2026.
Disclaimer: This article is for educational purposes only and is not investment advice. It does not recommend buying or selling any security. Worked examples use made-up numbers. Please consult a SEBI-registered advisor before making investment decisions.