A FII DII data TradingView indicator is a community-built script that plots foreign and domestic institutional cash flows on your Nifty chart, but most of these scripts use figures typed in by hand from NSE. That matters right now. In the week of 2 to 6 November 2026, FIIs bought a net ₹45,960 crore, and any indicator that had not been updated simply missed it. This guide shows how these indicators work, how to set one up and how to check it.
Key Takeaways
- TradingView has no official FII DII data feed for Indian markets; available indicators are community scripts.
- The best-known open-source script says its data is collected from NSE by hand and stored inside the code.
- Its changelog shows updates roughly every one to two weeks, so recent sessions can be missing.
- Always spot-check an indicator against NSE provisional data before you act on it.
- For same-evening figures, a data page that reads NSE releases is faster than a chart script.
- What is a FII DII data TradingView indicator?
- How the indicator gets its numbers
- How to add one to your chart
- Latest data to test your indicator
- Build a simple version in Pine Script
- 5 checks before you trust any indicator
- Common mistakes
- TradingView vs data websites vs NSE
- FAQs
- The Bottom Line
What Is a FII DII Data TradingView Indicator?
FIIs are foreign institutional investors, such as overseas pension funds and mutual funds. DIIs are domestic institutional investors, such as Indian mutual funds, insurers and banks. Every trading day, NSE publishes how much each group bought and sold in the cash market. The difference between buying and selling is the net figure, shown in ₹ crore.
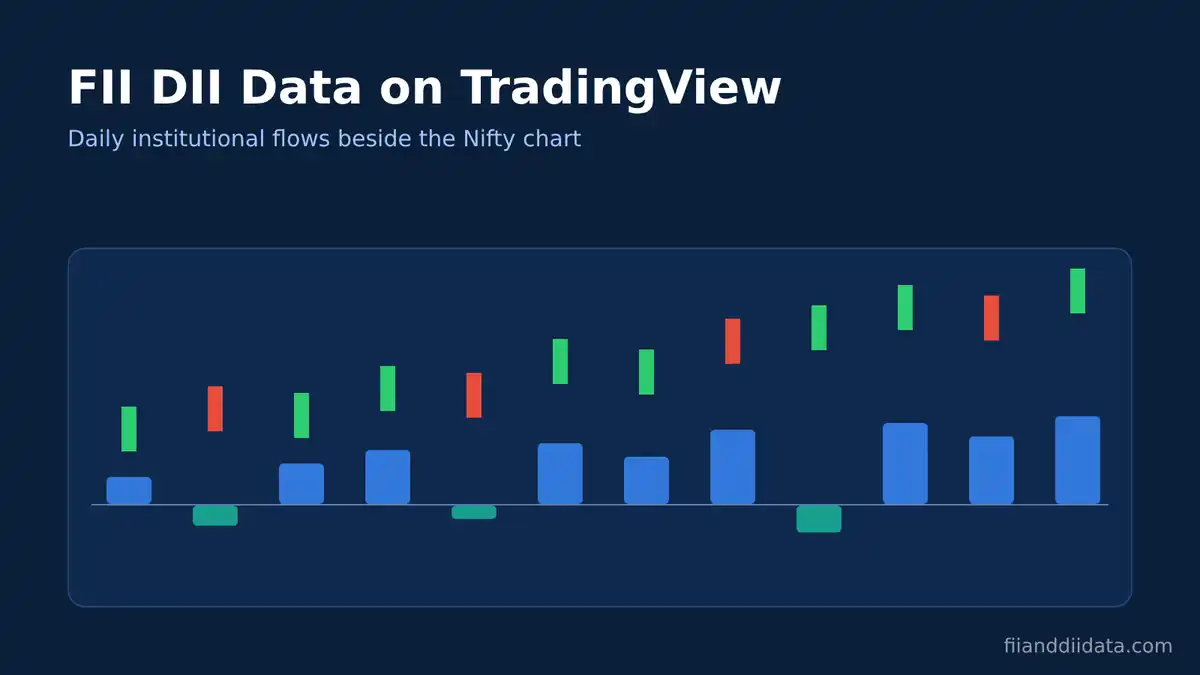
TradingView is a charting platform. It lets users write their own indicators in a language called Pine Script and share them in a public library. A FII DII indicator is one of these shared scripts. It draws the daily net flows as columns, labels or a table next to the Nifty 50 price, so you can see flows and price on one screen.
The key point is that these are not TradingView products. They are written and maintained by individual users. If you are new to the numbers themselves, start with our guide on what FII and DII data means. Next, the part most users never check: where the numbers inside the script come from.
How the FII DII Data TradingView Indicator Gets Its Numbers
Manual entry is the common method
The most visible open-source script in TradingView’s “fiidiidata” tag is “FII and DII Data” by the user nanujogi. It was first published on 17 January 2022 and last updated on 31 August 2025, according to its TradingView script page. The author writes that the data “is collected from NSE website on daily basis, it’s an manual process,” and that the codes are hardcoded.
Hardcoded means the daily values are typed into the script itself. When the author adds new days and republishes, your chart gets them. Until then, it does not. The script page shows data updates roughly every one to two weeks between October 2021 and August 2025, along with corrections, such as a fix to June and July 2024 data.
Why there is no automatic feed
Pine Script can only read data that TradingView hosts. TradingView once offered a service called Pine Seeds that let users load their own end-of-day data through GitHub. Its official documentation now says the creation of new repositories has been suspended, and that the data is end-of-day only and can be updated at most five times per day. So a fresh, automatic FII DII feed is not something a new script author can easily set up.
Other scripts exist. One protected script, “FII POSITIONS FUTURES” by ILuvMarkets, published on 23 May 2024, shows NSE net positions for FII, Pro, DII and Client in futures and options. Its code is hidden and its page does not explain how or how often data is updated. These are participant-wise open interest figures, a different dataset from cash market flows.
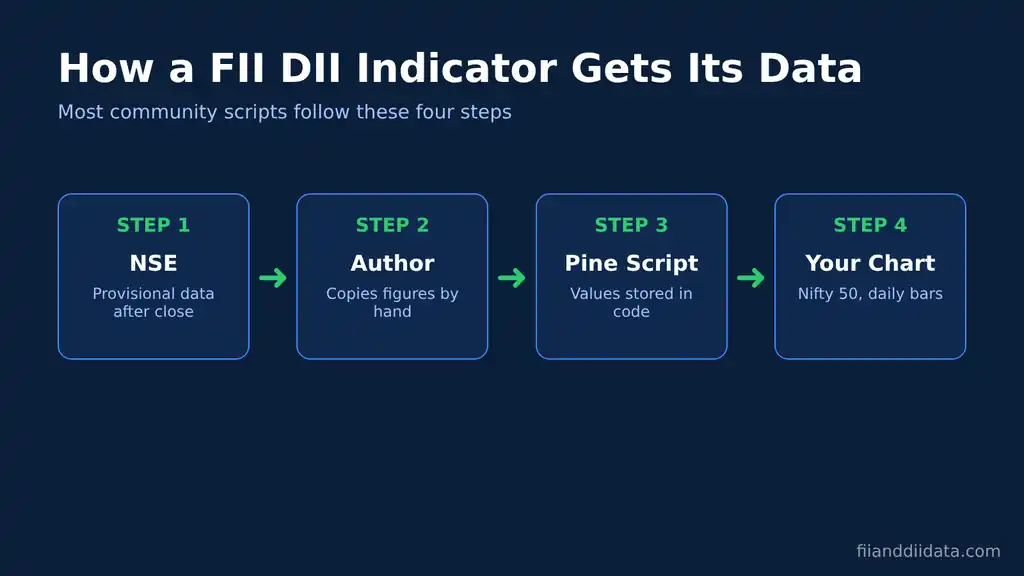
Knowing the data is manual changes how you should set the indicator up. Here is the process.
How to Add a FII DII Data TradingView Indicator to Your Chart
The steps below work on the TradingView web chart. Menu names can change, so look for the closest match.
- Open the right symbol. Load the Nifty 50 spot index (NSE:NIFTY), not Nifty futures. The nanujogi script says it displays only on Nifty 50 spot.
- Switch to the daily timeframe. Flows are daily figures. The same script shows a yellow notice if you are on another timeframe.
- Open the Indicators menu and search “FII DII” in the community scripts section.
- Read the script page before adding. Check the author, the last update date and whether the source is open.
- Add it and adjust settings. The nanujogi script lets you change font size, colours, table position and a “Show All Months Activity” option, which is off by default.
Once it is on the chart, do not assume the latest bar is correct. Test it against fresh numbers first, which is what the next section helps you do.
Latest Data: Test Your FII DII Data TradingView Indicator Against This Week
The table shows NSE provisional cash market figures for the five sessions from 2 to 6 November 2026. Compare each day with what your indicator shows. If the last few rows are blank on your chart, the script has not been updated.
| Date | FII net (₹ cr) | DII net (₹ cr) | Combined (₹ cr) |
|---|---|---|---|
| 2 Nov 2026 | +3,114.68 | -392.20 | +2,722.48 |
| 3 Nov 2026 | +6,836.81 | -3,678.85 | +3,157.96 |
| 4 Nov 2026 | +7,284.03 | -3,712.23 | +3,571.80 |
| 5 Nov 2026 | +14,974.68 | -10,444.54 | +4,530.14 |
| 6 Nov 2026 | +13,749.82 | -5,968.70 | +7,781.12 |
| Week | +45,960.02 | -24,196.52 | +21,763.50 |
Worked example: what a stale indicator would miss
Suppose your script was last updated with data up to 4 November. It would show FII buying of ₹17,235.52 crore for the week (3,114.68 + 6,836.81 + 7,284.03). The full week was ₹45,960.02 crore. The chart would show only 37.5% of the real buying and would miss the two biggest days, 5 and 6 November.
The combined column matters too. DIIs sold ₹24,196.52 crore, so net institutional money for the week was ₹21,763.50 crore, less than half the FII headline. An indicator that plots only FII flows would hide that. Our weekly FII DII report for 6 November covers what drove these flows.
If you would rather control the update yourself, you can write a small script of your own.
Build a Simple FII DII Indicator in Pine Script
This short teaching example uses the same manual method as community scripts. It stores dates and net values in arrays, then plots a column on the matching daily bar. Open the Pine Editor in TradingView, paste it, save and add it to a Nifty 50 daily chart.
//@version=6
indicator("FII DII Net Flow (manual)", overlay = false)

// Dates as YYYYMMDD, values in Rs crore (NSE provisional)
var keys = array.from(20261102, 20261103, 20261104, 20261105, 20261106)
var fii  = array.from(3114.68, 6836.81, 7284.03, 14974.68, 13749.82)
var dii  = array.from(-392.20, -3678.85, -3712.23, -10444.54, -5968.70)

key = year * 10000 + month * 100 + dayofmonth
idx = array.indexof(keys, key)

fiiVal = idx >= 0 ? array.get(fii, idx) : na
diiVal = idx >= 0 ? array.get(dii, idx) : na

plot(fiiVal, "FII net", color = color.blue, style = plot.style_columns)
plot(diiVal, "DII net", color = color.green, style = plot.style_columns)
hline(0)
Keeping your own script current
Each evening after NSE releases provisional data, add one date and two values to the arrays and save. It takes about a minute. The benefit is that you know exactly when and where every number came from. The cost is discipline: miss a few days and your script becomes as stale as anyone else’s. A quicker way to collect the numbers is our FII DII data today page.
Whether you build or borrow a script, run the same quality checks.
Checklist: 5 Checks Before You Trust Any FII DII Indicator
- Last data date. Find the most recent bar with a value and compare it with the last NSE trading day.
- Open source. Prefer scripts whose code you can read. A protected script can still be useful, but you cannot verify how it works.
- Units and definition. Confirm values are net figures in ₹ crore for the cash market, not gross buying or F&O positions.
- Correct chart. Use the symbol and timeframe the author specifies, usually Nifty 50 spot on daily bars.
- Spot-check three days. Pick three recent sessions and match them against NSE or a page that reports NSE data.
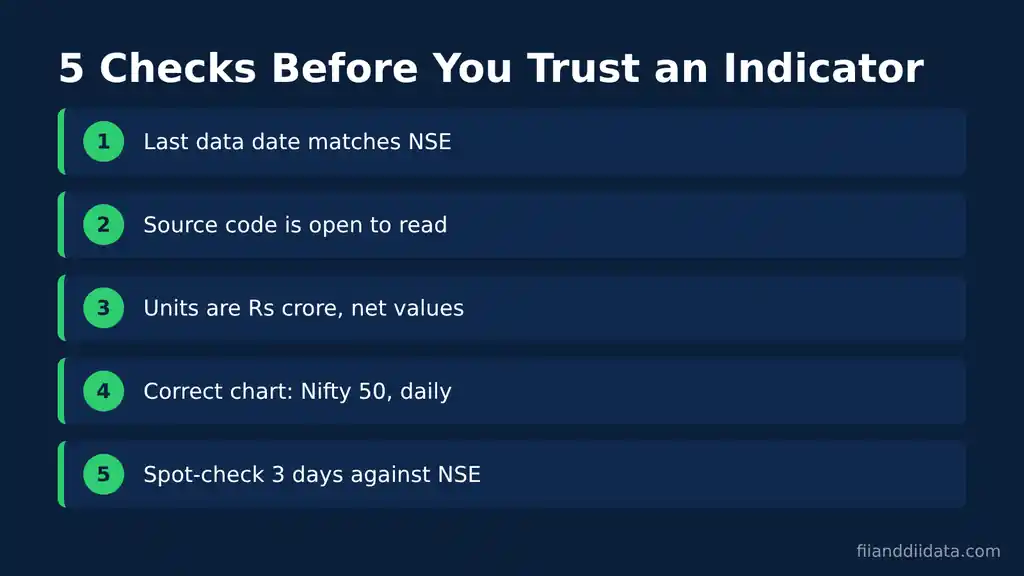
For step 5, our step-by-step guide on how to check FII DII data on NSE and NSDL shows exactly where to look. Even a script that passes all five checks can be misread, so here are the errors we see most often.
Common Mistakes Traders Make With FII DII Indicators
- Treating flows as intraday signals. Official figures arrive after the market closes, so they explain the day that ended, not the next hour. Our guide on using flow data for intraday trading covers the right way to use them.
- Mixing NSE and NSDL numbers. NSE provisional data and NSDL’s FPI data use different methods and can differ a lot. Read why NSE and NSDL FII figures differ before comparing sources.
- Ignoring DII flows. As the worked example shows, DII selling cut the week’s net institutional inflow by more than half.
- Reading one day as a trend. A single large day can reverse. Weekly and monthly totals give a steadier picture.
- Confusing cash flows with derivatives positions. FII buying in cash can sit alongside a net short in index futures. Check participant-wise futures data for that side.
With those traps in mind, how does a chart script compare with other ways to get the data?
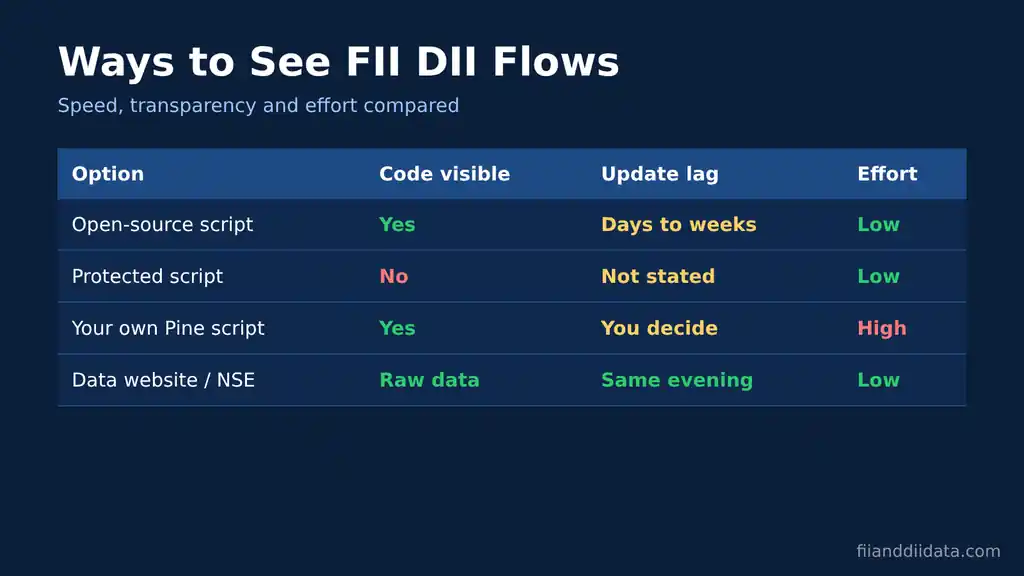
FII DII Data TradingView Indicator vs Data Websites vs NSE
| Option | Where data comes from | Freshness | Best for |
|---|---|---|---|
| Open-source TradingView script | Author copies NSE figures into code | Depends on author; often days to weeks behind | Seeing past flows beside price |
| Protected TradingView script | Not disclosed on the script page | Not stated | Visual use only, after spot-checks |
| Your own Pine Script | You enter NSE figures | As current as your updates | Full control and transparency |
| Data website | NSE provisional releases | Same evening on trading days | Daily tracking and history |
| NSE website | Primary source | Same evening on trading days | Verification |
A practical setup uses two tools: a website for the numbers and TradingView for the chart. We publish daily and historical FII and DII data, along with weekly and monthly totals. Below are answers to the questions readers ask most.
Frequently Asked Questions
Is there a FII DII data TradingView indicator?
Yes. Community users have published FII DII scripts in TradingView’s public library. They are not official TradingView or NSE products. The best-known open-source script, by nanujogi, plots daily FII and DII net flows on the Nifty 50 spot daily chart using figures its author collects from NSE by hand.
Does TradingView show live FII DII data?
No. Official FII DII cash figures are released after market close, so no source can show them live during the session. Community scripts are updated by their authors, often days or weeks after NSE publishes the data.
Why is my FII DII indicator not showing recent days?
Most scripts store data inside their code, so new days appear only when the author updates and republishes the script. Also check that you are on the Nifty 50 spot symbol and the daily timeframe, as some scripts display nothing elsewhere.
Can I create my own FII DII indicator in Pine Script?
Yes. You can store dates and net values in arrays and plot them on matching daily bars, as in the example in this article. You will need to add new values yourself after each NSE release.
Where can I get accurate FII DII data every day?
NSE publishes provisional FII and DII cash market figures after market close on each trading day, and NSDL publishes FPI data separately. Data websites that report these releases are the quickest way to get the numbers and verify any chart indicator.
The Bottom Line
A FII DII indicator on TradingView is a useful way to see institutional flows beside the Nifty, but it is only as good as its last manual update. The most visible open-source script is transparent about this, and that honesty is the reason to check it rather than avoid it.
As a next step, add the indicator, then compare its last three bars with the table above. If they match, use it for context. If they do not, keep the chart for price and take your flow numbers from a source that updates every evening. You can find more guides on our blog.
Sources: TradingView, “FII and DII Data” script by nanujogi (accessed 8 Nov 2026); TradingView, “FII POSITIONS FUTURES” script by ILuvMarkets (accessed 8 Nov 2026); TradingView Pine Seeds documentation on GitHub (accessed 8 Nov 2026); NSE provisional cash market data via Upstox FII DII data page (updated 6 Nov 2026).
Disclaimer: This article is for educational purposes only and is not investment advice. Please consult a SEBI-registered advisor before making investment decisions.