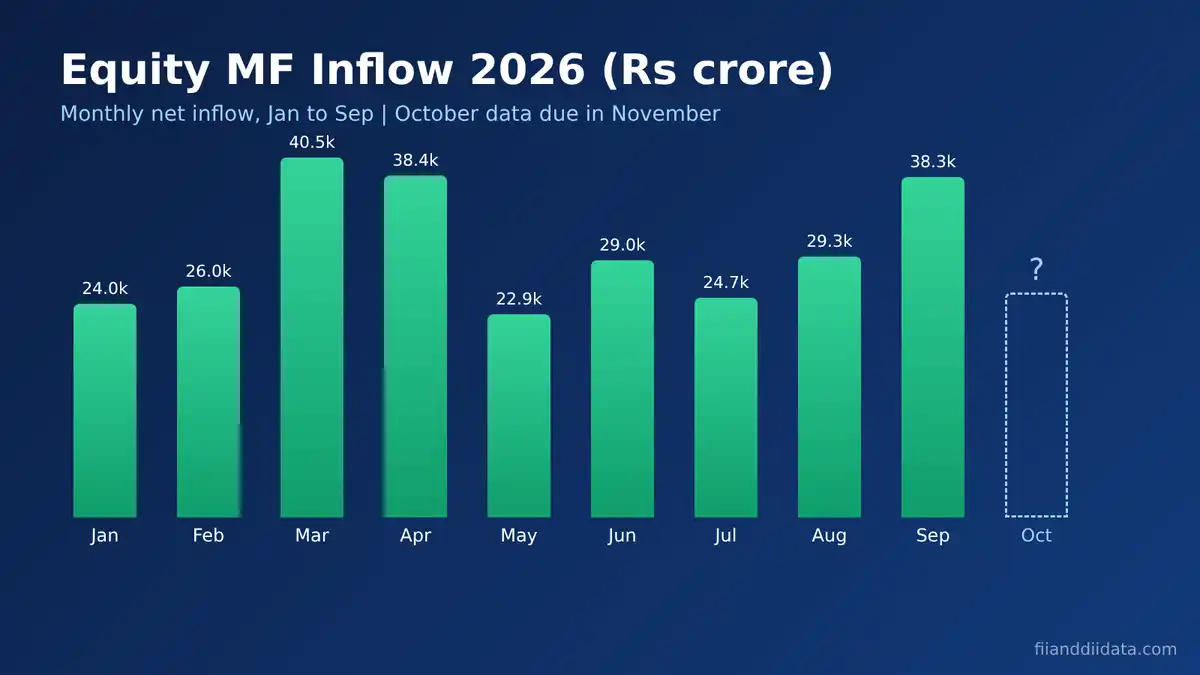
Mutual fund equity inflow October 2026 data will be published by AMFI in the second week of November, so the number is not out yet. What we do know is the run-up: equity funds took in ₹38,307 crore in September 2026, up 30.6% from August, and ₹2.73 lakh crore across the first nine months of the year. This guide sets out the trend, how to read the release and what to watch when it lands.
Key Takeaways
- AMFI has released 2026 monthly data between the 10th and 12th of the following month, so October figures should arrive around 10 to 12 November 2026.
- Net equity fund inflows totalled ₹2,73,110 crore from January to September 2026, an average of ₹30,346 crore a month.
- September 2026 brought ₹38,307 crore, the third-highest month of the year after March (₹40,450 crore) and April (₹38,440 crore).
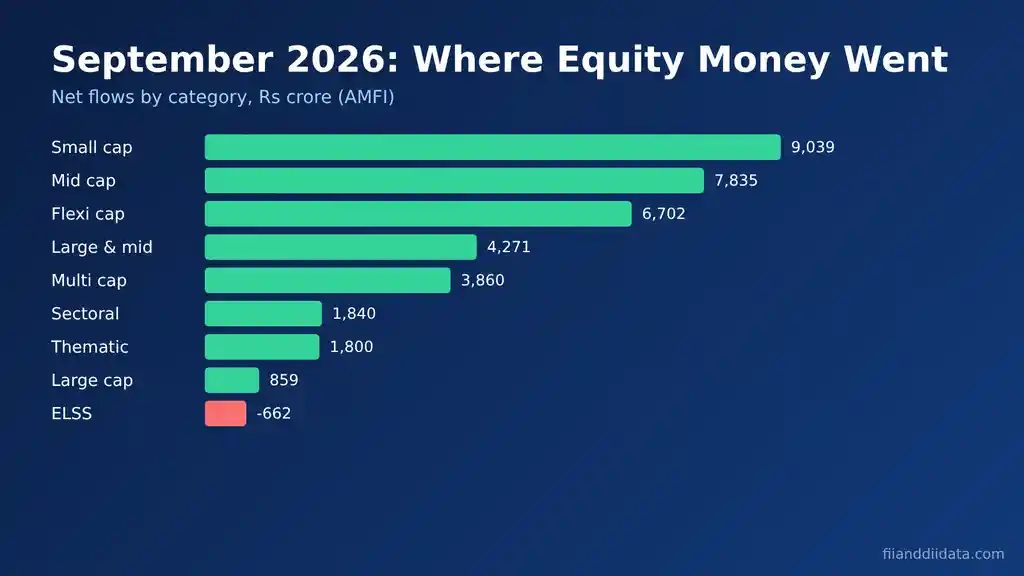
- Small cap and mid cap funds took 44% of September’s equity money; large cap funds took just ₹859 crore.
- Equity fund flows feed DII buying, which is why the October number matters for anyone tracking FII selling.
- What equity mutual fund inflow means
- When October 2026 data will be released
- Mutual fund equity inflow trend in 2026
- How to read the AMFI equity inflow number
- Mutual fund equity inflow October 2026: what to watch
- Why equity fund flows matter for FII and DII data
- Common mistakes when reading AMFI data
- FAQs
- The Bottom Line
What Equity Mutual Fund Inflow Means
Equity mutual fund inflow is the net money that investors put into equity-oriented schemes in a month. AMFI (the Association of Mutual Funds in India) calculates it as gross purchases minus redemptions across all open-ended equity categories, such as large cap, mid cap, small cap, flexi cap, sectoral and ELSS funds.
The figure is “net”, so a large positive number means fresh buying power for fund managers. A negative number means investors pulled out more than they put in. It includes SIP (systematic investment plan) money, lump sum purchases and new fund offer (NFO) collections, after subtracting what was withdrawn.
This number does not include index funds or ETFs, which AMFI reports separately under “other schemes”. That distinction matters when you compare it with stock market flows, so keep it in mind as we look at the release timing next.
When October 2026 Data Will Be Released
AMFI does not publish a fixed calendar for its monthly note, but the 2026 pattern is consistent. February data came out on 10 March, June data on 10 July, July data on 11 August, August data on 10 September and September data on 12 October 2026, according to dated reports from Business Today, Kotak Neo, DD News and Outlook Money.
On that basis, mutual fund equity inflow October 2026 figures should be out between 10 and 12 November 2026. Until then, any number you see for October equity inflows is an estimate, not AMFI data. We will add the official figure to our FII DII monthly data page once it is published.
While we wait, the nine months already reported tell us a lot about the base October will be judged against.
Mutual Fund Equity Inflow Trend in 2026
| Month (2026) | Net equity inflow (₹ crore) | Change vs previous month |
|---|---|---|
| January | 24,028 | -14% |
| February | 25,978 | +8% |
| March | 40,450 | +56% |
| April | 38,440 | -5% |
| May | 22,908 | -40% |
| June | 28,973 | +26% |
| July | 24,697 | -15% |
| August | 29,329 | +19% |
| September | 38,307 | +31% |
| Total, Jan to Sep | 2,73,110 | Average ₹30,346 crore |
Three things stand out. First, flows swing a lot: the gap between the best month (March, ₹40,450 crore) and the weakest (May, ₹22,908 crore) is ₹17,542 crore. Second, flows never turned negative, even as the Nifty fell and foreign investors sold heavily. Third, the July to September quarter added ₹92,333 crore, with September doing most of the work.
The steady floor under these numbers is SIP money. Monthly SIP contributions hit a record ₹32,490 crore in September 2026, up about 10.7% from ₹29,361 crore a year earlier. We break that down in our SIP inflow September 2026 analysis.
Where September’s Money Went
Small cap funds took ₹9,039 crore and mid cap funds ₹7,835 crore in September, as per AMFI data reported by Upstox and Outlook Money on 12 October 2026. Together that is ₹16,873 crore, or 44% of the month’s equity inflow. Flexi cap funds added ₹6,702 crore. Large cap funds turned positive at ₹859 crore after an outflow of ₹1,147 crore in August, while ELSS funds saw a ₹662 crore outflow.
That category split is the first thing to compare when October arrives. Before that, here is how to read the headline number correctly.
How to Read the AMFI Equity Inflow Number
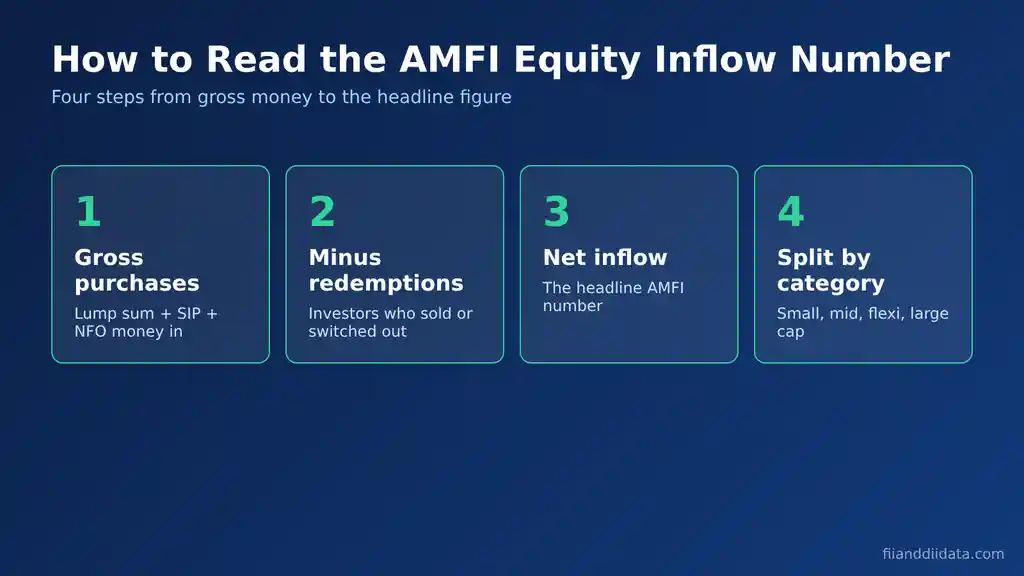
AMFI’s monthly note has a “Monthly MF flows” table. The equity row gives the net figure that headlines quote. Work through it in four steps.
- Find gross purchases. This is all money that came in: SIPs, lump sums and NFOs.
- Subtract redemptions. This is money investors took out, including switches to other schemes.
- Read the net inflow. This is the headline, for example ₹38,307 crore for September 2026.
- Check the category split. See whether money went to large, mid, small or flexi cap funds.
Worked Example: Reading Mutual Fund Equity Inflow October 2026 Scenarios
Assume three possible October outcomes. These are illustrations, not forecasts.
- ₹38,000 crore: about 0.8% below September. Flows held up despite a weak market. This would be the fourth month in 2026 above ₹38,000 crore.
- ₹30,000 crore: about 21.7% below September, but close to the 2026 average of ₹30,346 crore. This is a normal month, not a warning sign.
- ₹25,000 crore: about 34.7% below September and near the January and July lows. If SIP money stays near ₹32,000 crore, a figure this low would mean redemptions or weak lump sums pulled the net number down.
The lesson is simple: compare any month with the yearly average and with SIP flows, not just with the month before. A 20% drop after a strong month can still be an ordinary result.
With the method clear, here are the specific signals worth checking in the October release.
Mutual Fund Equity Inflow October 2026: What to Watch
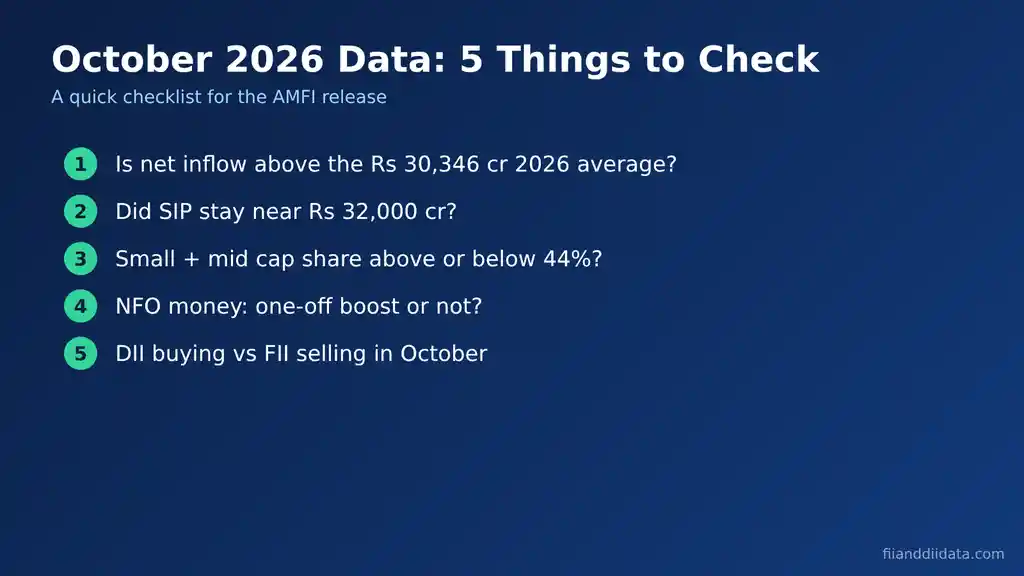
Use this checklist on the day AMFI publishes. Each point links the fund data to what you see in daily market flows.
- Headline vs average. Is net equity inflow above or below the ₹30,346 crore monthly average for 2026?
- SIP stability. Did monthly SIP contributions stay near ₹32,000 crore? A drop would matter more than a fall in lump sums.
- Small and mid cap share. Was it above or below September’s 44%? A rising share means investors are still chasing higher-risk funds.
- NFO money. NFOs raised only ₹2,372 crore across 22 schemes in September, down from ₹7,110 crore in August. A large NFO can inflate one month without signalling a trend.
- Match with DII buying. Compare the fund figure with net DII cash buying for October on our October 2026 FII DII data tracker.
The fifth check is the one that ties fund flows to the market itself, so it deserves a closer look.
Why Equity Fund Flows Matter for FII and DII Data
Mutual funds are the largest group within domestic institutional investors (DIIs). When equity funds receive money, fund managers buy shares, and that buying shows up in the DII column of NSE’s provisional cash market data, released around 6 PM IST on trading days. You can see those daily figures on our FII DII data today page.
This is why a strong fund inflow month often coincides with heavy DII buying while FIIs sell. In September 2026, foreign portfolio investors sold a net ₹35,861 crore of Indian equities, according to NSDL data reported by Angel One, while equity funds took in ₹38,307 crore. Our FII selling vs DII buying 2026 analysis tracks that tug of war through the year.
Mutual Fund Flows vs DII Buying: Not a Perfect Match
| Point | AMFI equity inflow | DII cash data |
|---|---|---|
| Who is covered | Mutual fund equity schemes only | Mutual funds, insurers, banks, pension funds |
| Frequency | Monthly | Daily (provisional) |
| Release | Around 10th to 12th of next month | About 6 PM IST each trading day |
| Measures | Investor money into funds | Institutions’ net purchase of shares |
Fund managers can hold cash, buy over several weeks or invest in IPOs and block deals, so the two numbers rarely line up exactly. For daily flows, charts and free tools, use our FII and DII data home page. Next, the errors that most often trip up readers.
Common Mistakes When Reading AMFI Data
- Mixing up AUM and inflows. Industry AUM fell about 5.1% to ₹82.64 lakh crore in September 2026, mainly due to debt fund outflows of about ₹1.83 lakh crore. Equity inflows still rose. AUM also moves with market prices.
- Treating SIP and equity inflow as the same. SIP contributions cover all scheme types, including hybrid and index funds. The equity inflow figure is net of redemptions. They measure different things.
- Reading one month in isolation. A 30% jump or fall is common in 2026. Compare against the yearly average.
- Quoting estimates as data. Until AMFI publishes, October numbers are projections.
- Using inflows as a Nifty timing tool. Fund flows support demand over months. They do not tell you where the index goes next week.
Below are short answers to the questions readers ask most often about these numbers.
Frequently Asked Questions
When will mutual fund equity inflow October 2026 data be released?
AMFI has released its 2026 monthly data between the 10th and 12th of the following month. September data came out on 12 October 2026, so October figures are expected around 10 to 12 November 2026.
What was the equity mutual fund inflow in September 2026?
Net inflows into equity mutual funds were ₹38,307 crore in September 2026, up 30.6% from ₹29,329 crore in August, according to AMFI data released on 12 October 2026.
Is SIP inflow the same as equity mutual fund inflow?
No. SIP inflow is gross money collected through SIPs across all scheme types and was ₹32,490 crore in September 2026. Equity mutual fund inflow is net of redemptions and covers only equity schemes.
Which equity fund category got the most money in 2026?
In September 2026, small cap funds led with ₹9,039 crore, followed by mid cap funds at ₹7,835 crore and flexi cap funds at ₹6,702 crore. Large cap funds took just ₹859 crore.
Do mutual fund inflows affect the stock market?
Yes, over time. Equity fund inflows give fund managers money to buy shares, which shows up as DII buying in NSE cash market data. This has helped absorb heavy FII selling in 2026, but fund flows do not predict short-term index moves.
The Bottom Line
The mutual fund equity inflow October 2026 figure is still about two weeks away. The base it will be judged against is clear: ₹38,307 crore in September, a 2026 average of ₹30,346 crore and SIP money steady above ₹32,000 crore. Anything near the average would be a normal month, even if it looks like a sharp fall from September.
Domestic fund money has been the main buffer against foreign selling this year, so the release is worth reading closely. Your next step: bookmark the checklist above, then compare the official figure with October DII buying when AMFI publishes. You can find all our related analysis on the FIIAndDIIData.com blog.
Sources: AMFI monthly data as reported by Upstox (12 October 2026), Outlook Money (12 October 2026), Kotak Neo (11 August 2026), Bajaj Broking, Business Today, 5paisa and Angel One (January to October 2026); Equentis (AUM, September 2026); NSDL FPI data via Angel One (13 October 2026); AMFI.
Disclaimer: This article is for educational purposes only and is not investment advice. Please consult a SEBI-registered advisor before making investment decisions.