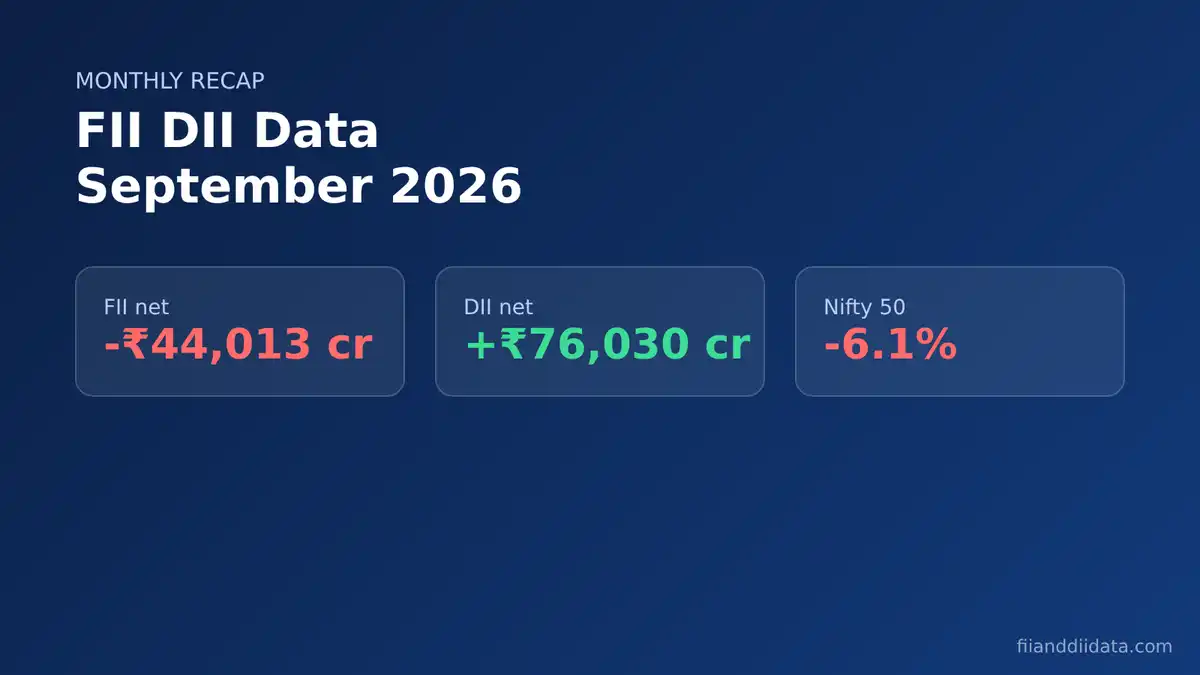
The FII DII data September 2026 shows foreign institutional investors sold a net ₹44,013 crore of Indian shares in the NSE cash market, while domestic institutions bought ₹76,030 crore. Domestic money covered every rupee of foreign selling, yet the Nifty 50 still fell about 6.1% for the month, its worst September since 2018. The bigger surprise is timing: 58% of the month’s FII selling came in the last three sessions.
Key Takeaways
- NSE provisional data: FIIs net sold ₹44,013 crore and DIIs net bought ₹76,030 crore across 21 sessions in September 2026.
- DIIs were net buyers on all 21 days; FIIs were net buyers on only 5.
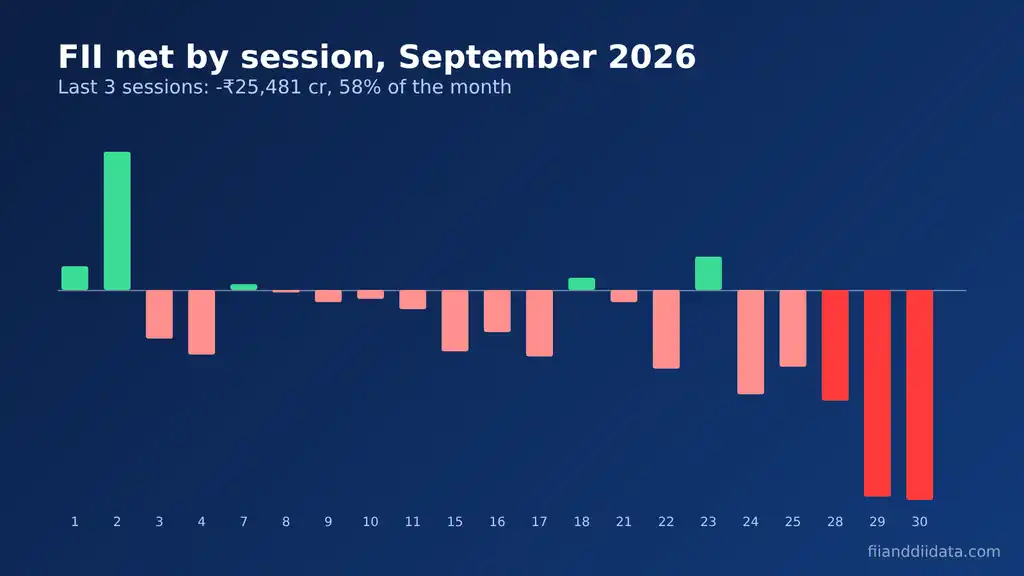
- FIIs sold ₹25,481 crore on 28, 29 and 30 September alone, and DII buying covered only 0.92x of that.
- NSDL put the September FPI equity outflow at ₹35,861 crore, ending two months of inflows.
- The Nifty 50 fell from 24,080.40 to 22,620.45, with IT the worst sector after a 25 bps US Fed rate hike.
In this article:
- FII DII Data September 2026: The Monthly Summary
- Week-wise FII and DII Flows in September 2026
- Day-wise FII DII Data September 2026 Table
- Why FIIs Sold in September 2026
- NSE vs NSDL: Two September Numbers
- Where the DII Money Came From
- How to Use Monthly FII DII Data: A Checklist
- Common Mistakes When Reading Monthly Flow Data
- FAQ
- The Bottom Line
FII DII Data September 2026: The Monthly Summary
FIIs (foreign institutional investors, also called FPIs) are overseas funds that trade Indian shares. DIIs (domestic institutional investors) are Indian mutual funds, insurers, banks and pension funds. After each trading day, NSE publishes a provisional net figure for both groups, usually around 6 PM IST. Adding up those daily numbers gives the monthly picture below.
| Measure (September 2026) | FII | DII |
|---|---|---|
| Net flow, NSE cash market | -₹44,013 crore | +₹76,030 crore |
| Gross buying (sum of daily figures) | about ₹3.14 lakh crore | about ₹3.68 lakh crore |
| Gross selling (sum of daily figures) | about ₹3.58 lakh crore | about ₹2.92 lakh crore |
| Net buying days out of 21 | 5 | 21 |
| Biggest single day | -₹10,148 crore (30 Sep) | +₹11,272 crore (30 Sep) |
The headline is simple. Domestic institutions bought ₹1.73 for every ₹1 that foreign institutions sold, and they did it every single day. Notice also how large the gross numbers are. FIIs traded more than ₹6.7 lakh crore in both directions, so the ₹44,013 crore net figure is only the difference between two very big totals.
For context, September was a sharp break from the summer. NSE data shows FIIs sold only ₹5,779 crore in July and ₹7,532 crore in August, so September’s selling was almost six times August’s. You can compare every month of the year on our FII DII data month by month page. The weekly split shows how the pressure built.
Week-wise FII and DII Flows in September 2026
Grouping the sessions by trading week makes the trend clear. The table also shows the absorption ratio, which is DII net buying divided by FII net selling. A ratio above 1.0x means domestic funds bought more than foreigners sold that week.
| Week (2026) | Sessions | FII net (₹ crore) | DII net (₹ crore) | Absorption ratio |
|---|---|---|---|---|
| 1-4 September | 4 | +2,373 | +18,567 | FIIs were buyers |
| 7-11 September | 5 | -1,795 | +6,420 | 3.58x |
| 15-18 September | 4 | -7,620 | +11,232 | 1.47x |
| 21-25 September | 5 | -11,490 | +16,397 | 1.43x |
| 28-30 September | 3 | -25,481 | +23,414 | 0.92x |
| Month | 21 | -44,013 | +76,030 | 1.73x |
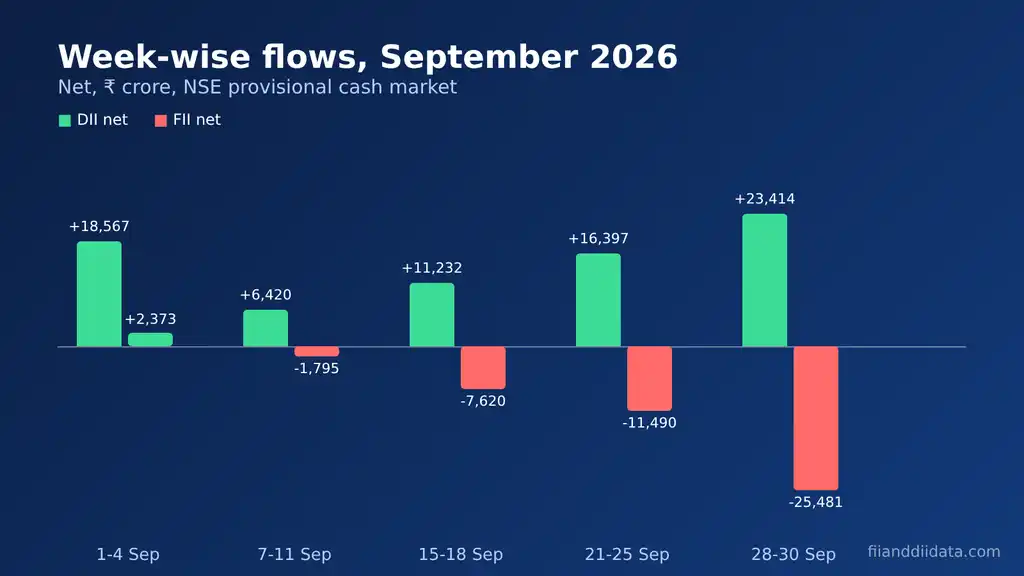
The month started well. FIIs were net buyers in the first week, helped by ₹6,688 crore of buying on 2 September. From there, foreign selling grew every week while DII buying stayed steady. In the final three sessions the cushion finally gave way, with DIIs covering only 92% of foreign selling. That shift is easier to see day by day.
Day-wise FII DII Data September 2026 Table
Here is every session of the month. Positive numbers mean net buying; negative numbers mean net selling. The NSE data shows no session on 14 September.
| Date | FII net (₹ crore) | DII net (₹ crore) |
|---|---|---|
| 1 Sep | +1,143 | +1,847 |
| 2 Sep | +6,688 | +2,813 |
| 3 Sep | -2,346 | +4,977 |
| 4 Sep | -3,112 | +8,930 |
| 7 Sep | +280 | +567 |
| 8 Sep | -123 | +1,350 |
| 9 Sep | -583 | +1,509 |
| 10 Sep | -438 | +1,026 |
| 11 Sep | -931 | +1,968 |
| 15 Sep | -2,978 | +2,686 |
| 16 Sep | -2,033 | +3,908 |
| 17 Sep | -3,209 | +3,618 |
| 18 Sep | +600 | +1,020 |
| 21 Sep | -576 | +2,797 |
| 22 Sep | -3,810 | +4,120 |
| 23 Sep | +1,617 | +2,341 |
| 24 Sep | -5,027 | +4,301 |
| 25 Sep | -3,694 | +2,838 |
| 28 Sep | -5,353 | +5,189 |
| 29 Sep | -9,980 | +6,953 |
| 30 Sep | -10,148 | +11,272 |
Worked example: how concentrated was the FII DII data September 2026 selling?
A monthly total can hide when the money actually moved. Here is a quick way to check, using the table above.
- Add the last three sessions: 5,353 + 9,980 + 10,148 = ₹25,481 crore of FII selling.
- Divide by the monthly total: 25,481 ÷ 44,013 = 57.9%. More than half the month’s selling came in three of 21 sessions.
- Check the cushion for those days: DIIs bought 5,189 + 6,953 + 11,272 = ₹23,414 crore. That is 23,414 ÷ 25,481 = 0.92x.
- Compare with the first half: FIIs sold a net ₹2,400 crore from 1 to 15 September and ₹41,613 crore from 16 to 30 September.
The lesson: a 1.73x monthly ratio looks comfortable, but the market entered October with foreign selling at its fastest pace of the month. That carried straight into the October 2026 FII DII data. So what drove the late surge?
Why FIIs Sold in September 2026
No single event explains the month, but several pressures lined up at once. Business Standard (30 September 2026) described the sell-off as broad, with 40 of the 50 Nifty stocks down for the month to 29 September.
- A US rate hike. The US Federal Reserve raised its policy rate by 25 basis points to 3.75%-4.00% on 16 September 2026, its first hike since July 2023. Higher US rates make dollar assets more attractive than emerging market shares.
- High US bond yields and a strong dollar. Vinit Bolinjkar of Ventura cited “stubbornly” high US yields as a key driver, according to Business Standard.
- Crude oil. Brent rose more than 7% in September to near $97 a barrel, per 5paisa’s 30 September market wrap. Costly oil hurts India’s trade balance and the rupee.
- A weak rupee. The rupee closed September at 95.83 per dollar, down 0.7% for the month. A falling rupee cuts the dollar return of a foreign investor.
- IT stocks. The Nifty IT index fell 11.18% in September on worries about slower global tech spending and AI-led disruption. TCS fell 13.70% to 29 September, the steepest drop in the Nifty.
Which sectors FPIs sold in September 2026
NSDL’s fortnightly sector data, summarised by Finnovate on 7 October 2026, shows financial services took the biggest hit at ₹13,147 crore of net FPI selling. Oil and gas (₹6,854 crore) and autos (₹6,212 crore) followed. FPIs still bought some pockets: consumer services (₹2,333 crore), services (₹2,302 crore) and healthcare (₹2,117 crore). This mix suggests foreign funds were cutting large, liquid holdings rather than leaving India completely.
The Nifty 50 ended September at 22,620.45, down from 24,080.40 at the end of August. That is a fall of 1,459.95 points, or about 6.1%. But the size of the foreign exit depends on which dataset you read.
NSE vs NSDL: Two September Numbers
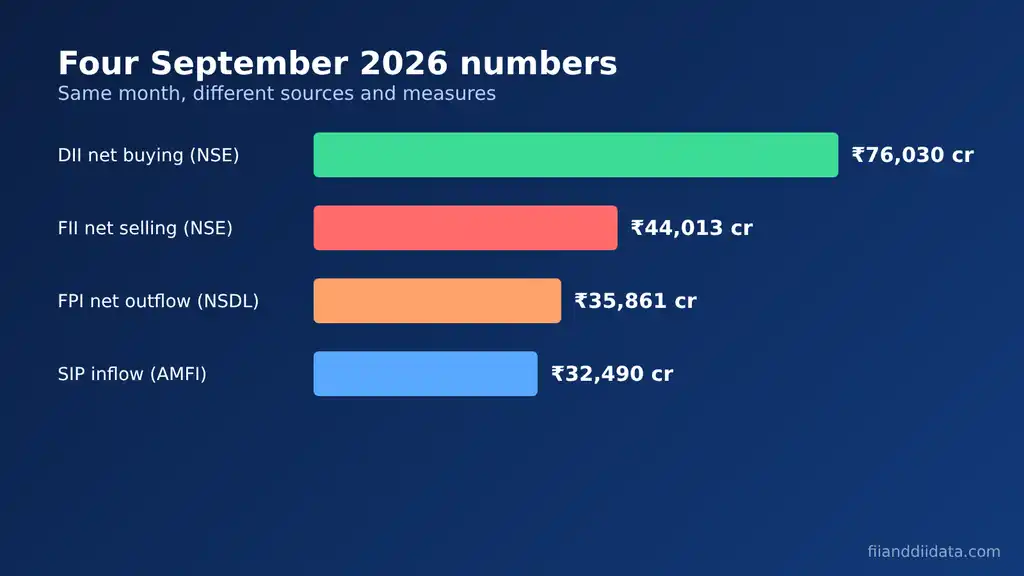
Readers often see two different figures for foreign selling in the same month. Both are correct; they measure different things.
| Dataset | September 2026 figure | What it covers |
|---|---|---|
| NSE provisional FII net | -₹44,013 crore | Secondary market trades on the exchange, released the same evening |
| NSDL FPI net equity | -₹35,861 crore | Exchange trades plus primary market (IPO, QIP) investment, settled data |
| Gap | ₹8,152 crore | Mostly money FPIs put into new issues |
The NSDL figure also tells a sharper story about the trend. On NSDL data, FPIs were net buyers of ₹20,199 crore in July and ₹29,631 crore in August, so September reversed two months of inflows. NSDL also showed ₹20,727 crore of FPI selling in Indian debt during the month. Our guide on why NSE and NSDL FII data differ explains the gap in detail. Either way, domestic buyers had a lot to absorb.
Where the DII Money Came From in September 2026
The steady DII buying in the FII DII data September 2026 numbers starts with retail savers. A SIP (systematic investment plan) is a fixed monthly investment into a mutual fund, and fund managers must invest that cash whatever the market mood.
- SIP inflows: a record ₹32,490 crore in September 2026, up from ₹32,297 crore in August (AMFI data via Outlook Money, 12 October 2026).
- Net equity mutual fund inflows: about ₹38,307 crore in September 2026, per the same report.
- Share of DII buying: SIP money alone equals about 43% of the ₹76,030 crore DII total. The rest came from other fund flows, insurers, pension funds and banks.
This is why DIIs could buy on all 21 days even as prices fell. Our report on SIP inflow in September 2026 covers the mutual fund side in depth, and our FII selling vs DII buying 2026 analysis places September in the full-year picture. Knowing the numbers is one thing; using them well is another. For daily numbers, charts and all our free tools, visit our FII and DII data home page.
How to Use Monthly FII DII Data: A Checklist
We suggest this routine at the end of each month, using September as the model.
- Record both net figures. Note FII and DII net totals from the daily FII DII cash market summary.
- Work out the absorption ratio. Divide DII buying by FII selling. Above 1.5x is a comfortable cushion; 1.0x to 1.2x is thin; below 1.0x means net supply.
- Split the month into weeks. A rising weekly sell figure, as in September, matters more than the monthly total.
- Check the final week. Month-end selling often carries into the next month.
- Compare with NSDL. If the NSDL outflow is much smaller, FPIs may be buying IPOs while selling listed stocks.
- Look at derivatives too. Cash flows show only half the picture. Check index futures positions on our FII DII F&O data page.
Treat this as context, not a buy or sell signal on its own. Even a good checklist fails if you fall into the usual traps.
Common Mistakes When Reading Monthly Flow Data
- Thinking DII buying stops a fall. DIIs out-bought FIIs by ₹32,017 crore in September, and the Nifty still fell about 6.1%.
- Ignoring timing. The monthly 1.73x ratio hid a 0.92x final week.
- Mixing NSE and NSDL figures. ₹44,013 crore and ₹35,861 crore describe the same month but different flows.
- Reading one green day as a turn. FIIs bought ₹1,617 crore on 23 September and sold ₹5,027 crore the next day.
- Forgetting that provisional data can change. NSE figures are provisional and may differ slightly from final settled data.
Avoid these, and monthly data becomes a useful map of who is driving the market. The questions below come up most often.
Frequently Asked Questions
What does the FII DII data September 2026 show?
NSE provisional data shows FIIs net sold ₹44,013 crore and DIIs net bought ₹76,030 crore in the cash market across 21 sessions in September 2026. DIIs bought on every trading day, while FIIs bought on only five.
Why did FIIs sell Indian stocks in September 2026?
A 25 basis point US Fed rate hike on 16 September, high US bond yields, a strong dollar, Brent crude near $97 and a weak rupee all weighed on foreign investors. IT stocks were hit hardest, with the Nifty IT index down 11.18% for the month.
Why is the NSDL FPI figure for September 2026 lower than the NSE figure?
NSDL reported a net FPI equity outflow of ₹35,861 crore, against ₹44,013 crore of FII selling on NSE. NSDL includes primary market investment such as IPOs and QIPs, while NSE provisional data covers only exchange trades.
How much did DIIs buy in September 2026?
DIIs net bought ₹76,030 crore in the NSE cash market. Their biggest day was 30 September, when they bought ₹11,272 crore. Record SIP inflows of ₹32,490 crore supported this buying.
How did the Nifty perform in September 2026?
The Nifty 50 fell from 24,080.40 at the end of August to 22,620.45 on 30 September 2026, a drop of about 6.1%. Market reports described it as the index’s worst September since 2018.
The Bottom Line
September 2026 was a month in which domestic money won on volume but lost on price. DIIs bought ₹76,030 crore and never missed a day, while FIIs sold ₹44,013 crore. Even so, the Nifty fell about 6.1% as a US rate hike, costly oil, a weak rupee and an IT sell-off pushed foreign funds out.
The detail that matters most is timing. Nearly 58% of FII selling came in the last three sessions, when DII buying fell short for the first time in the month. Our practical next step: each month, split the data into weeks and watch the final week’s absorption ratio. For more monthly recaps and guides, browse the FIIAndDIIData.com blog.
Sources: NSE provisional FII/DII cash market data for September 2026, compiled by Ansaar Equities; Business Standard (30 September 2026); 5paisa market wrap (30 September 2026); NSDL FPI data via Finnovate (7 October 2026); AMFI data via Outlook Money (12 October 2026); US Fed decision of 16 September 2026 via Finnovate.
Disclaimer: This article is for educational purposes only and is not investment advice. Please consult a SEBI-registered advisor before making investment decisions.