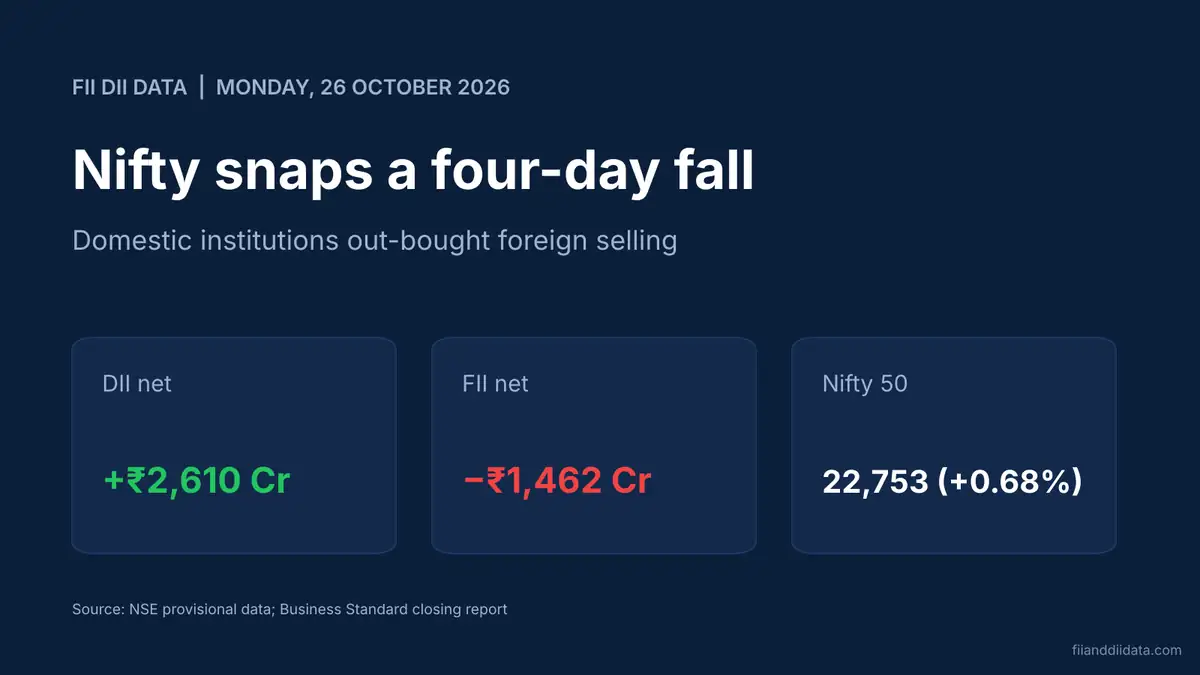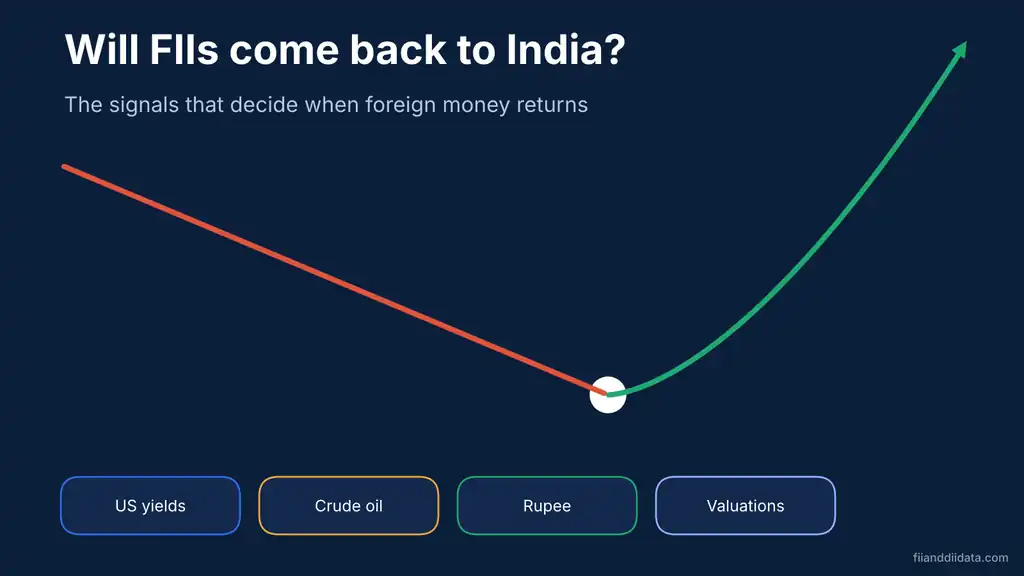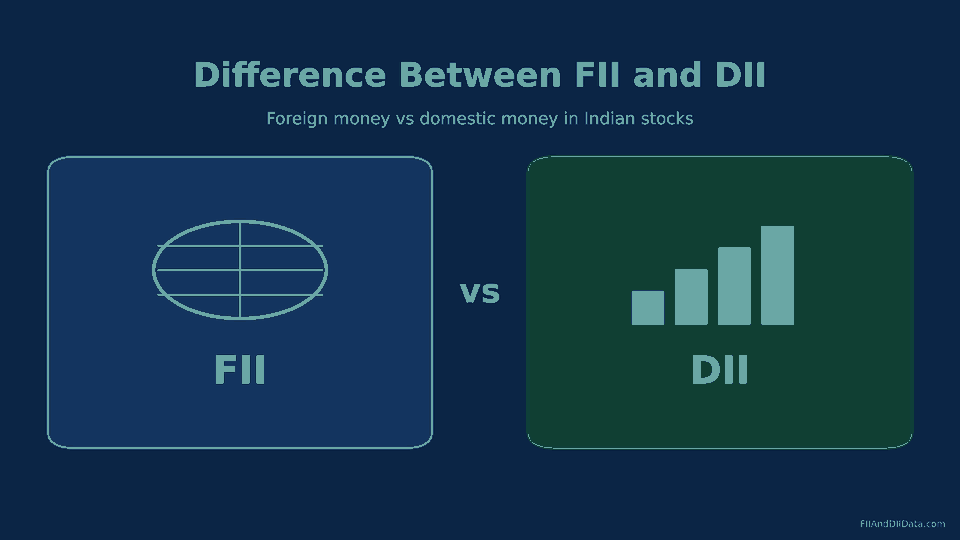
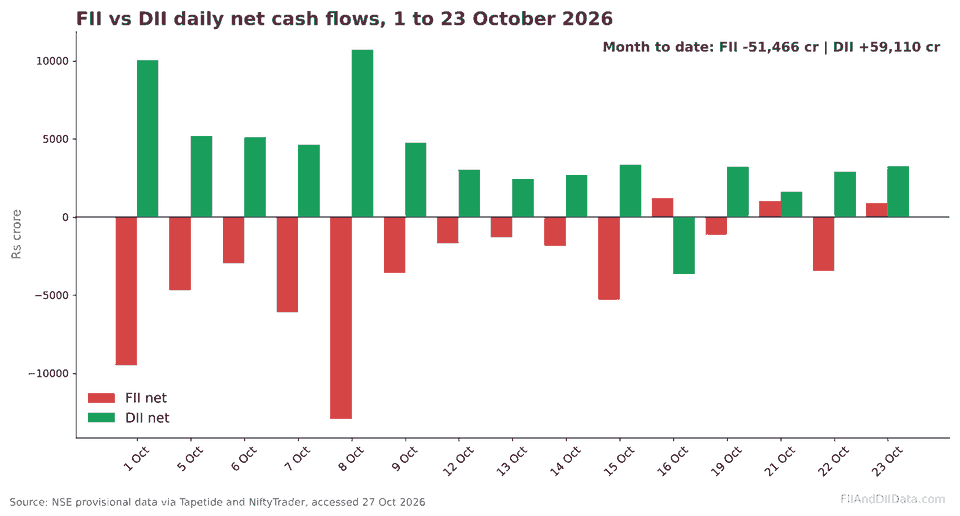
The difference between FII and DII comes down to where the money comes from: FIIs invest foreign capital in Indian markets, while DIIs invest Indian savings. That gap showed clearly in October 2026. Between 1 and 23 October, FIIs sold a net ₹51,466 crore of Indian shares while DIIs bought ₹59,110 crore. This guide explains who each group is, how they behave, and how to read their daily data.
Key Takeaways
- FIIs (now formally called FPIs) are foreign funds; DIIs are Indian mutual funds, insurers, banks and pension funds.
- FII flows react to global rates, the dollar and risk mood; DII flows are steadier because they are fed by monthly SIPs and premiums.
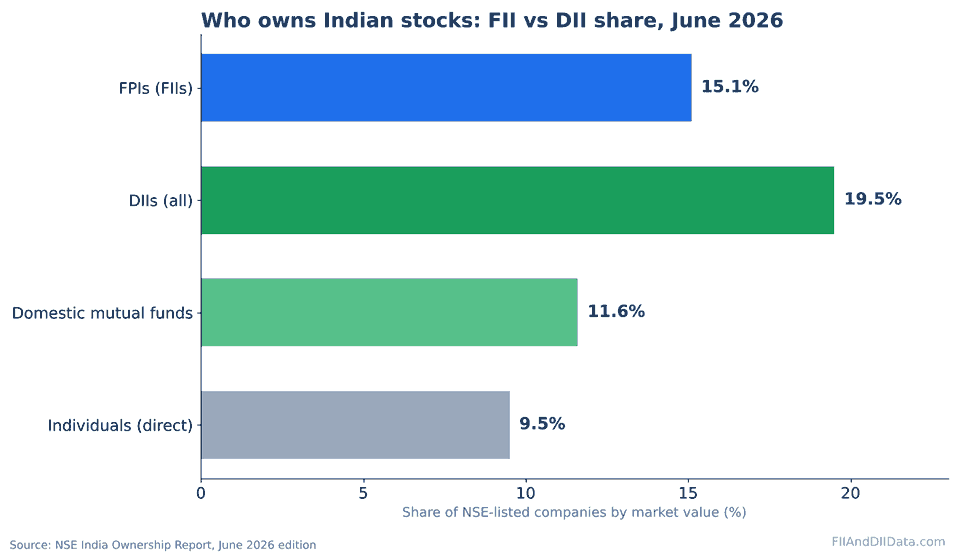
- As of June 2026, DIIs owned 19.5% of NSE-listed companies against 15.1% for FPIs, the widest gap on record.
- In October 2026 (to the 23rd), DIIs bought ₹59,110 crore and more than absorbed ₹51,466 crore of FII selling.
- Read both columns together, over several days, and compare the size of flows, not just their direction.
- What is the difference between FII and DII?
- Who counts as an FII and who counts as a DII
- FII vs DII comparison table: 8 key differences
- Who owns more of the Indian market now
- How to read the difference between FII and DII in daily data
- FII vs DII in October 2026: the latest numbers
- How traders use FII and DII flows: a checklist
- Common mistakes when comparing FII and DII data
- FAQs
- The Bottom Line
What Is the Difference Between FII and DII?
Both FIIs and DIIs are institutional investors. That means they invest pooled money on behalf of many people, in sizes far larger than any retail trader. The core difference is the source of that money and the country where the institution is based.
FII: Foreign Institutional Investor
An FII is a fund based outside India that buys Indian shares, bonds or derivatives. SEBI now registers these investors as foreign portfolio investors (FPIs), so the two terms describe the same group. Our guide on FII vs FPI explains why both names are still used.
DII: Domestic Institutional Investor
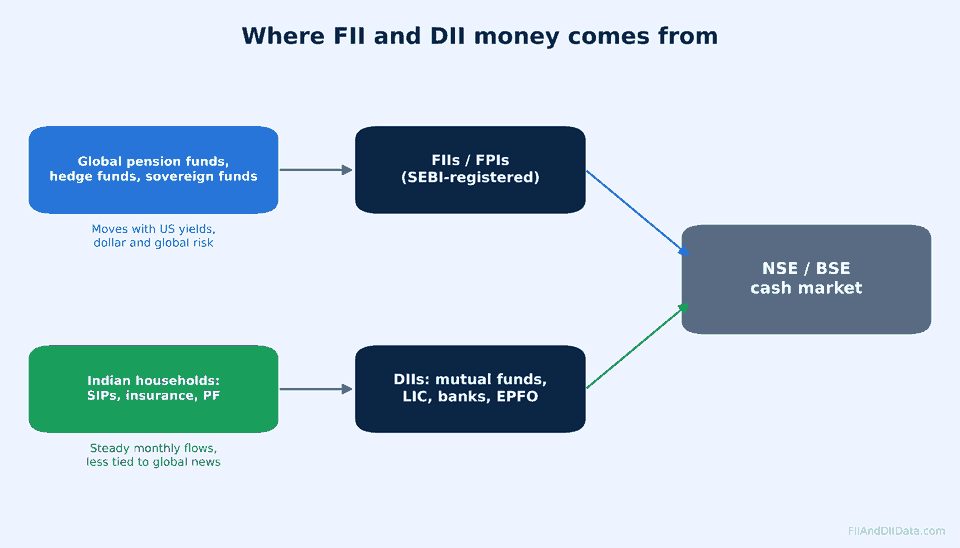
A DII is an institution based in India that invests money raised from Indian savers. The biggest DIIs are mutual funds, insurance companies such as LIC, banks, and pension and provident funds. Much of their buying power comes from monthly SIPs, insurance premiums and retirement contributions.
So the difference between FII and DII is not about skill or size alone. It is about whose money is being invested and what drives it. Next, we look at exactly who sits in each group.
Who Counts as an FII and Who Counts as a DII
Typical FIIs (FPIs) investing in India:
- Global pension funds and endowments
- Sovereign wealth funds and foreign central bank investment arms
- International mutual funds and exchange-traded funds with India exposure
- Hedge funds and foreign insurance companies
Typical DIIs:
- Domestic mutual funds, the largest and fastest-growing DII group
- Life and general insurance companies, led by LIC
- Banks and other domestic financial institutions
- Pension and provident funds such as EPFO and NPS fund managers
The household link explains why DII buying is so steady. In September 2026, monthly SIP contributions hit a record ₹32,490 crore across about 10.06 crore accounts, according to AMFI data reported by Angel One on 13 October 2026. We break that release down in our report on SIP inflow in September 2026.
With the two groups defined, the table below puts every practical difference side by side.
FII vs DII Comparison Table: 8 Key Differences
| Factor | FII (FPI) | DII |
|---|---|---|
| Based in | Outside India | India |
| Source of money | Global investors, in dollars and other currencies | Indian savings: SIPs, premiums, PF and pension money |
| Main drivers | US bond yields, the dollar, global risk mood, valuations | Monthly inflows, valuations, long-term mandates |
| Currency risk | Yes; a weaker rupee cuts their dollar returns | No; they invest and measure returns in rupees |
| Typical behaviour | Fast, can buy or sell heavily within days | Steadier, often buys when FIIs sell |
| Market effect | Often sets short-term direction and adds volatility | Cushions falls and adds stability |
| Regulator | SEBI (FPI Regulations), plus RBI rules on foreign investment | SEBI, IRDAI or PFRDA depending on the institution |
| Share of NSE-listed firms (June 2026) | 15.1% | 19.5% |
The last row is the one that has changed most in recent years, and it changes how you should read daily flows.
Who Owns More of the Indian Market Now
For most of the last two decades, foreign investors held a bigger slice of Indian companies than domestic institutions. That is no longer true. According to the NSE India Ownership Report for June 2026, the picture at 30 June 2026 was:
- FPIs: 15.1% of NSE-listed companies by market value, the lowest in 69 quarters and the fifth straight quarterly fall.
- DIIs: 19.5%, ahead of FPIs for the seventh straight quarter. The 4.4 percentage point gap is the widest since NSE’s analysis began in March 2001.
- Domestic mutual funds: 11.6%, a record high and the 12th straight quarterly rise.
- Individual investors held 9.5% directly.
The same report says FPIs sold about US$15.1 billion in the June 2026 quarter, the largest quarterly outflow on record. A quarter earlier, at 31 March 2026, FPI ownership stood at 15.8%, then a 17-year low, as ANI reported on 22 May 2026.
What this means in practice: heavy FII selling no longer decides the market on its own. Domestic money is now large enough to absorb it. To see that in action, you need to read the daily numbers correctly.
How to Read the Difference Between FII and DII in Daily Data
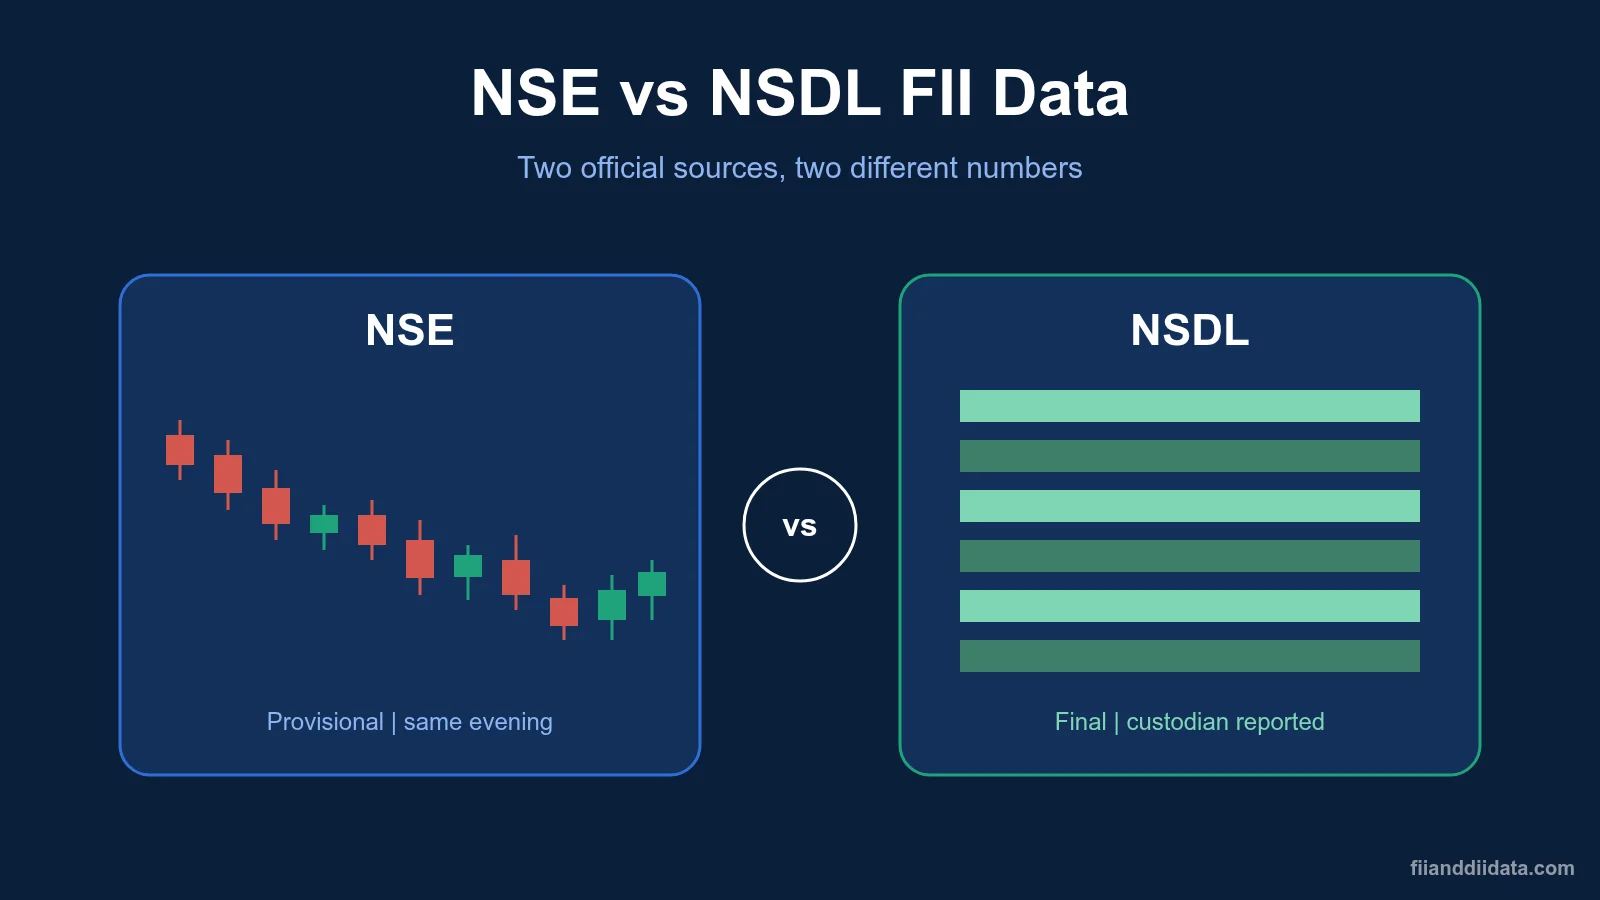
NSE publishes provisional FII and DII cash market figures around 6 PM IST on each trading day. NSDL publishes final FPI figures the next working day, and those also include IPO and other primary market money. Each report shows gross purchases, gross sales and the net value for both groups. If you are new to the report, start with our explainer on what FII and DII data is.
Worked Example: FII vs DII on 22 October 2026
On 22 October 2026, provisional NSE data showed FIIs as net sellers of ₹3,459 crore and DIIs as net buyers of ₹2,891 crore. Here is how to read it in three steps:
- Direction: FIIs sold, DIIs bought. This is the most common pattern of 2026.
- Net institutional flow: -3,459 + 2,891 = -₹568 crore. Domestic buying covered about 84% of the foreign selling (2,891 ÷ 3,459).
- Meaning: When the net figure is negative, the index often drifts lower even though DIIs were buyers. The next day, 23 October, both groups bought (FIIs +₹888 crore, DIIs +₹3,235 crore), giving a positive net flow of about ₹4,123 crore.
The Four FII and DII Patterns
- FII buy, DII buy: strongest support for prices.
- FII buy, DII sell: often DIIs booking profits into foreign demand.
- FII sell, DII buy: domestic money absorbing foreign exits; the net size decides the index move.
- FII sell, DII sell: rare and usually linked to sharp falls.
One day is only one data point. The October 2026 numbers show why the trend matters more.
FII vs DII in October 2026: The Latest Numbers
| Date | FII net (₹ crore) | DII net (₹ crore) | Pattern |
|---|---|---|---|
| 1 Oct 2026 | -9,484 | +10,042 | FII sell, DII buy |
| 8 Oct 2026 | -12,944 | +10,703 | FII sell, DII buy |
| 15 Oct 2026 | -5,285 | +3,319 | FII sell, DII buy |
| 16 Oct 2026 | +1,166 | -3,661 | FII buy, DII sell |
| 21 Oct 2026 | +1,022 | +1,614 | Both buy |
| 22 Oct 2026 | -3,459 | +2,891 | FII sell, DII buy |
| 23 Oct 2026 | +888 | +3,235 | Both buy |
| 1 to 23 Oct 2026 | -51,466 | +59,110 | DIIs absorbed all FII selling |
Three things stand out. FIIs were net sellers on 12 of 15 sessions, with the heaviest day on 8 October. DIIs bought on 14 of 15 sessions. And on the only day DIIs sold, 16 October, FIIs were buyers. Over the 12 months to late October 2026, Tapetide’s rolling figures show FIIs as net sellers of about ₹5,08,487 crore and DIIs as net buyers of about ₹8,74,153 crore.
The reasons behind the foreign selling, from US yields to crude oil, are covered in our analysis of why FIIs are selling Indian stocks. For longer history, see the FII DII monthly data page. Knowing the numbers is useful only if you have a routine for using them.
How Traders Use FII and DII Flows: A Checklist
Run through these six points each evening once the provisional figures are out on our FII DII data today page:
- Note the direction for both groups and place the day in one of the four patterns.
- Add FII net and DII net to get the net institutional flow.
- Update a five-day and ten-day running total for each group.
- Check FII positions in index futures on the participant-wise open interest tracker. Cash buying while futures shorts rise may only be a hedge.
- Note one macro driver: US bond yields, the dollar, crude oil or a large IPO.
- Once a month, compare total DII buying with that month’s SIP inflow to judge how much domestic support is left.
For daily numbers, charts and all our free tools, visit our FII and DII data home page. The checklist works best when you avoid a few traps that catch many traders.
Common Mistakes When Comparing FII and DII Data
- Treating FII selling as automatically bearish. In October 2026, DIIs bought more than FIIs sold.
- Ignoring size. DII buying of ₹2,891 crore against FII selling of ₹3,459 crore is still a net outflow.
- Mixing NSE and NSDL numbers. NSE gives provisional exchange data; NSDL gives final FPI data that includes primary market money.
- Reading one day as a trend. Use running totals over at least five sessions.
- Forgetting the rupee. A falling rupee reduces FII returns in dollars and can trigger more selling, while it does not affect DIIs in the same way.
Frequently Asked Questions
What is the difference between FII and DII?
FIIs (foreign institutional investors, now called FPIs) are funds based outside India that invest foreign money in Indian markets. DIIs (domestic institutional investors) are Indian institutions such as mutual funds, insurers, banks and pension funds that invest Indian savings. FII flows react more to global factors, while DII flows are steadier.
Which is more powerful, FII or DII?
Both matter, but the balance has shifted. As of June 2026, DIIs owned 19.5% of NSE-listed companies against 15.1% for FPIs, according to NSE. FIIs can still move the market sharply on a single day, but DIIs now have enough money to absorb large foreign selling.
What happens when FII sells and DII buys?
The market impact depends on the size of each flow. If DII buying is larger than FII selling, prices often hold steady. If FII selling is larger, the index can still fall. In October 2026 up to the 23rd, DIIs bought ₹59,110 crore against FII selling of ₹51,466 crore.
Are FII and FPI the same?
Yes, in practice. SEBI now registers foreign investors as foreign portfolio investors (FPIs), but market reports and news still commonly use the older term FII for the same group.
What time is FII and DII data released?
NSE releases provisional FII and DII cash market data around 6 PM IST on trading days. NSDL publishes final FPI figures the next working day.
The Bottom Line
The difference between FII and DII is the difference between global money and Indian savings. FIIs move fast and respond to world events. DIIs move more slowly and are fed by a steady stream of SIPs, premiums and pension contributions.
In 2026, domestic institutions have overtaken foreign investors in ownership and have absorbed record foreign selling. That does not make FII flows irrelevant; they still drive many short-term moves. Your next step: track both columns for one week on our FII DII data dashboard using the six-point checklist above.
Sources: NSE India Ownership Report, June 2026 edition (August 2026); ANI, NSE ownership data (22 May 2026); NSE provisional FII/DII cash data via Tapetide and NiftyTrader (accessed 27 October 2026); Angel One, AMFI SIP data (13 October 2026). Data as of 27 October 2026.
Disclaimer: This article is for educational purposes only and is not investment advice. Please consult a SEBI-registered advisor before making investment decisions.