The BEL share price is the market price of one share of Bharat Electronics Limited, a Navratna public sector company under the Ministry of Defence that is listed on NSE and BSE. The price changes through every trading session, so this guide does not quote a figure. Instead, it explains what the company does, where to find the official quote, which ratios to check and how to read price moves, with a worked example using hypothetical numbers.
Key Takeaways
- Bharat Electronics Limited was set up in 1954 and describes itself as a Navratna public sector undertaking under the Ministry of Defence.
- The official quote comes from NSE (symbol BEL) and BSE (scrip code 500049); always confirm the symbol on the exchange site.
- A share price alone says little. Compare it with earnings, book value, order book and cash flow before forming a view.
- Defence orders arrive in large, uneven lumps, so quarterly results can swing even when the long-term picture is steady.
- This guide shows the method with hypothetical numbers and gives no price target or buy or sell advice.
- What Drives the BEL Share Price: The Business Behind It
- How the Company Makes Money
- Where to Check the BEL Share Price From Official Sources
- What Moves the BEL Share Price
- Ratios to Study Beside the BEL Share Price
- Worked Example: Reading a Price With Hypothetical Numbers
- Risks to Understand Before You Invest
- Pros and Cons of Tracking the BEL Share Price
- FAQ
- The Bottom Line
What Drives the BEL Share Price: The Business Behind It
Bharat Electronics Limited (BEL) was established in 1954 and has its corporate office in Bengaluru. On its own website, the company calls itself a Navratna public sector undertaking under the Ministry of Defence, Government of India. Its core business is defence electronics, supplying the Army, Navy and Air Force, and it also works in selected areas of professional electronics. The company operates through 9 units.
Public descriptions of its products include radars, weapon systems, sonars, fire-control systems, defence communication and electronic voting machines. BEL’s website also lists diversification into areas such as homeland security, smart cities, space electronics, network and cyber security, railways and metro, airport solutions, solar, energy storage and EV charging. Which of these areas contribute most to sales changes over time, so read the latest annual report for the current split.
How the BEL share price is set on the exchange
A share price is simply the rate at which the latest buyer and seller agreed to trade on the exchange. When more people want to buy than sell, the price moves up, and the reverse pushes it down. The price does not tell you whether the company is large, cheap or expensive. For that you need the market capitalisation, which is the share price multiplied by the number of shares, and the ratios covered below.
Reading the BEL share price quote screen
A typical quote page shows the last traded price, the previous close, the day’s high and low, the 52-week range, traded volume and the buy and sell quantities waiting in the order book. Exchanges can also set price bands that limit how far a stock may move in one day, and the band can differ from stock to stock.
How the Company Makes Money
A defence electronics maker earns revenue when it delivers systems against contracts. The sequence is usually the same: a customer such as the armed forces issues a requirement, the company bids or is nominated, a contract is signed, the company designs and builds the equipment, and revenue is booked as work is delivered. The value of signed work that is yet to be delivered is called the order book, and it is one of the first numbers investors look at.
Because contracts run over many months or years, revenue depends on execution speed as much as on new orders. A large order signed this quarter may show up in sales only over the next several years. The business also needs working capital, meaning cash tied up in raw material, work in progress and money owed by customers. Slow payments or delayed deliveries can strain cash flow even in a profitable year.
Where to Check the BEL Share Price From Official Sources
Use the exchanges for quotes and the company for financial documents. Prices shown on websites and apps can be delayed, and the delay differs by provider, so always check the time stamp next to a quote. Our guide to NSE vs BSE explains how the two exchanges differ.
| What you need | Where to find it |
|---|---|
| Quote on NSE | NSE India, search the symbol BEL |
| Quote on BSE | BSE India, search scrip code 500049 |
| Quarterly results and filings | Corporate announcements section on NSE or BSE |
| Annual report and presentations | Investor section of the BEL website |
| Shareholding pattern | Filed every quarter on NSE and BSE |
| Rules for listed companies | SEBI |

Why the BEL share price needs context from filings
A chart shows what traders did, while filings show what the company did. When the price jumps, open the corporate announcements for that day. You may find a results release, an order win or a change in shareholding.
What Moves the BEL Share Price
No single factor explains a move, but a few groups of drivers come up again and again for a defence electronics company.
- Order announcements. Large contract wins are disclosed to the exchanges. The market reacts to the size of the order compared with the company’s yearly sales, not to the headline number alone.
- Quarterly results. Revenue, margins and the order book update every quarter. Compare each figure with the same quarter a year earlier, because defence deliveries are uneven within a year.
- Government policy and budgets. Decisions on defence spending, local manufacturing and procurement rules can change sentiment for the whole sector.
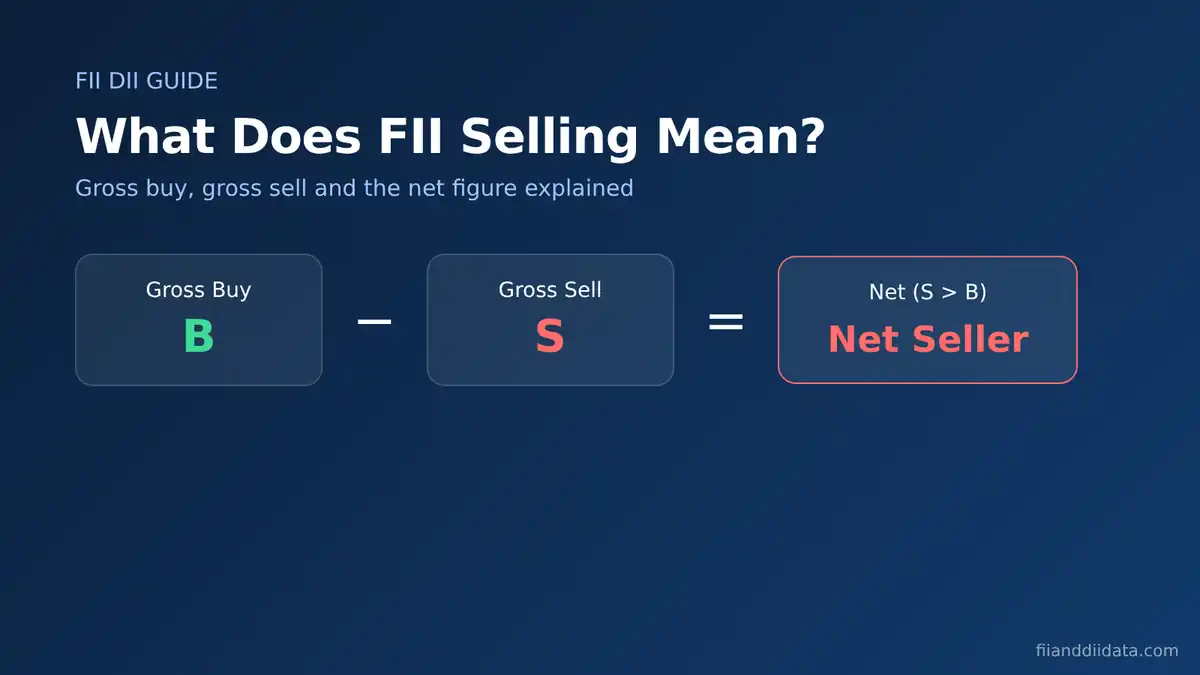
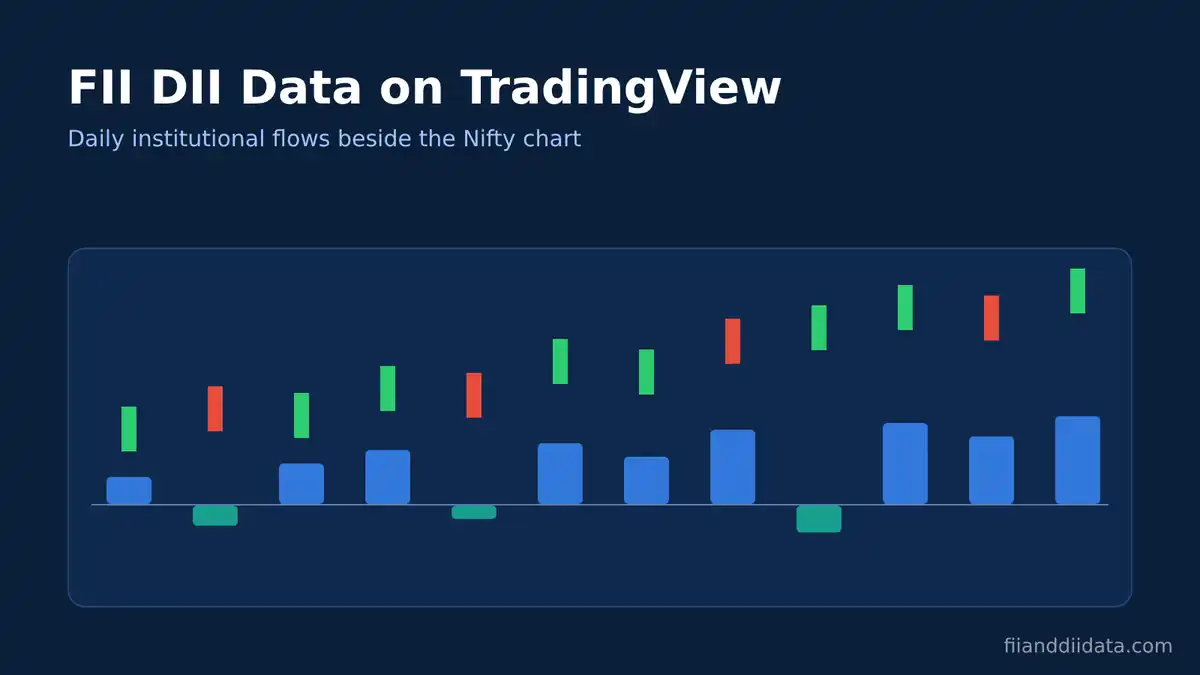
- Market-wide flows. Foreign and domestic institutions move large amounts. Our explainer on what FII selling means shows how to read gross and net figures, and our FII and DII data page shows the daily numbers after market close.
- Valuation. When expectations rise faster than earnings, the price can fall even on good news. The reverse can also happen.
- Ownership changes. A shift in holdings by institutions or the promoter shows up in the quarterly pattern. See shareholding pattern meaning for how to read it.
Ratios to Study Beside the BEL Share Price
Ratios turn a price into something you can compare across years and across companies. The table lists the ones that suit a manufacturer with long contracts. We do not quote current values here; read them from the latest filings.
| Ratio | What it tells you | Where the inputs come from |
|---|---|---|
| PE ratio | Price paid for each rupee of yearly profit | Price and earnings per share |
| PB ratio | Price compared with book value per share | Balance sheet |
| Return on equity | Profit earned on shareholders’ money | Profit and net worth |
| Order book to sales | Years of sales already contracted | Investor presentation and annual report |
| EV to EBITDA | Value of the whole business against operating profit | Market value, debt, cash and EBITDA |
| Receivable days | How long customers take to pay | Balance sheet and sales |
Read our guides to the PE ratio, the PB ratio and EBITDA vs EBIT for the formulas and common mistakes. A single ratio can mislead, so compare each one with the company’s own history and with similar companies.

Worked Example: Reading a Price With Hypothetical Numbers
Suppose a defence electronics company called Sample Electronics reports the figures below. They are invented for learning and are not BEL’s numbers. The same steps work for any listed manufacturer once you fill in real data.
| Item | Hypothetical value |
|---|---|
| Share price | ₹200 |
| Number of shares | 100 crore |
| Yearly revenue | ₹5,000 crore |
| Yearly EBITDA | ₹1,500 crore |
| Yearly net profit | ₹1,000 crore |
| Net worth | ₹5,000 crore |
| Cash, with no debt | ₹2,000 crore |
| Order book | ₹15,000 crore |
| Money owed by customers | ₹1,250 crore |
Step 1: Market capitalisation, EPS and PE
Market capitalisation = ₹200 x 100 crore shares = ₹20,000 crore. Earnings per share (EPS) = ₹1,000 crore divided by 100 crore shares = ₹10. PE ratio = ₹200 divided by ₹10 = 20. This means buyers pay ₹20 for each ₹1 of yearly profit.
Step 2: Book value, PB and return on equity
Book value per share = ₹5,000 crore divided by 100 crore shares = ₹50. PB ratio = ₹200 divided by ₹50 = 4. Return on equity = ₹1,000 crore divided by ₹5,000 crore = 20 percent. Net profit margin = ₹1,000 crore divided by ₹5,000 crore = 20 percent.
Step 3: Order book cover, EV to EBITDA and receivable days
Order book cover = ₹15,000 crore divided by ₹5,000 crore = 3 years of current sales. Enterprise value = ₹20,000 crore minus ₹2,000 crore cash = ₹18,000 crore. EV to EBITDA = ₹18,000 crore divided by ₹1,500 crore = 12. Receivable days = ₹1,250 crore divided by ₹5,000 crore x 365 = 91.25 days.
Step 4: What happens if the facts change
First, suppose the price rises to ₹250 with no change in profit. PE becomes ₹250 divided by ₹10 = 25, PB becomes ₹250 divided by ₹50 = 5, and market capitalisation becomes ₹25,000 crore. The business is the same, but you now pay more for it. Second, suppose the price stays at ₹200 and profit falls 10 percent to ₹900 crore. EPS becomes ₹9 and PE becomes about 22.2. Third, suppose the order book falls to ₹10,000 crore with sales unchanged. Order book cover drops to 2 years, a sign to read the next results carefully.
| Scenario | Price | EPS | PE | PB |
|---|---|---|---|---|
| Base case | ₹200 | ₹10 | 20.0 | 4.0 |
| Price rises to ₹250 | ₹250 | ₹10 | 25.0 | 5.0 |
| Profit falls 10 percent | ₹200 | ₹9 | 22.2 | 4.0 |
The lesson is that a price must always be read next to earnings, book value and order cover. The same ₹200 can look reasonable or stretched depending on the numbers beneath it.
Risks to Understand Before You Invest
- Customer concentration. The core business supplies the armed forces, so policy changes or delays in government decisions can affect orders and payments.
- Lumpy order flow. Large contracts arrive unevenly, so one quarter can look strong or weak without changing the long-term picture.
- Execution risk. Complex systems can face design changes, supply gaps or delivery delays that push revenue into later periods.
- Working capital strain. Slow customer payments raise receivable days and can reduce cash flow even when profit is healthy.
- Valuation risk. A rich PE ratio leaves less room for disappointment. A low one may reflect real concerns.
- Market and flow risk. Broad selling by institutions can pull down good stocks along with weak ones.
Pros and Cons of Tracking the BEL Share Price
| Pros | Cons |
|---|---|
| Listed on both NSE and BSE, so quotes and filings are easy to find | Price alone does not show value; ratios and filings are needed |
| Company files results, announcements and shareholding every quarter | Order flow is uneven, so quarterly numbers can mislead |
| Clear business drivers such as order book and execution | Government policy and budget decisions are outside the company’s control |
| Studying one company teaches skills you can reuse on other manufacturers | Sector sentiment can move the price more than company news |
| Public documents let you check every claim yourself | Quotes on third-party sites can be delayed or wrong |
FAQ
What is the BEL share price today?
The price changes every trading session, so this article does not quote one. Check the latest quote on NSE under the symbol BEL or on BSE under scrip code 500049, and note the time stamp.
Which exchanges list Bharat Electronics Limited?
The company is listed on NSE with the symbol BEL and on BSE with scrip code 500049. Confirm both on the exchange websites before you search.
What does Bharat Electronics Limited do?
It makes defence electronics for the Army, Navy and Air Force, including systems such as radars and communication equipment, and has diversified into areas such as homeland security, railways and space electronics, according to the company website.
What affects the BEL share price?
Order announcements, quarterly results, government policy, institutional flows, valuation and overall market mood all play a part. No single factor explains every move.
Is a high or low BEL share price good or bad?
A higher rupee price does not mean an expensive stock, and a lower one does not mean a cheap stock. Compare the price with earnings, book value and order book using ratios such as PE and PB.
The Bottom Line
The BEL share price is a number that changes daily, while the story behind it is a defence electronics business built on long contracts, an order book and steady execution. Get the quote from NSE or BSE, then read the filings and ratios before drawing any conclusion. A price move with no change in earnings or orders is only a change in what buyers will pay.
A practical next step is to download the latest annual report and one quarterly result, then repeat the worked example above with the real figures. For more explainers, browse the blog section.
Sources: Bharat Electronics Limited website for the company description and business areas; NSE India and BSE India for listing details and quotes; SEBI for listed company rules. The symbol and scrip code come from public company profiles and should be confirmed on the exchange sites. Worked example numbers were calculated for this article with hypothetical inputs.
Disclaimer: This article is for educational purposes only and is not investment advice. It gives no price target and no recommendation to buy or sell. Share prices can fall as well as rise. Please consult a SEBI-registered advisor before making investment decisions.