The smart money meaning in the stock market is simple: it is money managed by institutions that have large capital, research teams and early access to information. In India, we track it through FII and DII flows. In the week to 6 November 2026, FIIs bought a net ₹45,960 crore while DIIs sold ₹24,197 crore, so two institutional groups took opposite sides.
Key Takeaways
- Smart money is capital run by informed institutions, not a guarantee of correct trades.
- In India, FIIs, DIIs and proprietary traders are the groups most people track as smart money.
- From 2 to 6 November 2026, FIIs bought ₹45,960 crore and DIIs sold ₹24,197 crore in the cash market.
- Combine FII and DII flows, check the trend over weeks, and confirm with NSDL final data.
- One strong day is a signal to watch, not a reason to buy.
- Smart money meaning in the Indian stock market
- Who counts as smart money in India
- Why smart money matters
- Smart money meaning: a worked example
- Latest data, 2 to 6 November 2026
- How to track smart money step by step
- Smart money vs retail money
- Common mistakes
- FAQs
- The Bottom Line
Smart Money Meaning in the Indian Stock Market
Smart money is capital controlled by investors who have an edge. They manage large funds, employ research teams, meet company managements directly and can afford to wait. The phrase does not mean these investors are always right. It means their trades carry information that smaller investors rarely have.
Large investors also leave footprints. A fund that wants to buy ₹5,000 crore of shares cannot do it in one order without pushing the price up. It buys over days or weeks, and that pattern appears in the daily numbers. In India, the closest public view is the buying and selling of foreign institutional investors (FIIs, also called foreign portfolio investors or FPIs) and domestic institutional investors (DIIs), such as mutual funds, insurers and pension funds.
So who exactly belongs in this group, and who does not?
Who Counts as Smart Money in India
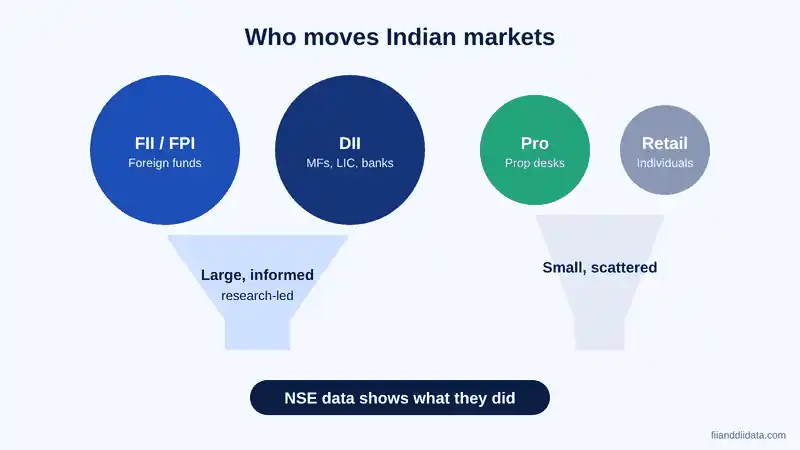
NSE splits market participants into four groups in its participant-wise data: FII, DII, Pro and Client. The first three are usually treated as smart money. Here is how each one behaves.
- FIIs and FPIs: global funds that invest in Indian shares and bonds. They react to the rupee, US yields, crude oil and global risk appetite. Our guide on the difference between FII and DII explains both groups in detail.
- DIIs: Indian mutual funds, insurers, banks and pension funds. They receive steady money from SIPs and premiums, so they often buy when foreign funds sell.
- Pro traders: firms and market makers that trade their own capital, mostly in futures and options. Read our note on pro vs client open interest for how to read them.
- Clients: individuals and other traders. This group is the usual contrast to smart money.
Being a large institution does not make a trade correct, as the next section shows.
Why Smart Money Matters to Market Watchers
Smart money matters for three reasons. First, its size moves prices. Heavy buying lifts index levels and heavy selling pulls them down. Second, it reacts early to macro changes such as crude oil, bond yields and the rupee. Third, it shows where large investors see value, which helps you spot sectors and themes before they become headlines.
Take the first week of November 2026. Business Standard reported that Brent crude fell nearly 18% from its 30 October high, and the rupee closed at 93.91 per dollar on 6 November, its strongest close since 22 April 2026. FIIs bought in all five sessions that week. The macro shift and the flows moved together.
But reading flows takes a method, so let us walk through one with real numbers.
Smart Money Meaning: A Worked Example with NSE Numbers
Headline FII buying tells you who bought, not how much fresh institutional money arrived. Use Thursday, 5 November 2026, when NSE provisional data showed FIIs buying ₹14,974.68 crore and DIIs selling ₹10,444.54 crore.
- Combine the flows. ₹14,974.68 crore minus ₹10,444.54 crore leaves a net institutional inflow of ₹4,530.14 crore.
- Find the DII share. ₹10,444.54 divided by ₹14,974.68 is 69.7%. Domestic funds absorbed about 70% of foreign buying that day.
- Check the price reaction. The Nifty 50 closed at 24,536.60, up 2.40%. Heavy FII buying met heavy DII selling, yet the index still rose.
- Zoom out. Over the full week, FIIs bought ₹45,960.02 crore and DIIs sold ₹24,196.52 crore, a net inflow of about ₹21,764 crore.
The lesson: the smart money meaning is not one group’s view. It is the net result of several large groups, and you need both sides of the trade to read it.
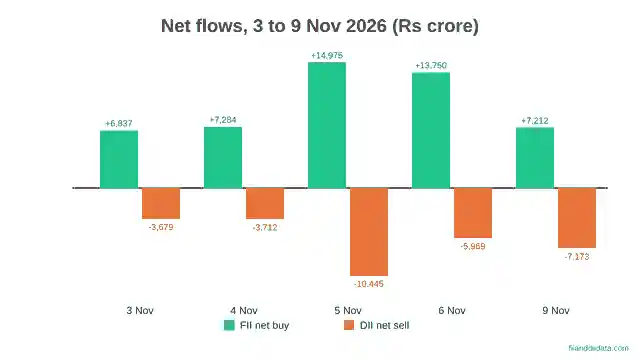
Now the full day-wise picture for that week.
Latest Data: Smart Money Flows from 2 to 6 November 2026
The table uses NSE provisional cash market figures, which NSE releases after market close each trading day. Provisional numbers can be revised, and NSDL publishes final FPI data on the next working day.
| Date | FII net (₹ cr) | DII net (₹ cr) | Combined (₹ cr) | Nifty close |
|---|---|---|---|---|
| 2 Nov (Mon) | +3,114.68 | -392.20 | +2,722.48 | 23,440.80 |
| 3 Nov (Tue) | +6,836.81 | -3,678.85 | +3,157.96 | 23,810.85 |
| 4 Nov (Wed) | +7,284.03 | -3,712.23 | +3,571.80 | 23,960.60 |
| 5 Nov (Thu) | +14,974.68 | -10,444.54 | +4,530.14 | 24,536.60 |
| 6 Nov (Fri) | +13,749.82 | -5,968.70 | +7,781.12 | 25,030.35 |
| Week | +45,960.02 | -24,196.52 | +21,763.50 | 25,030.35 |
What the smart money meaning tells us from this week
FIIs bought on all five days and DIIs sold on all five. Both are institutions, yet they disagreed. Foreign funds were chasing a rally driven by cheaper crude and a firmer rupee, while domestic funds booked profits. Our weekly FII DII report for 6 November covers the full story.
The F&O market added a clue. As per NSE participant data shown by Quantsapp, FIIs cut their net short in index futures from 1,85,979 contracts on 4 November to 1,00,416 on 6 November. They remained net short, which suggests hedged optimism and not an all-in bet.
Keep the longer trend in view too. NSDL data cited by Angel One showed FPIs were still net sellers of ₹2,72,452 crore in 2026 up to 5 November. One strong week did not erase that. Next, how to build a routine around these numbers.
How to Track Smart Money Step by Step
You do not need a paid tool. A short evening routine with free official data is enough.
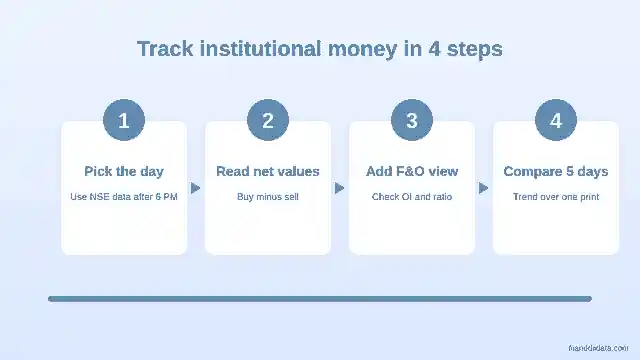
- After market close, check the provisional FII and DII cash figures. Our FII DII data today page shows them each evening.
- Add the two numbers to get the combined flow, then calculate the DII share of FII buying or selling.
- Look at five-day and monthly totals, not one day. Our FII DII monthly data page gives a steadier view.
- Open participant-wise open interest to see whether FIIs are adding or cutting index futures shorts. Start with our guide to participant-wise OI meaning.
- Confirm with NSDL final data the next working day, and note any gap between the two sources.
For a bigger toolkit, read how to use FII DII data for trading, or browse all FII and DII data on the home page.
Smart Money vs Retail Money: Key Differences
The two groups differ less in intelligence than in position and process.
- Time horizon: institutions often build positions over weeks and hold for quarters. Many retail traders act on a single day’s move.
- Information: funds run company meetings, channel checks and models. Individuals mostly rely on public news and charts.
- Size and cost: large funds move prices when they trade, so they spread orders out. Small investors can enter and exit quickly.
- Constraints: funds follow mandates, redemptions and risk limits. Their selling can be forced, not a view on the stock.
Because funds have constraints, copying them blindly is risky. Here are the mistakes we see most.
Common Mistakes When Following Smart Money
- Treating one day as a trend. A record day, like 5 November 2026, can reverse within a week.
- Reading FII data alone. Without DII flows, you miss who absorbed the trade.
- Calling provisional data final. NSE figures can differ from NSDL’s later numbers.
- Ignoring the macro cause. Flows follow crude, yields and the rupee. If those turn, flows often turn too.
- Assuming institutions never lose. Large funds make wrong calls and sometimes sell only because investors redeem.
With these mistakes in mind, the questions below clear up the rest.
Frequently Asked Questions
What is the smart money meaning in the stock market?
Smart money is capital managed by informed, well-resourced investors such as foreign funds, mutual funds, insurers and professional trading firms. Their trades are watched because they often reflect research and early information that smaller investors lack.
Who is smart money in India?
Most analysts treat FIIs (FPIs), DIIs and proprietary traders as smart money. NSE reports FII, DII, Pro and Client activity separately, and the Client group is usually the contrast.
Are FIIs always smart money?
No. FIIs are large and well-informed, but they can be wrong and may sell because of global redemptions or risk limits. In the week to 6 November 2026, FIIs bought ₹45,960 crore while DIIs sold ₹24,197 crore, so two institutional groups disagreed.
How can I track smart money in India?
Check NSE provisional FII and DII cash figures after market close, add the two flows, study five-day and monthly totals, and confirm with NSDL final FPI data the next working day. Participant-wise open interest shows futures positioning.
Is smart money always right?
No. Smart money has an information edge but no guarantee. FIIs were still net sellers of ₹2,72,452 crore in 2026 up to 5 November, according to NSDL data cited by Angel One, even after a record week of buying.
The Bottom Line
Smart money is large, informed institutional capital, and in India you can see its footprints in FII, DII and Pro data. It is a useful signal, not a verdict. Between 2 and 6 November 2026, foreign and domestic institutions traded on opposite sides, which shows why you need both sets of numbers.
As a next step, spend five minutes each evening on the FII and DII cash figures, add them up, and compare them with the five-day trend.
Sources: NSE India provisional cash market data via Upstox and 5paisa (accessed 7 Nov 2026); NSDL FPI Monitor; Angel One (6 Nov 2026); Business Standard (6 Nov 2026); NSE participant data via Quantsapp (6 Nov 2026). Data as of 7 November 2026.
Disclaimer: This article is for educational purposes only and is not investment advice. Please consult a SEBI-registered advisor before making investment decisions.