FII DII data for intraday trading is best used as a morning bias filter, not as an entry signal, because NSE publishes it after the market closes. On 3 November 2026, FIIs bought a net ₹6,837 crore while DIIs sold ₹3,679 crore, and Nifty opened higher the next morning. This guide shows how to turn those evening numbers into a simple plan for the next session, and where the data stops helping.
Key Takeaways
- FII and DII figures arrive around 6 PM IST, so intraday traders can only use them for the next day’s plan.
- Use the data to set a bias (bullish, bearish or neutral), then let price action in the first 15 to 30 minutes confirm it.
- Streaks and F&O positions matter more than one day’s cash number.
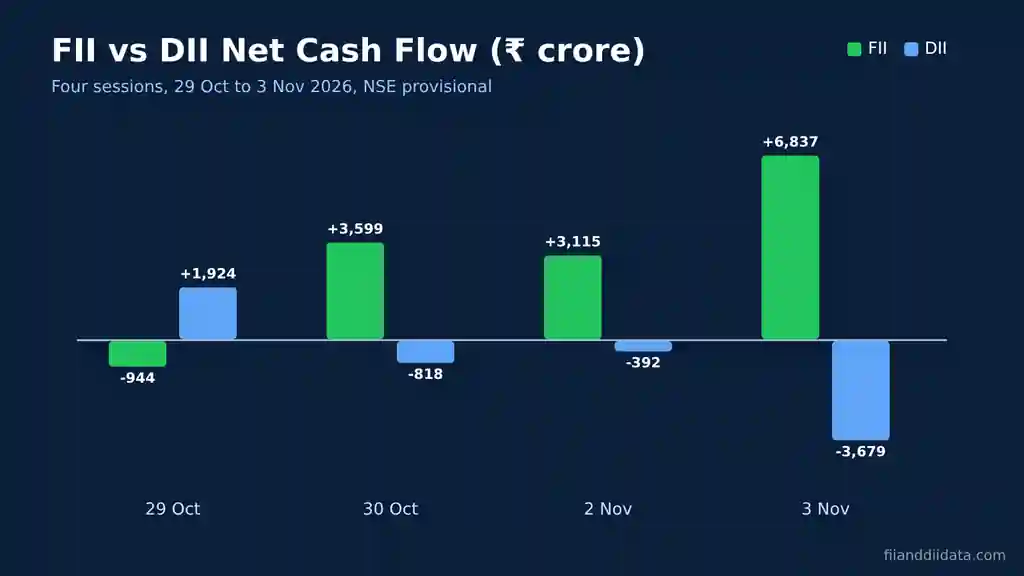
- From 29 October to 3 November 2026, FIIs bought a net ₹12,607 crore over four sessions while DIIs sold ₹2,965 crore.
- Risk control decides results: a SEBI study found over 70% of individual intraday traders lost money in FY23.
- What FII DII data tells an intraday trader
- When the data arrives, and why timing matters
- How to turn FII DII data for intraday into a bias
- Latest example: 29 October to 3 November 2026
- A 5-step morning routine
- Worked example with position sizing
- Common mistakes to avoid
- FII DII data vs other intraday tools
- FAQs
- The Bottom Line
What FII DII Data Tells an Intraday Trader
FII DII data is the daily record of how much foreign institutional investors (FIIs) and domestic institutional investors (DIIs) bought and sold in the cash market. FIIs are overseas funds; DIIs are Indian mutual funds, insurers such as LIC, banks and pension funds. Each group gets three numbers: gross purchase, gross sales and net value. A positive net value means net buying.
For an intraday trader, these numbers answer one question: which way was big money leaning yesterday? Institutions trade in large blocks over many days, so a strong buying or selling trend tends to carry into the next session’s opening mood. If you are new to the terms, our guide on how to check FII DII data walks through the report line by line.
What the data cannot tell you
The data does not show where institutions bought during the day, which stocks they traded or what they will do tomorrow. It is a summary of the session that has already ended. That limit shapes everything else in this guide, starting with timing.
When FII DII Data Arrives, and Why Timing Matters for Intraday
NSE publishes provisional FII and DII cash market figures on its FII/DII report page around 6 PM IST on trading days. The participant-wise open interest file, which shows FII positions in index futures and options, follows later in the evening. NSDL publishes final FPI figures on its FPI Monitor the next working day.
This means there is no official “live” FII DII figure during market hours. Some websites claim to show intraday institutional flows, but those are estimates, not exchange data. Some competing guides even say provisional data comes out at 3:30 PM; in practice, the official file lands after the close, so plan your evening review around 6 PM.
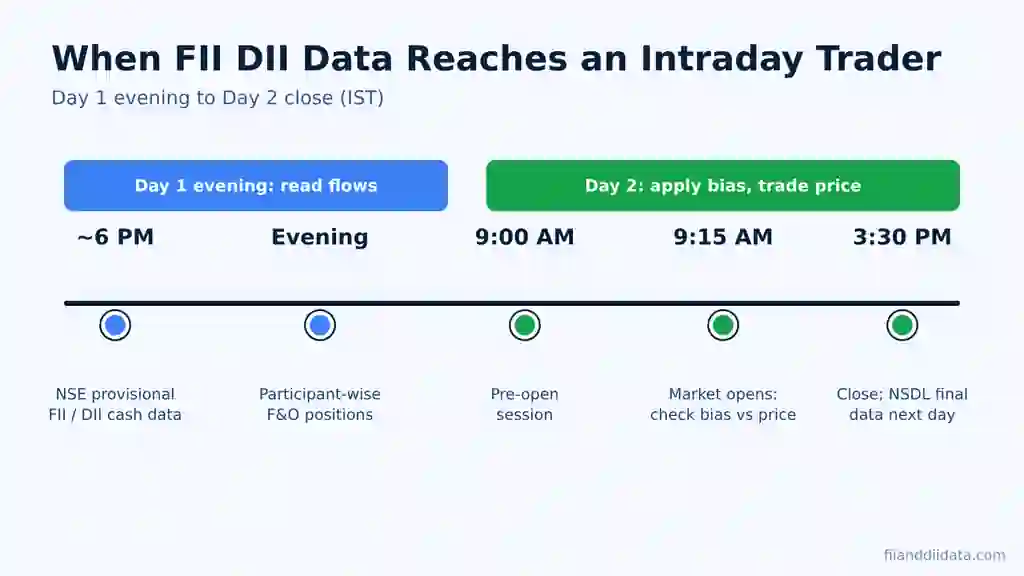
| Time (IST) | What happens | What an intraday trader does |
|---|---|---|
| Around 6 PM, Day 1 | NSE provisional FII/DII cash data | Note net flows and the streak |
| Evening, Day 1 | Participant-wise F&O open interest | Check FII index futures and options positions |
| 9:00 AM, Day 2 | Pre-open session starts | Compare indicated open with your bias |
| 9:15 AM, Day 2 | Normal trading begins | Wait for price to confirm before entering |
| Next working day | NSDL final FPI data | Use for weekly and monthly trend, not for intraday |
The pre-open window is covered in our explainer on the pre-open session in F&O. With timing clear, the next step is turning the numbers into a bias.
How to Turn FII DII Data for Intraday Into a Bias
A bias is a simple view on which side of the market has the edge today. It does not tell you when to buy or sell. It tells you which setups to favour and which to treat with caution.
Read FII DII data for intraday with four combinations
| FII net | DII net | Usual next-day bias | How to trade it |
|---|---|---|---|
| Buy | Buy | Bullish | Favour long setups on dips; avoid early shorts |
| Buy | Sell | Mildly bullish | Longs on strength; DIIs may sell into rallies |
| Sell | Buy | Neutral, range-bound | Trade the range; avoid chasing breakouts |
| Sell | Sell | Bearish | Favour short setups on pullbacks; avoid catching knives |
Size, streak and the futures check
Direction alone is weak. Add three filters. First, compare size: a ₹500 crore FII buy against ₹3,000 crore of DII selling is not bullish. Second, look at the streak: three or more sessions in the same direction carry more weight than one day. Third, check FII index futures. Cash buying while FIIs stay heavily short in futures can simply be a hedge. Our page on the FII long short ratio explains how to read that position quickly.
Some guides suggest fixed thresholds such as ₹1,500 crore or ₹2,000 crore for a “significant” day, but none we reviewed showed data behind those numbers. We prefer a relative test: is today’s net flow larger than the average of the last ten sessions? Here is how the method looked on real data.
Latest Example: FII DII Data, 29 October to 3 November 2026
| Date | FII net (₹ cr) | DII net (₹ cr) | Combined (₹ cr) | Pattern |
|---|---|---|---|---|
| 29 Oct 2026 | -944 | +1,924 | +980 | FII sell, DII buy |
| 30 Oct 2026 | +3,599 | -818 | +2,781 | FII buy, DII sell |
| 2 Nov 2026 | +3,115 | -392 | +2,723 | FII buy, DII sell |
| 3 Nov 2026 | +6,837 | -3,679 | +3,158 | FII buy, DII sell |
| 4-session total | +12,607 | -2,965 | +9,642 | FII buying streak |
After two straight days of FII buying on 30 October and 2 November, the bias going into 3 November was bullish. Nifty opened about 177 points higher at 9:30 AM that day, as per HDFC Sky, and closed up about 1.6%. On 3 November itself, FII gross buying of ₹20,971 crore was 1.48 times their gross selling of ₹14,134 crore, making it the third buying session in a row.
The futures data was less clear. FIIs still held a net short of about 2.03 lakh index futures contracts on 3 November, as per Quantsapp. So the cash streak was bullish, but FIIs had not turned fully long. That mixed picture is a reason to trade the bias with normal size rather than aggressive size. You can track the daily figures on our FII DII data today page and the futures side on the participant-wise open interest tracker.
Volatility also matters. India VIX was at 15.98 at 10:16 AM on 4 November 2026, up 1.65%, as per HDFC Sky. A rising VIX during an FII buying streak is a sign to keep stops honest. The routine below puts these checks in order.
A 5-Step Morning Routine Using FII DII Data for Intraday
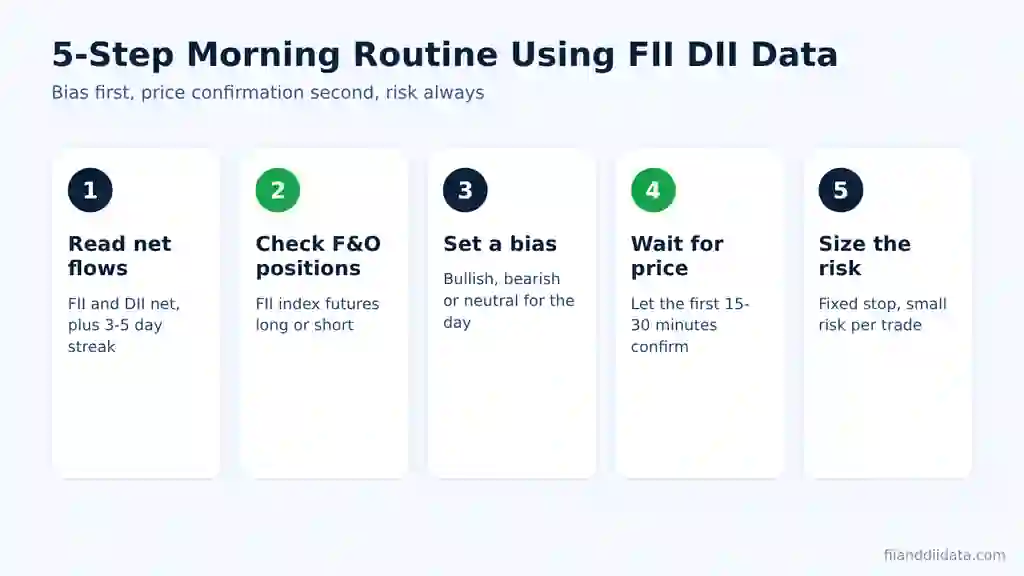
- Read net flows (evening). Note FII net, DII net, combined net and the three- to five-day streak.
- Check F&O positions (evening). Is the FII index futures position getting longer or shorter? Is the change in line with cash buying?
- Set a bias (before 9 AM). Write one word: bullish, bearish or neutral. Add the overnight cues you trust, such as GIFT Nifty and crude oil.
- Wait for price (9:15 to 9:45 AM). Let the first 15 to 30 minutes show whether buyers or sellers control the open. Trade only when price agrees with your bias, for example a hold above the opening range high on a bullish day.
- Size the risk (every trade). Fix the stop before entry and risk a small, fixed share of capital per trade.
If price fights your bias for the first half hour, step aside. Institutional data describes yesterday; price describes now. The next section shows step 5 with real numbers.
Worked Example: A Bias-Led Trade With Position Sizing
Assume a trader with ₹5,00,000 in capital who risks 0.5% per trade. The evening data shows a three-day FII buying streak, so the bias is bullish. At 9:40 AM, a large-cap stock holds above its opening range at ₹800. The trader places a stop at ₹792, just below the range.
| Item | Value | How it is worked out |
|---|---|---|
| Capital | ₹5,00,000 | Given |
| Risk per trade | ₹2,500 | 0.5% of ₹5,00,000 |
| Risk per share | ₹8 | ₹800 entry minus ₹792 stop |
| Quantity | 312 shares | ₹2,500 ÷ ₹8, rounded down |
| Position value | ₹2,49,600 | 312 × ₹800 |
| Loss if stop hits | ₹2,496 | 312 × ₹8, before costs |
The FII streak did not pick the stock or the entry. It only made the trader willing to look for long setups that morning. If the stock had broken below ₹792 instead, the loss would have been capped near ₹2,496. That discipline matters because, as per a SEBI study reported by Business Standard on 24 July 2024, over 70% of individual intraday traders in the equity cash segment made losses in FY23. Most of those losses come from the mistakes below.
Common Mistakes When Using FII DII Data for Intraday
- Treating the data as an entry signal. It is a bias filter. Entries need price confirmation.
- Trusting “live” intraday flow numbers. Official figures come after the close; intraday versions are estimates.
- Reading one day in isolation. A single large number can come from a block deal or index rebalancing.
- Ignoring DII flows. Heavy DII buying can absorb FII selling and keep the index flat.
- Skipping the futures check. Cash buying with a large futures short may be hedged, not bullish.
- Mixing NSE and NSDL numbers. NSDL includes primary market money and comes a day later.
- Raising size because the bias “feels strong”. Keep risk per trade fixed every day.
Quick checklist before the open: net flows and streak noted; FII futures direction checked; bias written; overnight cues reviewed; stop and quantity fixed for each planned trade. Once that is done, it helps to know how this data compares with other tools.
FII DII Data vs Other Intraday Tools
| Tool | When available | Best use | Main limit |
|---|---|---|---|
| FII/DII cash data | After close (around 6 PM) | Next-day bias and trend | Lagging; no timing |
| Participant-wise OI | Evening, after close | Positioning of FIIs, pros and clients | Lagging; includes hedges |
| GIFT Nifty | Before and during Indian hours | Expected opening gap | Gap can fade after the open |
| Option chain OI | During market hours | Intraday support and resistance zones | Changes fast; can mislead near expiry |
| Price and volume | Live | Entry, stop and exit | Noisy without context |
The best results come from stacking these: institutional data for the bias, GIFT Nifty for the open, option chain for levels and price for the trigger. You can see daily flows and positions together on our FII and DII data dashboard. Below are the questions traders ask most.
Frequently Asked Questions
Is FII DII data useful for intraday trading?
Yes, as a bias filter. FII DII data for intraday trading tells you which way institutions leaned in the previous session, which helps you favour long or short setups. It does not give entry points, so you still need price confirmation and a fixed stop loss.
What time is FII DII data released?
NSE releases provisional FII and DII cash market data around 6 PM IST on trading days. The participant-wise F&O open interest file comes later in the evening, and NSDL publishes final FPI data the next working day.
Is there live FII DII data during market hours?
No. Official FII and DII figures are published only after the market closes. Any intraday institutional flow numbers you see on apps or websites are estimates, not exchange data.
How much FII buying is considered big?
There is no official threshold. A practical test is to compare the day’s net flow with the average of the last ten sessions. On 3 November 2026, FIIs bought a net ₹6,837 crore, more than their previous two buying days combined.
Should I trade against FII flows?
It is usually safer to trade with the bias than against it, but price comes first. If the market moves against the institutional bias for the first 30 minutes, reduce size or stay out rather than force a trade.
The Bottom Line
FII and DII flows are one of the few free, official windows into what large institutions did yesterday. For intraday traders, their value lies in setting a clear bias before the open, not in timing entries. The early-November 2026 FII buying streak is a good example: it pointed the right way, but FIIs were still short in futures, so measured size made sense.
Your next step: run the five-step routine for two weeks, write your bias each morning and compare it with how the day played out. For more guides on reading institutional data, browse the FIIAndDIIData.com blog.
Sources: NSE FII/DII report; NSDL FPI Monitor; Quantsapp FII DII and participant data (accessed 4 Nov 2026); HDFC Sky, market open report (3 Nov 2026); HDFC Sky, India VIX report (4 Nov 2026); Business Standard, SEBI intraday study (24 Jul 2024). Data as of 4 November 2026.
Disclaimer: This article is for educational purposes only and is not investment advice. Please consult a SEBI-registered advisor before making investment decisions.