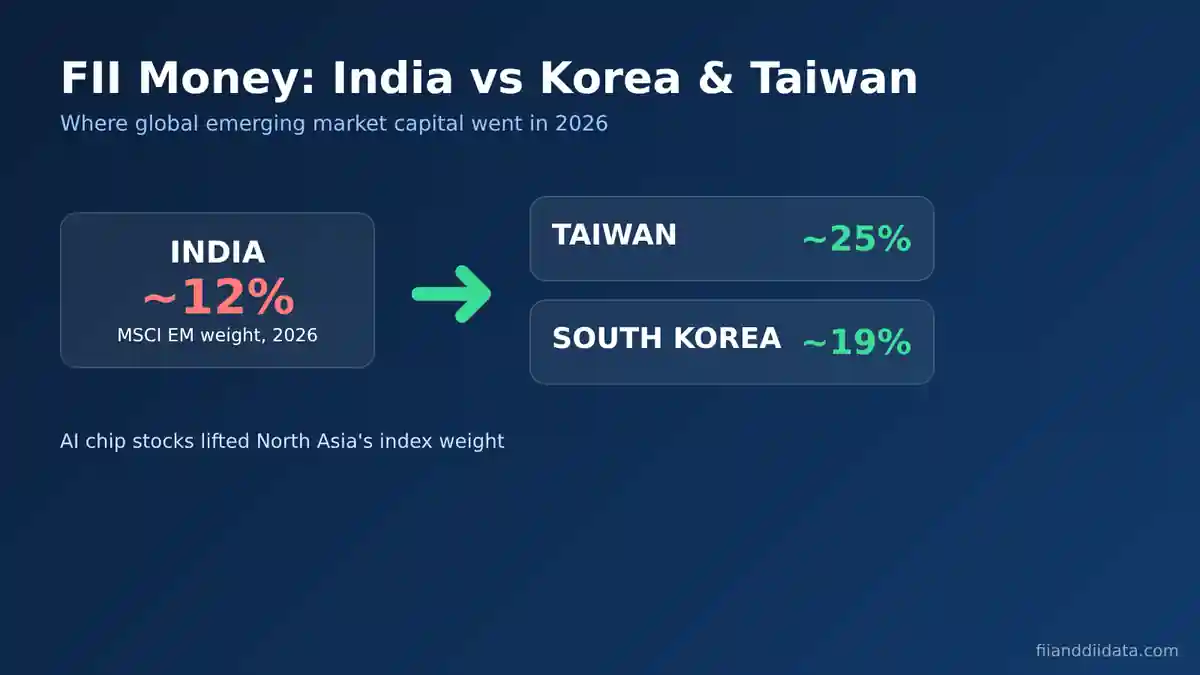
The idea of FII moving money to Korea Taiwan is mostly true for allocation and only partly true for actual cash flows. Global funds cut India and raised Korea and Taiwan because AI chip stocks lifted those markets, and India’s weight in the MSCI Emerging Markets index fell from 19.4% at the end of 2024 to about 12% by May 2026. Meanwhile foreign investors pulled a record ₹3.04 lakh crore from Indian equities in 2026 up to 11 October, per NSDL data.
Key Takeaways
- India’s MSCI EM weight fell from 19.4% (Q4 2024) to 11.94% on 30 April 2026, while Taiwan rose to 24.84% and Korea to 18.69%.
- Most of India’s weight loss came from relative prices, not index rules; active funds then sold on top of it.
- LSEG data shows foreigners were net sellers of Korea ($70.8 bn) and Taiwan ($29.6 bn) in the first half of 2026, as they trimmed big winners.
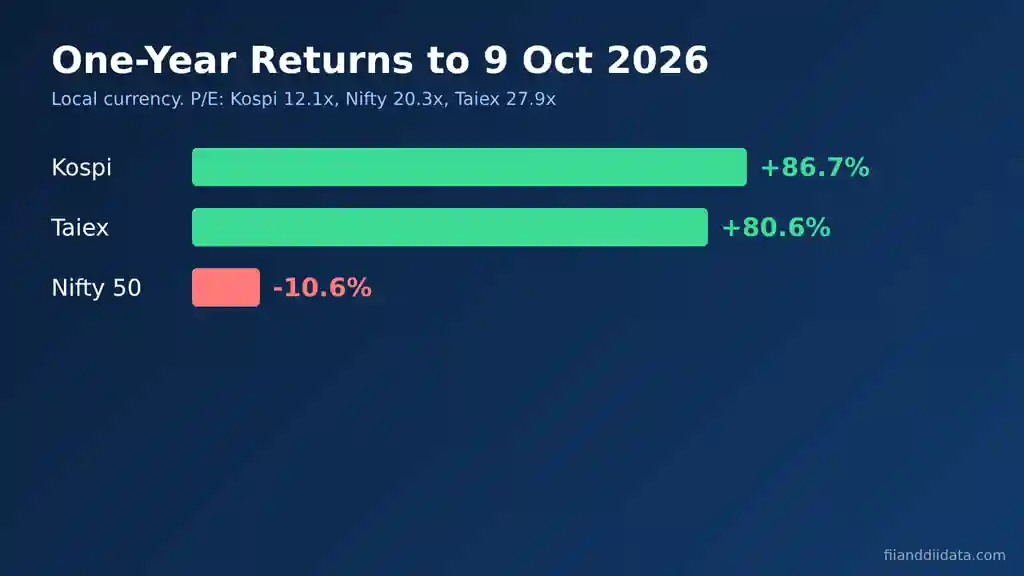
- In the year to 9 October 2026, Kospi rose 86.7% and Taiex 80.6%, while Nifty 50 fell 10.6%.
- Watch AI chip stocks, the rupee, US yields and India’s weekly FPI numbers for the first sign of a turn.
Table of contents
- What FII Moving Money to Korea Taiwan Really Means
- Why Foreign Money Chased Korea and Taiwan in 2026
- How MSCI EM Weights Turned the AI Rally Into an India Exit
- FII Moving Money to Korea Taiwan: What the 2026 Flow Data Shows
- Is the Rotation Reversing? Signals From October 2026
- India vs Korea vs Taiwan: Returns, Valuations and Risks
- How to Track the Korea-Taiwan Rotation: A 7-Point Checklist
- Common Mistakes When Reading This Rotation
- Frequently Asked Questions
- The Bottom Line
What FII Moving Money to Korea Taiwan Really Means
The phrase describes a shift in how global fund managers split their emerging market (EM) money. A typical EM fund starts with the MSCI Emerging Markets index as its benchmark. When one country becomes a bigger part of that index, the fund needs more of it just to stay neutral. When a country shrinks, the fund needs less.
In 2025 and 2026 that is exactly what happened. Taiwan and South Korea host the world’s key AI chip makers, such as TSMC, Samsung Electronics and SK Hynix. Their prices surged, their index weights rose, and India’s share fell. So the rotation is partly a mechanical result of prices and partly an active choice by fund managers who saw faster earnings growth in North Asia.
Keep two ideas apart. “Allocation” is the share of a portfolio held in a country. “Flow” is the net cash that crosses the border in a month. As we will show, the allocation moved sharply toward Korea and Taiwan, but the monthly flows tell a more mixed story. First, let us look at why these two markets attracted so much attention.
Why Foreign Money Chased Korea and Taiwan in 2026
Four forces pushed global money toward Korea and Taiwan and away from India over the past 18 months.
1. AI chip earnings
Memory and foundry makers became direct winners of AI data-centre spending. According to Business Standard, in the year to 9 October 2026 SK Hynix gained 352%, Samsung Electronics 215% (including dividends) and TSMC 74.6%. India has no listed company of that scale in the AI hardware chain, so global funds had no local way to own that theme.
2. Weak Indian earnings and high valuations
The same Business Standard analysis found that aggregate profits of large Indian firms rose only about 6% year on year, while India’s 10 most valuable companies fell close to 20% combined. Nifty 50 traded at 20.3 times earnings, still costlier than Kospi at 12.1 times, even after the fall.
3. Oil and the rupee
India imports most of its crude. With Brent above $104 in the week of 11 October 2026 and the rupee near 96.7 per dollar, a foreign investor lost money on the currency even when Indian stocks held steady. A weak rupee directly cuts dollar returns, which is one of the main reasons behind why FIIs are selling Indian stocks.
4. Higher US yields
Geojit’s VK Vijayakumar noted in October 2026 that US 10-year yields above 5.2% make Indian equities less attractive. When a risk-free US bond pays above 5%, a market with slow earnings and a falling currency must offer a large discount to keep foreign money. The next section shows how index weights turned these forces into selling.
How MSCI EM Weights Turned the AI Rally Into an India Exit
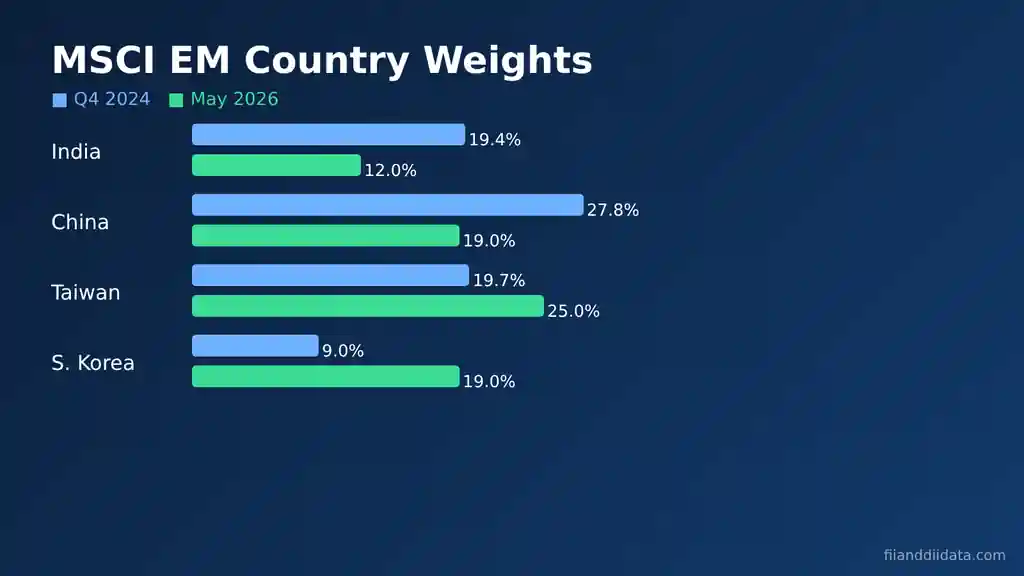
MSCI EM is the benchmark for trillions of dollars of active and passive money. The table below, compiled by Finnovate from MSCI data, shows how fast the country mix changed.
| Period | India | China | Taiwan | South Korea |
|---|---|---|---|---|
| Q4 2024 | 19.4% | 27.8% | 19.7% | 9.0% |
| Q2 2025 | 18.1% | 28.4% | 18.9% | 10.7% |
| Q4 2025 | 15.3% | 27.6% | 20.6% | 13.3% |
| Q1 2026 | 12.6% | 25.3% | 22.5% | 15.5% |
| 30 Apr 2026 | 11.94% | 23.05% | 24.84% | 18.69% |
On 30 April 2026, just three stocks, TSMC (14.21%), Samsung Electronics (6.03%) and SK Hynix (4.05%), made up 24.29% of the whole index. That is more than twice India’s entire weight. State Street Global Advisors, in a 15 June 2026 note, put Korea even higher at about 23% by May.
Worked example: how FII moving money to Korea Taiwan starts with price drift
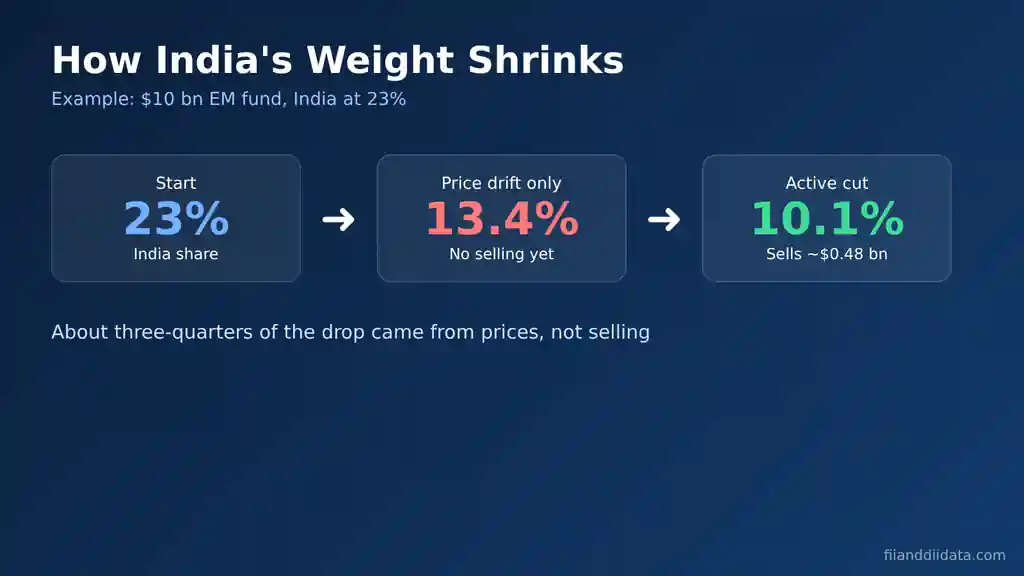
Take a $10 billion EM fund in September 2024. India is about 21% of the benchmark and the fund holds a little more, 23%, or $2.3 billion. Between September 2024 and mid-2026, MSCI India fell about 16% in dollar terms while MSCI EM rose about 46%, as reported by Moneycontrol.
- Step 1, price drift only: the India holding falls to $1.93 billion (2.3 × 0.84). The rest of the fund grows to about $12.51 billion. India’s share is now 13.4%, without a single share sold.
- Step 2, the benchmark moves too: the same price math takes India’s index weight from 21% to about 12.1%, almost exactly the real figure. So the index “cut” India mostly because India lagged.
- Step 3, the active decision: the manager now turns bearish and goes 2 points underweight, to 10.1%. That means selling about $0.48 billion of Indian stocks, roughly ₹4,600 crore at 96.7 rupees per dollar.
Of the fall from 23% to 10.1%, about three quarters came from prices and only one quarter from selling. Yet that one quarter, repeated across hundreds of funds, is what shows up as FII selling in the daily FII and DII data.
FII Moving Money to Korea Taiwan: What the 2026 Flow Data Shows
Here is the surprise most headlines miss. LSEG data reported by Reuters shows that foreigners were net sellers of Korea and Taiwan for much of 2026, not buyers. In the first half of 2026, seven Asian markets saw a record $137.36 billion of foreign outflows, led by South Korea at $70.8 billion and Taiwan at $29.6 billion. Analysts called it rebalancing and profit-taking after Kospi nearly doubled.
| Month (2026) | Taiwan | South Korea | India |
|---|---|---|---|
| June | -$8.0 bn | -$12.63 bn | -$5.91 bn |
| July | -$22.95 bn | -$6.26 bn | +$2.12 bn |
| August | +$11.15 bn | -$8.65 bn | +$3.10 bn |
So how can money be “moving to Korea” if foreigners sold Korea? The answer is relative weight. Korean and Taiwanese stocks rose so fast that their share of EM portfolios kept growing even as foreigners trimmed them. India, by contrast, saw both a falling price and heavy net selling. NSDL data shows FPIs sold ₹1,17,775 crore in March 2026 alone and ₹3.04 lakh crore in 2026 up to 11 October, already well above the ₹1.66 lakh crore sold in all of 2025. For the month-by-month detail, see our month-wise FPI outflow data for 2026.
For the India side of this story, our FII DII monthly data page shows month-wise FII and DII cash market totals for 2025 and 2026, and the FII DII data history guide covers the longer record.
That brings us to the next question: is the trade starting to turn?
Is the Rotation Reversing? Signals From October 2026
Several data points in the last three months suggest the AI trade is getting crowded.
- 15 October 2026: Kospi fell 7.57% to 5,554.22, its seventh straight loss, with foreigners selling 3.6 trillion won (about $2.68 billion). Taiwan saw a record single-day foreign sale of NT$302.5 billion (about $9.3 billion), according to IIFL. A hot US inflation print and doubts about AI earnings triggered the fall.
- July and August 2026: India drew net foreign buying of $2.12 billion and $3.1 billion, per LSEG, while Korea kept losing money.
- Fund flows: Elara Securities said in August 2026 that a large part of the AI trade had become crowded, and India-focused long-only funds had beaten EM funds by about 10% since mid-June.
- But October: FPIs still pulled ₹48,056 crore from Indian equities in October up to 25 October, per depository data reported by All India Radio, as crude and geopolitics weighed.
The honest reading is that money leaving Korea and Taiwan does not automatically come to India. Analysts quoted in early July warned that proceeds may be hedged, sent home or parked outside Asia. India needs its own trigger, such as better earnings, a stable rupee or cheaper oil. We cover those triggers in detail in our piece on whether FIIs will come back to India.
India vs Korea vs Taiwan: Returns, Valuations and Risks
The table compares the three markets on the latest data.
| Measure | India (Nifty 50) | South Korea (Kospi) | Taiwan (Taiex) |
|---|---|---|---|
| 1-year return to 9 Oct 2026 | -10.6% | +86.7% | +80.6% |
| Price to earnings | 20.3x | 12.1x | 27.9x |
| MSCI EM weight, 30 Apr 2026 | 11.94% | 18.69% | 24.84% |
| Main driver | Banks, IT, consumer | Memory chips | Foundry, AI servers |
| Key risk | Oil, rupee, slow earnings | AI capex slowdown | AI valuation, concentration |
Taiwan is now the most expensive of the three, and Korea the cheapest. India sits in between but with weaker earnings momentum. For a foreign manager, India becomes attractive again when its earnings growth beats its valuation premium. Index events also matter in the short term, such as the MSCI rebalancing in November 2026.
How to Track the Korea-Taiwan Rotation: A 7-Point Checklist
Use this weekly checklist to follow the rotation.
- Daily FII cash figure: check the NSE provisional number, released around 6 PM IST on trading days, on our FII DII data today page.
- Weekly NSDL FPI total: the final figure comes the next working day; compare the monthly running total with the prior month.
- Korea and Taiwan news: note big foreign selling days in Kospi and Taiex. Heavy selling there with buying in India is the pattern to watch.
- Chip stocks: track SK Hynix, Samsung and TSMC. A sharp fall often signals that AI money is leaving North Asia.
- Rupee and Brent: a stronger rupee and oil below $90 would improve dollar returns for foreigners.
- US 10-year yield: a move back below 5% would ease pressure on all emerging markets, including India. Read more on US bond yields.
- Quarterly MSCI weights: a rising India weight for two quarters in a row would confirm the rotation is reversing.
No single item is a signal on its own. The rotation turns when three or four of these move together for several weeks.
Common Mistakes When Reading This Rotation
- Treating weight loss as forced selling. When India’s index weight falls because its prices fell, passive funds do not need to sell. Their holdings shrink in value by themselves.
- Assuming Korea got the cash. LSEG data shows foreigners sold Korea for months. Money leaving India can be hedged, sent home or parked elsewhere, not just moved to Seoul.
- Mixing NSE and NSDL figures. NSE provisional data covers exchange trades only; NSDL includes primary market deals. Compare like with like.
- Reading one big day as a trend. FIIs bought ₹4,240 crore on 27 October 2026, yet the month was still a net outflow.
- Ignoring the currency. A flat Nifty with a weaker rupee is still a loss for a dollar investor.
Avoiding these errors makes the daily numbers far more useful. The questions below cover what readers ask most often.
Frequently Asked Questions
Is FII moving money to Korea Taiwan the main reason Nifty fell in 2026?
It is one of the main reasons, but not the only one. The AI chip rally pulled global allocation toward Korea and Taiwan, while high oil, a weak rupee near 96.7 per dollar, US yields above 5% and slow Indian earnings added to FPI selling.
What is India’s weight in the MSCI Emerging Markets index?
India’s weight was 11.94% on 30 April 2026, down from 19.4% at the end of 2024, based on MSCI data compiled by Finnovate. Taiwan was the largest country at 24.84%, followed by China and South Korea.
Did foreign investors buy Korean stocks in 2026?
On a net basis, mostly no. LSEG data shows foreigners sold $70.8 billion of South Korean shares in the first half of 2026 and kept selling through August, mainly to take profits after Kospi nearly doubled.
Will FII money come back to India from Korea and Taiwan?
It can, but it is not automatic. India saw net foreign buying in July and August 2026 as the AI trade cooled. A lasting return needs better Indian earnings, a steadier rupee and lower US yields.
Where can I check FII flows into India every day?
NSE publishes provisional FII and DII cash market figures around 6 PM IST on trading days, and NSDL publishes final FPI data the next working day. Our daily summary page tracks both in one place.
The Bottom Line
Global funds did shift their emerging market allocation toward Korea and Taiwan, driven by AI chip profits and a sharp rise in those markets’ index weights. For India, the result was a smaller benchmark weight, active underweights and a record ₹3.04 lakh crore of FPI selling in 2026 up to 11 October.
Still, FII moving money to Korea Taiwan was not a simple pipe of cash from Mumbai to Seoul. Foreigners sold Korea and Taiwan too, and recent volatility in AI stocks shows the trade is crowded. India’s turn depends on its own earnings, the rupee and oil.
As a next step, track the daily and weekly flow numbers with the checklist above, and browse more analysis on our blog.
Sources: Business Standard, 11 Oct 2026; Reuters via AsiaOne (LSEG data), 11 Sep 2026; Business Today (Elara Securities), 8 Aug 2026; IIFL, 16 Oct 2026; NSDL FPI data via Free Press Journal (11 Oct 2026) and All India Radio (25 Oct 2026); MSCI weights via Finnovate (1 Jun 2026); State Street Global Advisors (15 Jun 2026); Moneycontrol.
Disclaimer: This article is for educational purposes only and is not investment advice. Please consult a SEBI-registered advisor before making investment decisions.