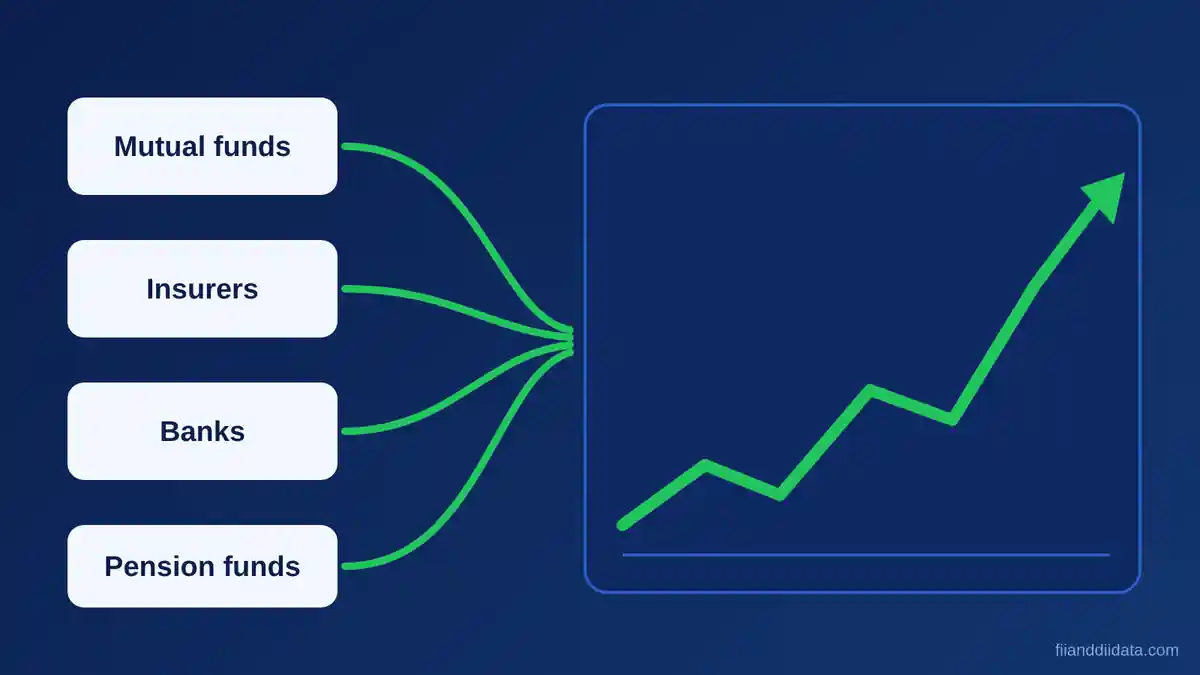
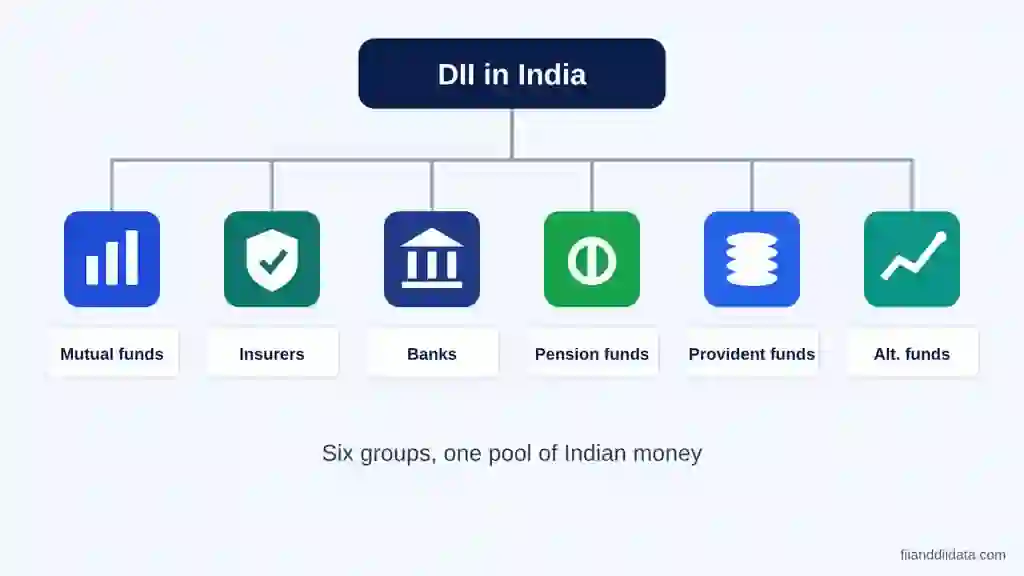
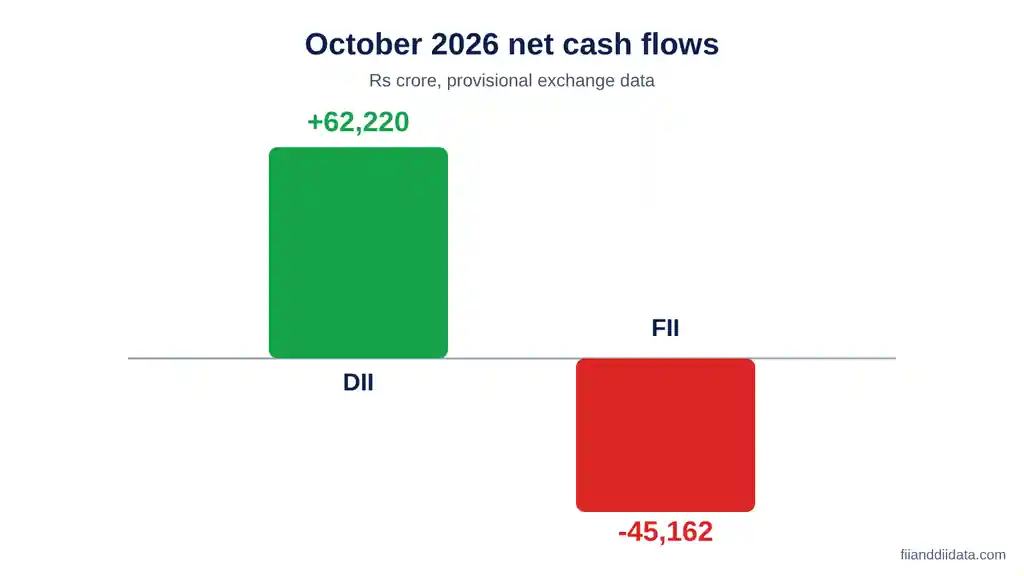
DII examples include mutual funds such as SBI Mutual Fund, insurers such as LIC and banks that invest in Indian shares. In October 2026, domestic institutions net bought Rs 62,220 crore of equities while foreign investors net sold Rs 45,162 crore, based on NSE provisional cash market data. This guide names the main types of domestic institutional investors, shows how to read their numbers and explains what their buying means for the Nifty.
Key Takeaways
- DIIs are Indian institutions such as mutual funds, insurance companies, banks and pension funds that invest large sums in the stock market.
- Mutual funds and insurers are the biggest DII examples, and SIP money keeps flowing into mutual funds every month.
- In October 2026, DIIs net bought Rs 62,220 crore while FIIs net sold Rs 45,162 crore (NSE provisional data).
- NSE shows DIIs as one combined line, so fund-wise detail comes from monthly portfolio disclosures.
- Read DII data together with FII flows, not alone, before drawing any view on the Nifty.
Contents
- What Are DIIs in the Indian Stock Market?
- Key DII Examples in India, Type by Type
- Why DIIs Matter for the Nifty and Sensex
- DII Buying vs FII Selling: October 2026 Data
- How to Read DII Numbers: A Worked Example
- How Traders Use DII Data: A Simple Checklist
- Common Mistakes When Reading DII Data
- DII vs FII: Quick Comparison
- Frequently Asked Questions
- The Bottom Line
What Are DIIs in the Indian Stock Market?
DII stands for Domestic Institutional Investor. These are Indian financial institutions that collect money from many savers and invest it in shares, bonds and other assets. Because they manage very large pools of money, their daily buying and selling can move the market.
The opposite group is the foreign institutional investor, or FII, which invests from outside India. For the foreign side of the picture, see our guide with FII examples and the full difference between FII and DII.
NSE publishes provisional FII and DII cash market figures around 6 PM IST on trading days. The final foreign portfolio investor data from NSDL follows on the next working day. You can track both on our FII and DII data page, and the latest daily numbers sit on the FII DII data today page.
Key DII Examples in India, Type by Type
Here are the main DII examples in India and what each one does with investor money.
Mutual funds as DII examples
Mutual funds are the largest and most visible DIIs today. Asset management companies such as SBI Mutual Fund, HDFC Mutual Fund, ICICI Prudential, Nippon India and Kotak invest the money that retail investors put in through SIPs and lump sums. When SIP inflows are strong, these funds have fresh cash to deploy every month, which is why DII buying often stays steady even when foreign investors sell. You can check monthly flow figures on the AMFI website.
Insurance companies
Life and general insurers invest the premiums they collect. LIC is the best known example and has long been among the largest institutional holders of Indian equities. Private insurers such as SBI Life and HDFC Life also hold shares, though in smaller amounts. Insurers tend to buy for the long term, so they rarely trade daily. Read more in our note on LIC buying stocks in 2026.
Banks and financial institutions
Banks and development financial institutions invest part of their treasury in shares and mutual fund units within regulatory limits. Their equity exposure is small compared with mutual funds and insurers, but they are still counted in the DII line.
Pension and provident funds
Retirement funds, including the fund managers handling NPS money, invest a limited share of their corpus in equities, often through index funds or ETFs. Their allocation changes slowly, so they add steady background demand rather than sharp daily moves.
Why DIIs Matter for the Nifty and Sensex
DIIs matter because they act as a cushion. When FIIs sell heavily, domestic institutions with SIP money and premium income can absorb part of that supply. Strong domestic flows have been a key support during recent spells of foreign selling. Our guide to the role of domestic institutions in the Indian stock market explains this in more detail.
They also matter for price discovery. Large mutual funds research companies in depth and hold stocks for years. When several funds raise their stake in the same company, it often signals confidence in its earnings. We track such cases in our list of stocks where DIIs raised their stake.
Finally, DII data helps you judge the quality of a rally or a fall. A market that rises on both FII and DII buying has broad support. A market that falls while DIIs buy heavily may be seeing foreign selling that domestic money is absorbing.
DII Buying vs FII Selling: October 2026 Data
October 2026 gave a clear picture of how DII examples behave when foreign investors step back. Based on the sum of NSE provisional daily cash market figures for the month, DIIs were net buyers by a wide margin while FIIs were net sellers.
| Investor group | Net cash market flow, October 2026 |
|---|---|
| FIIs (foreign institutions) | Net sold Rs 45,162 crore |
| DIIs (domestic institutions) | Net bought Rs 62,220 crore |
| DII buying minus FII selling | Rs 17,058 crore more bought than sold |
DIIs absorbed all of the foreign selling and still had Rs 17,058 crore left to buy. For the full month-by-month view, open our October 2026 FII DII data report and the monthly FII DII data tracker, and read the wider debate in FII selling versus DII buying in 2026.
How to Read DII Numbers: A Worked Example
NSE reports three numbers for each group: gross buy value, gross sell value, and the net of the two. The net value is what most readers watch. Here is a simple, illustrative example. The figures are made up to show the method and are not market data.
- FIIs bought Rs 12,000 crore and sold Rs 15,000 crore. Net value is minus Rs 3,000 crore, so FIIs were net sellers.
- DIIs bought Rs 14,000 crore and sold Rs 11,600 crore. Net value is plus Rs 2,400 crore, so DIIs were net buyers.
- Combined institutional flow is minus Rs 600 crore. DIIs offset most of the foreign selling, but not all of it.
In this example the market would likely see only a mild fall, because domestic buying absorbed 80 percent of the foreign selling (2,400 divided by 3,000). If DIIs had bought only Rs 500 crore, the same foreign selling would have hurt much more. Always compare the size of the two flows, not just their direction.
How Traders Use DII Data: A Simple Checklist
Use this checklist after the market closes. It takes about five minutes.
- Open the FII DII data today page after 6 PM IST and note the net values for FIIs and DIIs.
- Check whether the two groups moved in opposite directions. Opposite moves usually mean one side is absorbing the other.
- Compare DII net buying with FII net selling. If DIIs cover most of it, the downside pressure is limited.
- Look at the Nifty close. A flat or rising Nifty on FII selling shows domestic strength.
- Review the last five trading days to see if the pattern is a trend or a one-day event.
- Cross-check with monthly figures and the participant-wise open interest page before acting on any view.
Treat the result as one input. DII flows do not tell you which stocks will rise or when a trend will turn.
Common Mistakes When Reading DII Data
- Treating provisional data as final. NSE provisional figures can be revised. Wait for the next working day if you need final foreign data from NSDL FPI Monitor.
- Assuming DII buying always means a rally. Domestic money can support a falling market without reversing it.
- Ignoring the size of the flow. A Rs 200 crore DII buy against Rs 5,000 crore of FII selling is not a cushion.
- Expecting fund-wise detail in the daily report. NSE shows one DII line. Fund-level holdings appear in monthly portfolio disclosures that asset managers file under SEBI rules.
- Reading one day in isolation. Weekly and monthly totals give a clearer picture than a single session.
Avoiding these errors will make your reading of institutional flows far more reliable. Next, a quick side-by-side of the two investor groups.
DII vs FII: Quick Comparison
- Who they are: DIIs are Indian mutual funds, insurers, banks and pension funds. FIIs are overseas funds, sovereign wealth funds and similar investors.
- Source of money: DIIs use domestic savings, premiums and SIPs. FIIs use global capital that moves with the dollar, US yields and risk appetite.
- Behaviour: DII flows are steadier because SIP money arrives every month. FII flows can swing quickly with global events.
- Where to track: Both appear in the NSE daily report from NSE India, and in our FII and DII data dashboard.
Frequently Asked Questions
What are examples of DII in India?
Common DII examples in India are mutual funds such as SBI Mutual Fund and HDFC Mutual Fund, insurers such as LIC and SBI Life, banks, and pension fund managers that invest in equities.
Is LIC a DII?
Yes. LIC is an insurance company based in India, so it is counted as a domestic institutional investor. Its equity purchases and sales are included in the daily DII figures.
Are mutual funds DIIs?
Yes. Mutual funds are the largest group of DIIs. The money comes from Indian investors through SIPs and lump sum investments, and fund managers invest it in listed shares.
Do DIIs buy more than FIIs sell?
It depends on the period. In October 2026, DIIs net bought Rs 62,220 crore while FIIs net sold Rs 45,162 crore, according to NSE provisional data. Other months can look different.
Where can I see daily DII data?
NSE publishes provisional FII and DII cash market data around 6 PM IST on trading days. You can also see it on the FII DII data today page of FIIAndDIIData.com.
The Bottom Line
The main DII examples are mutual funds, insurance companies, banks and pension funds. Together they hold the savings of millions of Indian households, and in October 2026 they absorbed every rupee of foreign selling and then some.
That does not make DII buying a guarantee. Domestic flows cushion the market but cannot override a strong global sell-off, and a single day of data says little. The more useful habit is to compare the two flows every evening and watch the weekly trend.
Your next step: open the FII DII data today page tomorrow after 6 PM IST and run the five-minute checklist above on the new numbers.
Sources: NSE India (provisional FII/DII cash market data, October 2026), NSDL FPI Monitor, AMFI and SEBI. Disclaimer: This article is for educational purposes only and is not investment advice. Please consult a SEBI-registered advisor before making investment decisions.