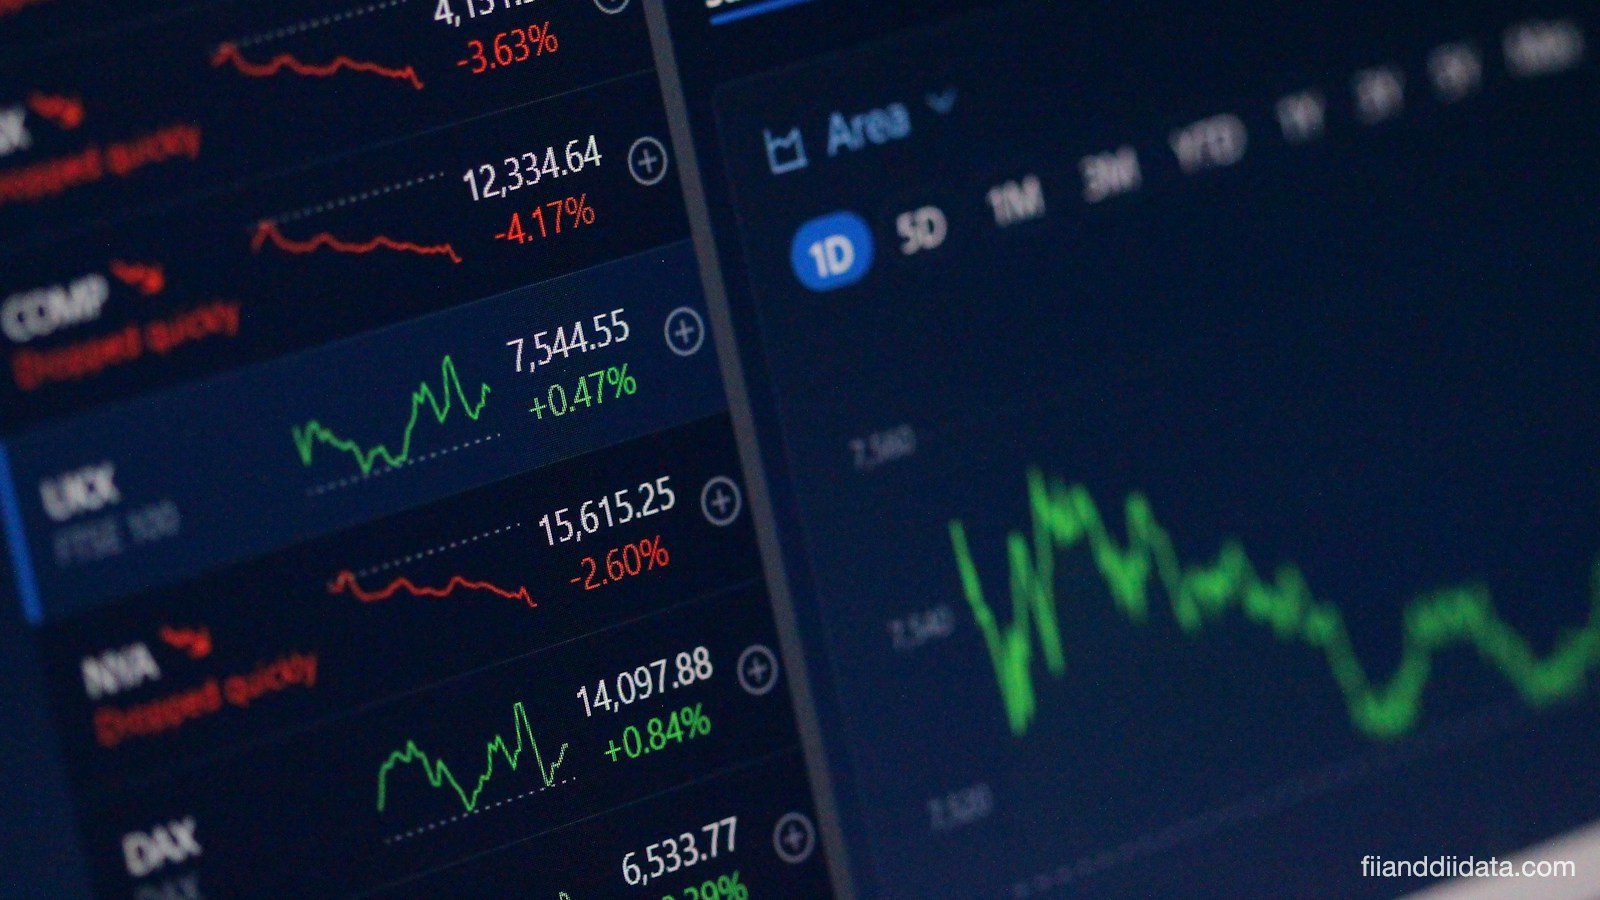
FPI inflows into Indian shares hit ₹38,971 crore in the week ended 6 November 2026, according to NSDL data. That is the biggest weekly buying by foreign portfolio investors after weeks of selling, and it came as a global sell-off in AI stocks pushed money toward India, a market seen as a non-AI trade. Here is what drove the turn, why two official numbers disagree, and what to watch from today.
Key Takeaways
- NSDL shows ₹38,971 crore of net FPI equity buying for 2 to 6 November 2026.
- Exchange data shows a larger ₹45,960 crore for the same week, while DIIs sold ₹24,197 crore.
- FPIs still sold a net ₹2.56 lakh crore in 2026, so one week does not reverse the year.
- Brent fell 13% in a week and the rupee firmed to about 93.90 per dollar.
- US CPI, Fed rate-hike odds and oil are the key tests this week.
In this article:
- What happened
- Why FPI inflows turned
- NSE vs NSDL
- The data table
- What it means for Nifty
- Checklist for this week
- Common mistakes
- FAQ
- The Bottom Line
What Happened to FPI Inflows Last Week
Foreign investors spent most of 2026 as sellers. Business Standard, citing NSDL, reported they sold a net ₹34,843 crore in October 2026 and a net ₹2.56 lakh crore in the year to date. In the first week of November, that pattern flipped.
V K Vijayakumar, Chief Investment Strategist at Geojit Investments, called it “a sudden and complete role reversal from institutions,” with FPIs buying and domestic institutional investors (DIIs) selling on all days of the week, ANI reported on 8 November 2026. He said FIIs bought index heavyweights in financials, IT, automobiles and telecom.
The rally was sharp. Kotak Neo reported that the Nifty 50 gained about 8.6% for the week and closed above 25,000. In the special Muhurat trading session on Sunday, 8 November, the Nifty slipped 43.95 points to 24,986.40, a small pause after a big run. You can track each day on our FII DII data today page. So what changed for global funds?
Why FPI Inflows Turned Positive
Three forces came together in the same week.
1. The AI sell-off made India look different
US technology stocks fell hard on worries about data centre spending. Vijayakumar said, “The AI sell-off has made India, which is widely regarded as a non-AI trade, attractive for FPIs.” Funds heavy in AI-linked markets had a reason to rebalance.

2. Oil fell 13%, which helped FPI inflows
Business Standard reported that Brent crude dropped 13% in one week, its steepest weekly fall since the start of Covid, though it remained near $100 a barrel. Dheeraj Gaur of Choice Wealth said, “Cheaper oil is the single biggest relief for India’s inflation, current account and the Rupee.” The rupee strengthened to about ₹93.90 per dollar from around ₹95.4 a week earlier.
A firmer rupee matters directly to a foreign fund. Take a simple example. A fund holding Indian shares worth ₹1,000 crore was worth about $104.8 million at ₹95.4 per dollar. At ₹93.90, the same holding is worth about $106.5 million. That is a gain of roughly $1.7 million, or 1.6%, without any change in share prices.
3. Cheaper valuations after a weak year
Gaur said Indian shares looked cheap after a weak 2026 while earnings held up, and Vijayakumar pointed to attractive large-cap valuations. But which FPI number should you trust?
NSE vs NSDL: Why FPI Inflows Show Two Numbers
Readers saw two figures for the same week. Exchange data, reported by Kotak Neo, showed FIIs bought a net ₹45,960 crore in the cash market from 2 to 6 November. NSDL showed ₹38,971 crore. The gap is ₹6,989 crore.
Both numbers are correct; they measure different things. NSE provisional data, released around 6 PM IST, counts FII trades on the exchange that day. NSDL data, published the next working day, records FPI flows by settlement and reporting date and also covers primary market deals such as IPOs. For daily signals we use exchange data; for monthly and yearly trends, NSDL is the reference. Our FII DII monthly data page tracks both views over time.
FPI Inflows Data Table: Week to 6 November 2026
| Indicator | Value | Period |
|---|---|---|
| FPI net equity buying (NSDL) | ₹38,971 cr | Week to 6 Nov 2026 |
| FII net buying (exchange data) | ₹45,960 cr | 2 to 6 Nov 2026 |
| DII net selling (exchange data) | ₹24,197 cr | 2 to 6 Nov 2026 |
| FII net buying, single day | ₹14,975 cr | 5 Nov 2026 |
| FPI net selling, October (NSDL) | ₹34,843 cr | October 2026 |
| FPI net selling, year to date (NSDL) | ₹2.56 lakh cr | 2026 to 6 Nov |
| Brent crude, weekly change | -13% | Week to 6 Nov 2026 |
| Rupee per US dollar | about 93.90 | Week to 6 Nov 2026 |
| Nifty 50 close, Muhurat session | 24,986.40 | 8 Nov 2026 |
The table shows the size of the turn, but also its limits. One week of buying covers only about 15% of the ₹2.56 lakh crore sold this year.
What It Means for Nifty and Your Portfolio
When foreign funds buy index heavyweights, the Nifty tends to outpace the broader market. DIIs, which include mutual funds and insurers, used the rally to book profits, yet their ₹24,197 crore of selling did not stop the index.
The risk is that the drivers can reverse. Gaur warned that a setback in US-Iran talks could undo the oil decline. Business Standard also noted that odds of a December US Fed rate hike rose back to roughly 70% to 80% after strong US payrolls data. Derivatives traders can cross-check cash flows with FII F&O positions and the participant-wise open interest data. So how do you judge whether the buying lasts?
Checklist: How to Track the Rally This Week
- Daily FII net figure: is buying positive for three or more sessions?
- DII response: heavy DII selling caps upside.
- Brent crude: a rebound would weaken the oil story.
- Rupee: stability near 94 per dollar helps foreign returns.
- US CPI and Fed signals: hotter inflation raises December hike odds.
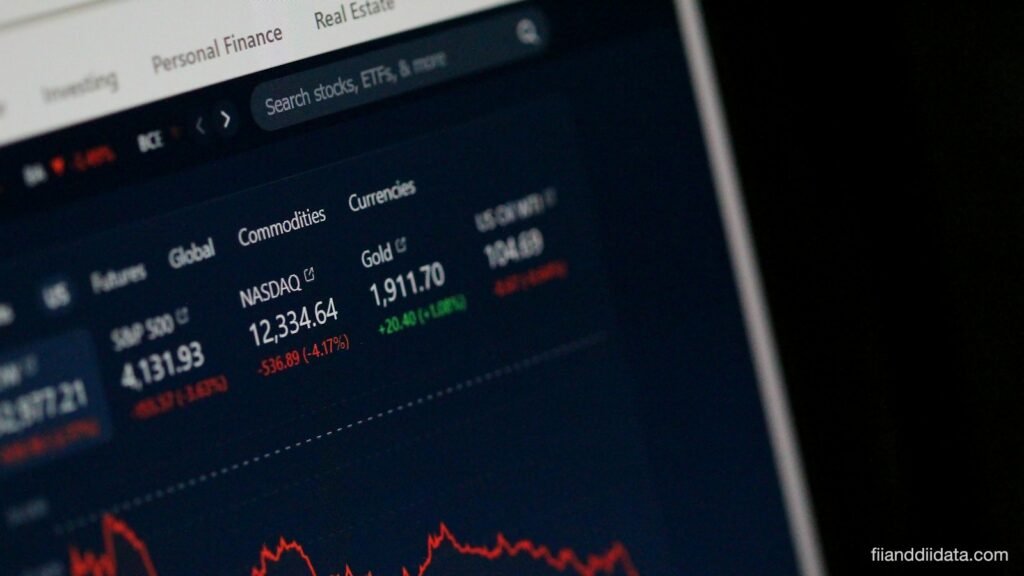
Options traders can also see where foreign desks are placing bets on our FII options activity tracker. Before acting on any of it, avoid the errors below.
Common Mistakes to Avoid
- Treating one strong week as a trend change. The 2026 net outflow is still large.
- Mixing NSE and NSDL numbers in the same comparison.
- Ignoring DII selling. Flows are a two-sided market.
- Chasing stocks after an 8% index move without a stop-loss or plan.
- Forgetting that oil and the Fed can flip the story within days.
For a day-by-day view of last week, see our weekly FII DII report for 6 November.
Frequently Asked Questions
What are FPI inflows?
FPI inflows are net purchases of Indian shares or bonds by foreign portfolio investors such as overseas funds. A positive number means they bought more than they sold.
How much did FPIs invest in the first week of November 2026?
NSDL data shows FPIs bought a net ₹38,971 crore of Indian equities in the week ended 6 November 2026. Exchange data shows a higher ₹45,960 crore for the same period.
Why are FPI inflows rising after the AI sell-off?
Global funds cut AI-linked stocks on data centre spending worries. India has little AI exposure, and cheaper oil, a firmer rupee and lower valuations added appeal.
Why do NSE and NSDL FPI figures differ?
NSE provisional data counts exchange trades on the trade day. NSDL records flows by settlement and reporting date and includes primary market deals, so the two can differ for the same week.
Will FPI buying continue?
No one can say for sure. A rebound in oil or a hawkish Fed could slow foreign buying, so watch daily flows, oil, the rupee and US data.
The Bottom Line
The first week of November 2026 brought the strongest foreign buying in a long time, driven by a global rotation out of AI stocks, a 13% fall in oil and a firmer rupee. It lifted the Nifty back above 25,000 before a small dip in the Muhurat session.
Still, the year-to-date outflow of ₹2.56 lakh crore shows how much ground is left to recover, and the triggers behind the buying can reverse quickly. A practical next step: check the daily flow numbers each evening this week on our FII and DII data dashboard before changing your positions. You can find more analysis on our blog.
Sources: Business Standard, ANI, NSDL FPI Monitor, Kotak Neo, Goodreturns.
Disclaimer: This article is for educational purposes only and is not investment advice. Please consult a SEBI-registered advisor before making investment decisions.