FII DII data October 2026 shows foreign investors sold a net ₹45,160 crore in the cash market while domestic institutions bought ₹62,218 crore. The Nifty 50 still closed the month 1.91% higher at 23,053.10, because DIIs covered every rupee of foreign selling and FIIs turned buyers in the second half. Here is the full report card, built from 20 sessions of NSE provisional data.
Key Takeaways
- FIIs were net sellers of ₹45,160 crore in October 2026, their tenth straight month of net selling.
- DIIs bought ₹62,218 crore, which is 138% of the FII sale. Combined institutional flow was +₹17,058 crore.
- All the selling came early: ₹49,933 crore in the first ten sessions (1 to 15 October), then net FII buying of ₹4,773 crore from 16 to 30 October.
- The Nifty 50 rose 1.91% in October after a 6.06% fall in September, but is still down 11.77% for 2026.
- From 1 January to 31 October 2026, FIIs sold ₹4,48,227 crore and DIIs bought ₹7,01,752 crore.
- FII DII Data October 2026: The Report Card
- How October Unfolded: Two Very Different Halves
- October vs September and the 2026 Year to Date
- What Drove FII DII Data in October 2026
- Sector Flows: Where Foreign Money Left
- How to Read a Month Like October
- What to Watch in November 2026
- FAQs
- The Bottom Line
FII DII Data October 2026: The Report Card
The table below sums all 20 trading sessions of October 2026. Markets were shut on 2 October (Gandhi Jayanti) and 20 October (Dussehra). Our total from daily NSE provisional figures matches the monthly aggregate on NiftyTrader within ₹2 crore (NiftyTrader shows −₹45,162 crore and +₹62,220 crore).
| Report card item | October 2026 |
|---|---|
| FII net (cash market) | −₹45,160 crore |
| DII net (cash market) | +₹62,218 crore |
| Combined FII + DII | +₹17,058 crore |
| Nifty 50 return | +1.91% (22,620.45 to 23,053.10) |
| DII absorption (DII buying ÷ FII selling) | 138% |
| FII selling days | 14 of 20 sessions |
| Biggest FII sell day | 8 October: −₹12,944 crore |
| Biggest DII buy day | 8 October: +₹10,703 crore |
| Biggest FII buy day | 27 October: +₹4,240 crore |
The grade is mixed. Foreign selling stayed heavy, the fifth-largest monthly FII sale of 2026. But domestic buying was larger, and the market finished higher. The next section shows that the month was really two different stories.
How October Unfolded: Two Very Different Halves
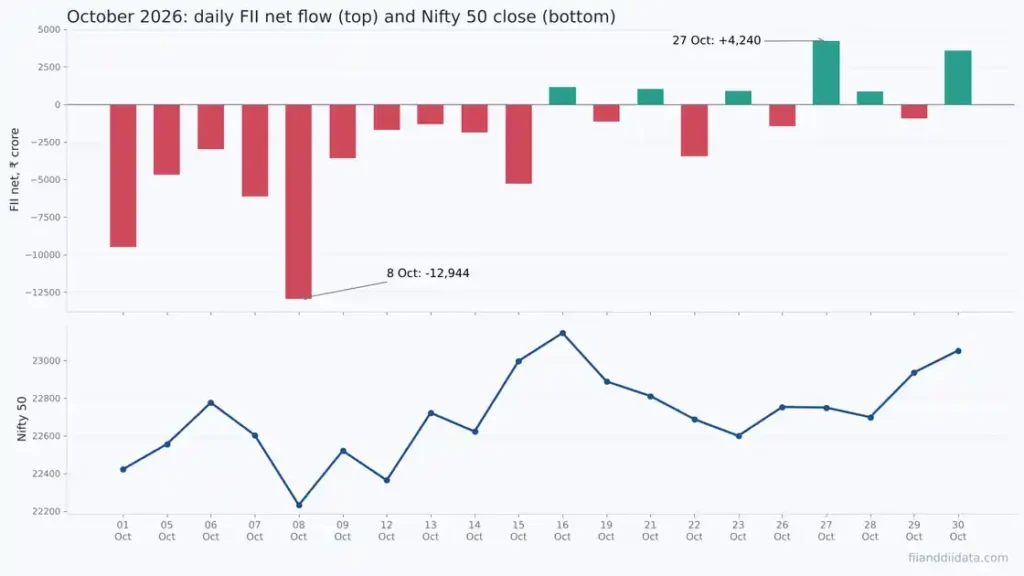
FII DII data October 2026: first half vs second half
| Period | Sessions | FII net (₹ Cr) | DII net (₹ Cr) |
|---|---|---|---|
| 1 to 15 October | 10 | −49,933 | +51,829 |
| 16 to 30 October | 10 | +4,773 | +10,389 |
| October 2026 | 20 | −45,160 | +62,218 |
FIIs sold on all ten sessions from 1 to 15 October. The worst day was 8 October, when FIIs sold ₹12,944 crore and the Nifty fell 1.64% to 22,231.80, its lowest close of the month. DIIs bought ₹10,703 crore that same day, and the index recovered 1.30% the next session.
From 16 October the pattern changed. FIIs bought on six of the last ten sessions, including ₹4,240 crore on 27 October and ₹3,599 crore on 30 October. With both groups buying, the Nifty climbed back above 23,000. For the daily numbers behind this table, see our FII DII data today page.
October vs September and the 2026 Year to Date
| Measure | September 2026 | October 2026 | 2026 YTD (to 31 Oct) |
|---|---|---|---|
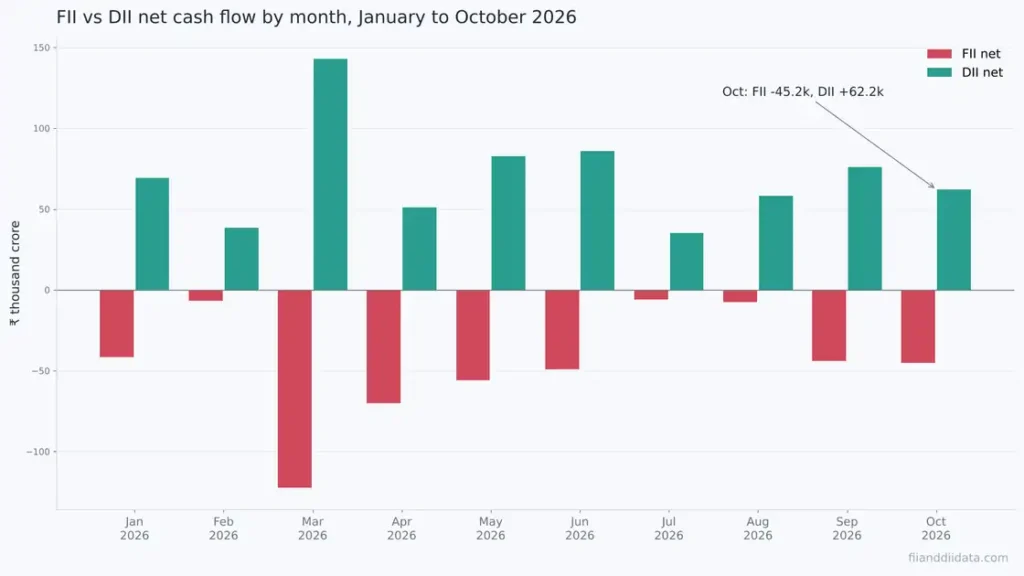
| FII net (₹ Cr) | −44,013 | −45,160 | −4,48,227 |
| DII net (₹ Cr) | +76,030 | +62,218 | +7,01,752 |
| Combined (₹ Cr) | +32,017 | +17,058 | +2,53,525 |
| DII absorption | 173% | 138% | 157% |
| FII selling days | 16 of 21 | 14 of 20 | 10 of 10 months net selling |
| Nifty 50 return | −6.06% | +1.91% | −11.77% |
FII selling in October was almost the same size as September, ₹45,160 crore against ₹44,013 crore. What changed was the timing and the Nifty response. In September the selling built up into the month end and the index fell 6.06%. In October it was front-loaded and faded, and the index gained.
DII buying dropped by about ₹13,800 crore from September. The combined flow of +₹17,058 crore was the weakest positive month of 2026; only April, at −₹19,071 crore, was lower. You can compare every month on our month-wise FII DII data page and the extremes on the FII DII records board.
What Drove FII DII Data in October 2026
Early-month selling. An Angel One report published on 13 October 2026 tied the outflows to US 10-year Treasury yields above 5.2%, Brent crude testing $100 a barrel during the West Asia conflict, a weaker rupee, global money moving into AI-linked stocks, and Indian valuations that remain high relative to earnings growth. Depository data in that report showed ₹47,417 crore of FPI selling between 1 and 12 October alone.
The Fed pause. On 28 October 2026 the US Federal Reserve held its policy rate at 3.75% to 4% in a 10 to 2 vote, after a 0.25 point hike in September. A hold removed one source of pressure on emerging market flows for the moment.
Late-month buying. According to a Free Press Journal report of 1 November 2026, FPIs bought about ₹6,300 crore between 26 and 30 October. Geojit’s VK Vijayakumar linked the reversal to the Fed hold, attractive large-cap valuations and India’s growth. Bajaj Broking’s Pabitro Mukherjee cautioned that crude prices and geopolitical risks could limit the momentum.
Why the official FPI number is smaller. The same report put full-month FPI equity selling at ₹34,843 crore based on depository data. That figure includes primary market investments such as IPOs and settles a day later, so it is usually lower than the exchange cash-market figure of ₹45,160 crore. Both are correct; they measure different things.
Sector Flows: Where Foreign Money Left
NSDL publishes sector-wise FPI flows every fortnight. The report for 1 to 15 October 2026, as compiled by Tapetide, showed the largest outflows from financial services (−₹10,628 crore), FMCG (−₹8,172 crore), automobiles (−₹6,533 crore), healthcare (−₹5,497 crore) and telecom (−₹3,930 crore). Information technology received ₹2,599 crore. The second-half report is due in early November, and these sector numbers include debt and hybrid flows, so they do not add up to the cash-market total.
How to Read a Month Like October
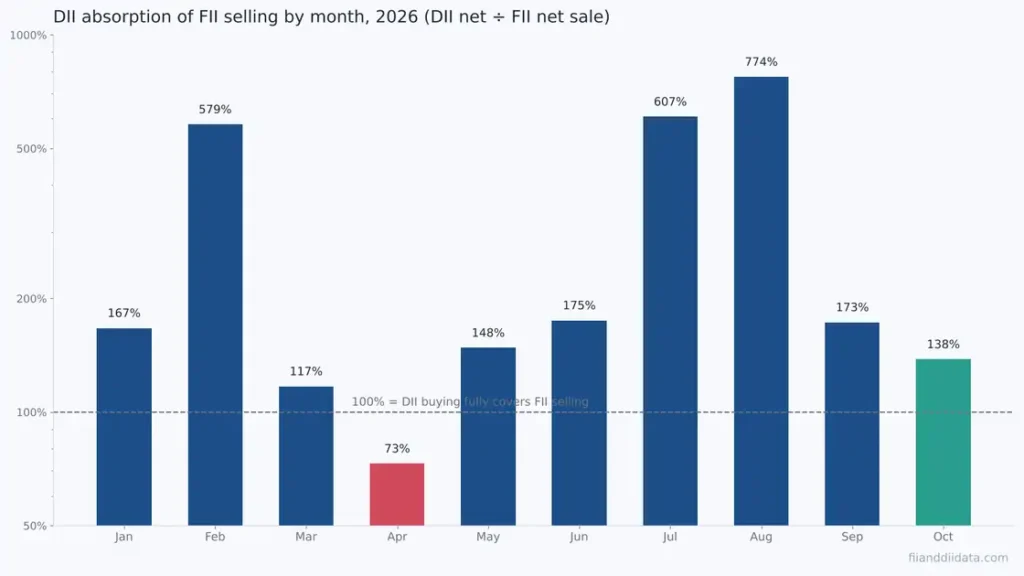
Worked example: DII absorption = DII net buying ÷ FII net selling × 100. For October, ₹62,218 ÷ ₹45,160 × 100 = 137.8%. Anything above 100% means domestic money more than covered foreign selling. April 2026 was the only month this year below 100%, at 73%, and the only month with a negative combined flow. Our study of FII selling vs Nifty returns shows why the combined number matters more than FII selling alone.
- Check whether DII absorption stayed above 100%.
- Split the month into halves: is the selling building up or fading?
- Count FII selling days, not just the total.
- Compare exchange data with the depository FPI figure.
- Confirm the trend on the FII flow vs Nifty chart before acting.
What to Watch in November 2026
| Date | Event |
|---|---|
| 3 Nov (Tue) | Nifty weekly expiry |
| 8 Nov (Sun) | Diwali Muhurat trading, 2:20 PM to 3:30 PM (NSE circular of 19 October 2026) |
| 9 Nov (Mon) | Nifty weekly expiry (moved from 10 Nov) |
| 10 Nov (Tue) | Market holiday: Diwali Balipratipada |
| 11 Nov (Wed) | MSCI November 2026 Index Review announcement |
| 23 Nov (Mon) | Nifty monthly expiry (moved from 24 Nov) |
| 24 Nov (Tue) | Market holiday: Guru Nanak Jayanti |
| 30 Nov (Mon) | Last session before MSCI changes take effect on 1 December |
| 2 to 4 Dec | RBI Monetary Policy Committee, decision on 4 December |
The MSCI rebalance close on 30 November is the date most likely to produce a very large one-day FII figure. The full list, including the December Fed meeting, is on our FII DII calendar.
FAQs
What does FII DII data October 2026 show?
FIIs were net sellers of ₹45,160 crore and DIIs were net buyers of ₹62,218 crore in the cash market across 20 sessions, based on NSE provisional data. Combined flow was +₹17,058 crore and the Nifty 50 rose 1.91%.
Why did FIIs sell Indian stocks in October 2026?
Reports cited US 10-year yields above 5.2%, Brent crude near $100 a barrel, a weaker rupee, global money moving into AI stocks and high Indian valuations. Most of the selling happened between 1 and 15 October.
Did FIIs buy at the end of October 2026?
Yes. FIIs were net buyers of ₹4,773 crore from 16 to 30 October in NSE data, including ₹4,240 crore on 27 October. Depository data showed about ₹6,300 crore of FPI buying between 26 and 30 October.
Why is the NSDL FPI figure for October different from NSE FII data?
Depository FPI data showed ₹34,843 crore of equity selling because it includes primary market investments such as IPOs and settles a day later. NSE data covers only secondary market cash trades, which showed ₹45,160 crore of selling.
How much have FIIs sold in 2026 so far?
From 1 January to 31 October 2026, FIIs sold a net ₹4,48,227 crore in the cash market and DIIs bought ₹7,01,752 crore, based on NSE provisional data. FIIs have been net sellers in all ten months.
The Bottom Line
October 2026 was another heavy month of foreign selling, but it ended better than it began. DIIs absorbed 138% of the FII sale, FIIs turned net buyers in the second half, and the Nifty gained 1.91% after September’s 6.06% fall.
One good fortnight does not reverse a ten-month trend. Crude oil, US yields and the MSCI rebalance will decide whether late-October buying lasts. A practical next step: track the daily cash figures on our FII and DII data home page through the first two weeks of November and check whether FIIs stay net buyers.
Sources: NSE provisional FII/FPI and DII data via NiftyTrader (monthly aggregates, checked 2 November 2026); Free Press Journal (1 November 2026); Angel One (13 October 2026); GKToday report on the 28 October 2026 FOMC decision; NSDL fortnightly sector data via Tapetide; MSCI index review dates; NSE circular 149/2026 and NSE trading holidays 2026.
Disclaimer: This article is for educational purposes only and is not investment advice. Please consult a SEBI-registered advisor before making investment decisions.