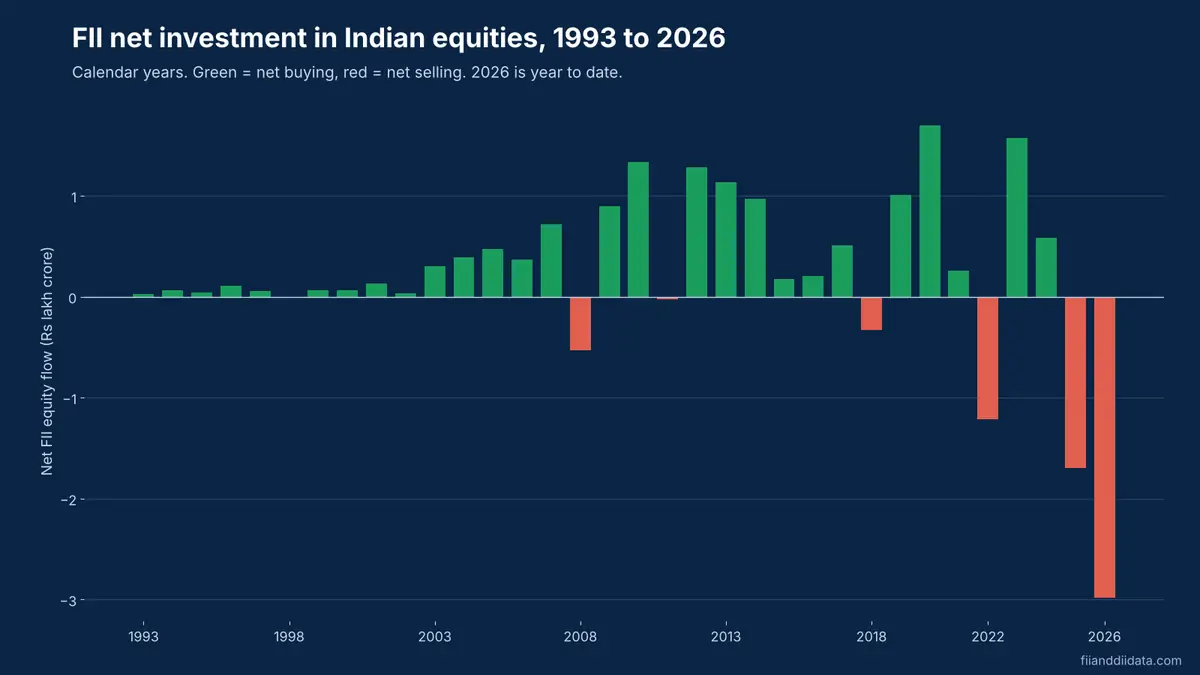
FII DII data history shows that foreign investors have been net buyers of Indian equities in 27 of the last 34 calendar years, yet 2025 and 2026 are the first back-to-back years of net selling in the record. Equitymaster’s yearly series puts FII net selling at about ₹2.98 lakh crore in 2026 so far, while domestic institutions keep buying. Here is the full year-wise record, what each selling cycle taught, and how to use it.
Key Takeaways
- FIIs were net sellers in only 7 of 34 calendar years from 1993 to 2026: 1998, 2008, 2011, 2018, 2022, 2025 and 2026.
- In every earlier case, a net selling year was followed by a net buying year. 2026 broke that pattern.
- FIIs bought a net ₹12.38 lakh crore from 1993 to 2024. The 2025 and 2026 outflows have reversed about 38% of that.
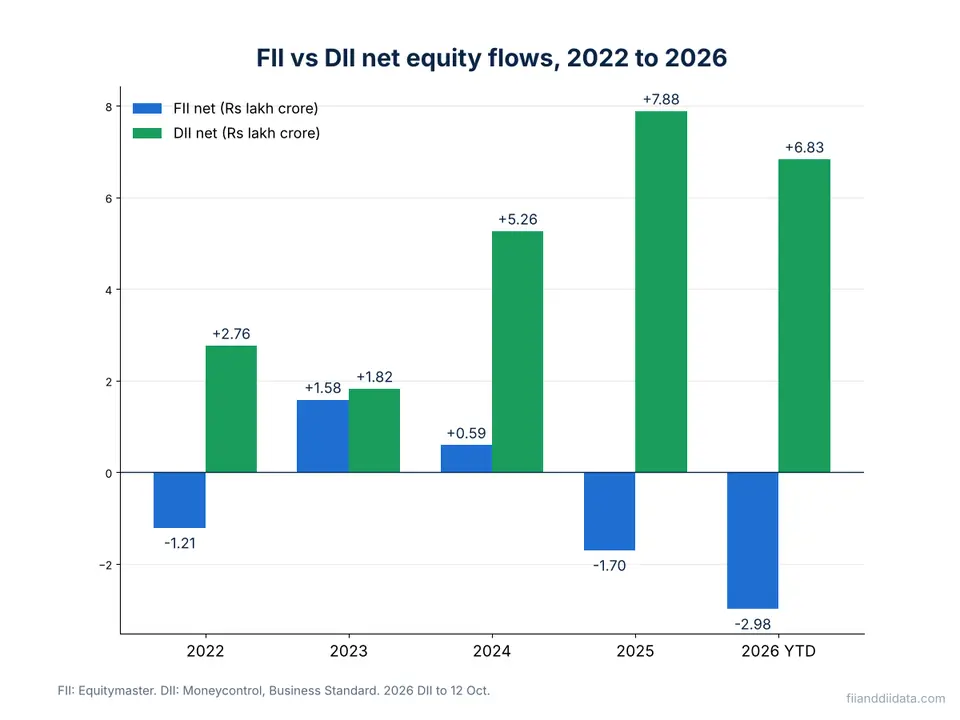
- DIIs bought ₹7.88 lakh crore in 2025 and ₹6.83 lakh crore in 2026 up to 12 October, far more than FIIs sold.
- By March 2026, DIIs owned 20.9% of Indian equities against 17.1% for FIIs.
Table of contents
- What FII DII Data History Shows
- Where FII DII Data History Comes From
- FII DII Data History: Year-Wise FII Flows Since 1993
- Five Selling Cycles and What Followed Each One
- The DII Side of the Record
- Worked Example: Putting the Record in Numbers
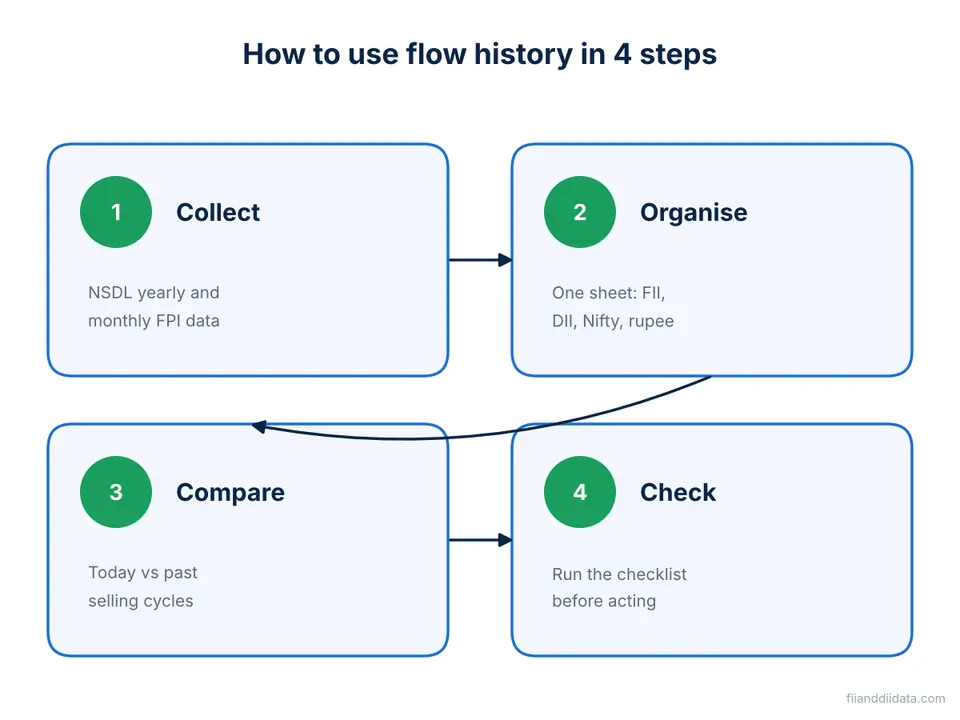
- How to Use FII DII Data History: A 6-Point Checklist
- Common Mistakes When Reading Flow History
- Frequently Asked Questions
- The Bottom Line
What FII DII Data History Shows
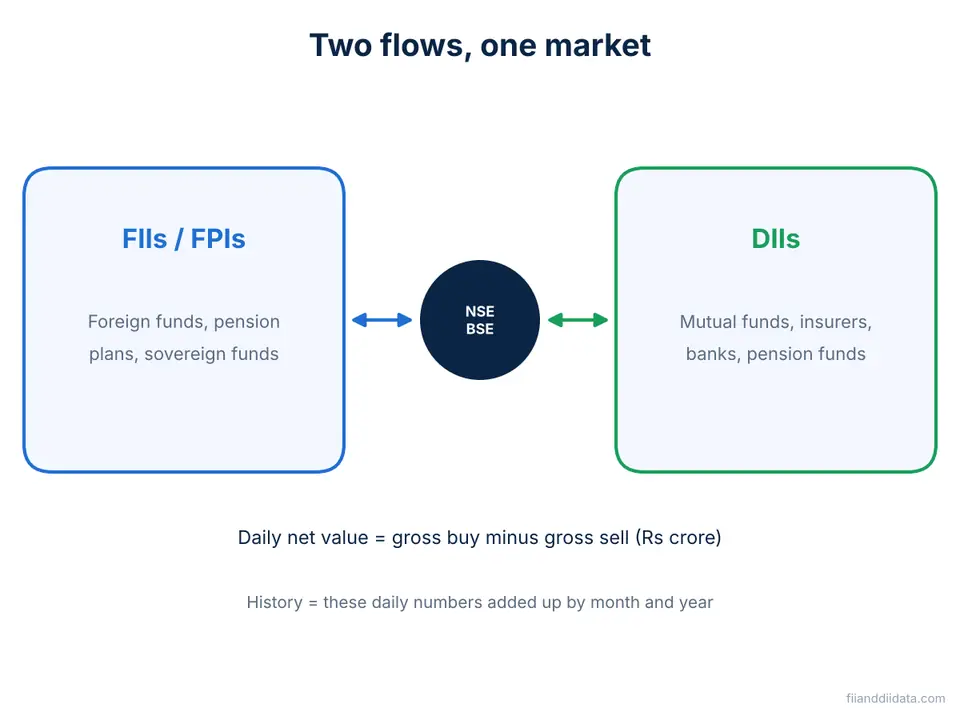
Foreign institutional investors (FIIs), now formally called foreign portfolio investors (FPIs), are overseas funds that buy listed Indian shares. Domestic institutional investors (DIIs) are Indian mutual funds, insurance companies, banks and pension funds. Every trading day, each group’s purchases and sales are added up. The difference is its net figure. A positive number means net buying and a negative number means net selling. If you need a refresher on the two groups, read our guide on the difference between FII and DII.
Flow history is simply those daily net figures added up by month and by year. One day’s number is noise. Thirty years of numbers show how foreign money behaves across booms, crashes and policy changes. They also show how much the market has come to depend on domestic savings.
Three facts stand out from the long record. Foreign money has been a net buyer far more often than a seller. Its selling comes in sharp bursts linked to global events. And since 2022, domestic institutions have absorbed every one of those bursts. Before looking at the numbers, it helps to know where they come from.
Where FII DII Data History Comes From
There is no single official file that holds the complete record. Four sources cover different parts of it.
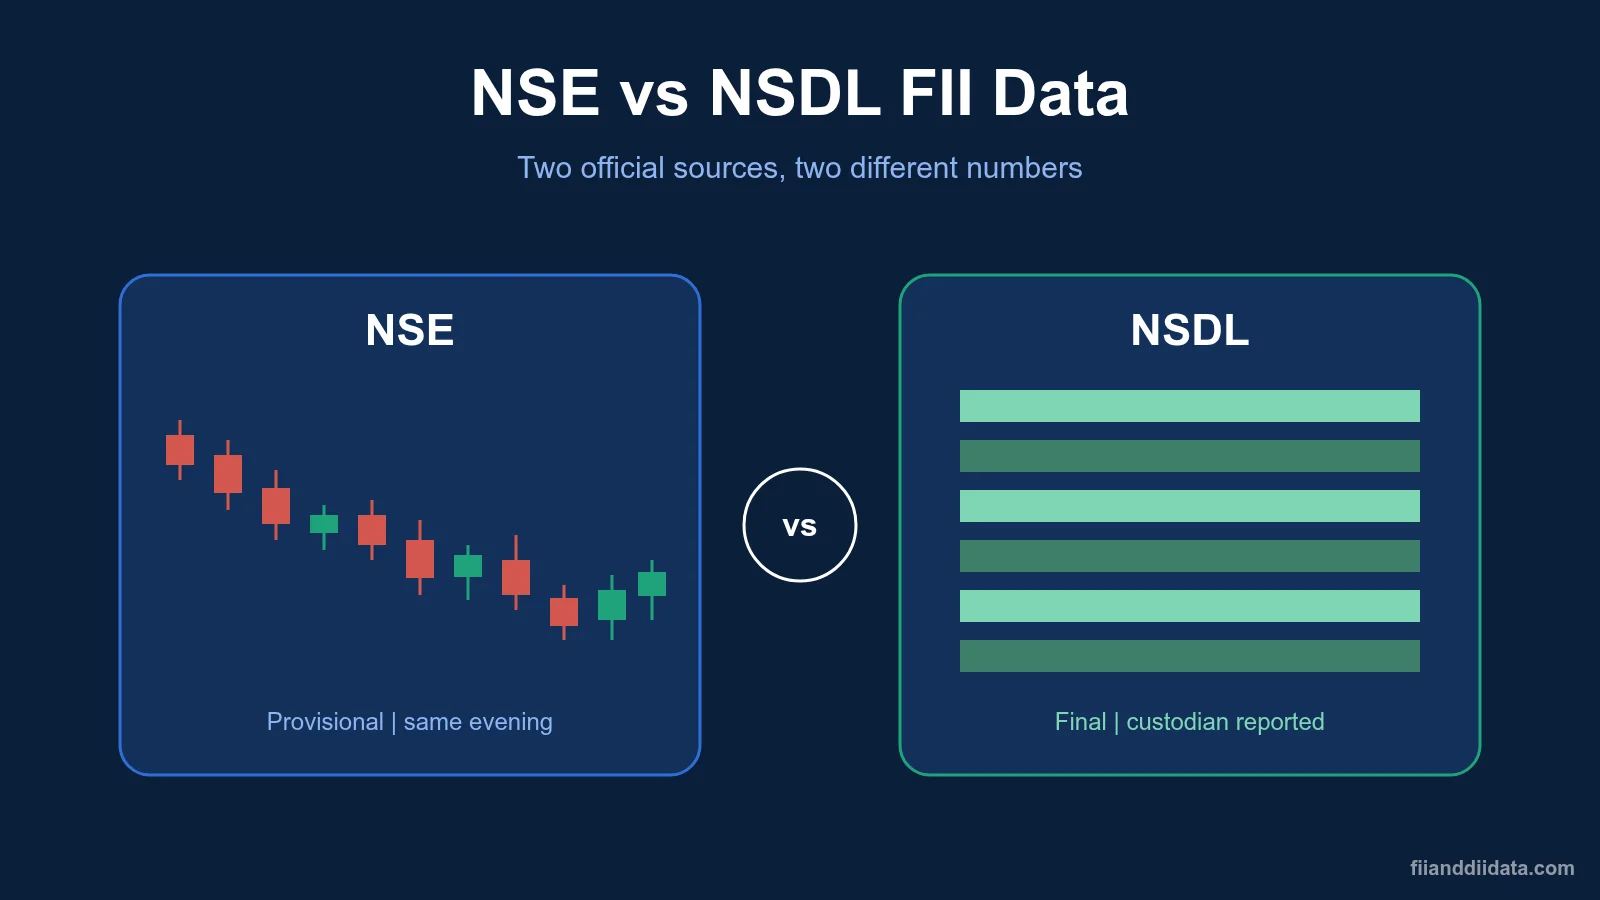
- NSE provisional data. NSE publishes FII and DII cash market figures around 6 PM IST on each trading day. These are quick but provisional. We summarise them every evening in today’s FII DII cash data.
- NSDL FPI data. NSDL, the depository, publishes final FPI investment figures, usually by the next working day. This is the series most news reports use for monthly and yearly FPI totals.
- BSE DII data. BSE has kept DII flow records since 2007, according to Business Standard. That makes 2007 the practical start of a consistent DII series.
- Compiled yearly tables. Sites such as Equitymaster publish year-wise FII totals going back to 1993, which is useful for the long view.
The sources do not always match. NSDL includes primary market and other routes, while the NSE daily figure covers exchange trades only. Our article on why NSE and NSDL FII data differ explains the gap in detail. For your own research, see how to check FII DII data step by step. With the sources clear, here is the full year-wise record.
FII DII Data History: Year-Wise FII Flows Since 1993
The table lists FII net investment in Indian equities for each calendar year. We converted Equitymaster’s figures from rupees million to crore and rounded them. Negative values are net selling. The 2026 figure is year to date.
| Year | FII net (₹ crore) | Year | FII net (₹ crore) |
|---|---|---|---|
| 1993 | 2,595 | 2010 | 1,33,266 |
| 1994 | 6,792 | 2011 | -2,715 |
| 1995 | 3,854 | 2012 | 1,28,361 |
| 1996 | 10,804 | 2013 | 1,13,135 |
| 1997 | 5,760 | 2014 | 97,056 |
| 1998 | -740 | 2015 | 17,806 |
| 1999 | 6,578 | 2016 | 20,566 |
| 2000 | 6,370 | 2017 | 51,254 |
| 2001 | 13,128 | 2018 | -33,013 |
| 2002 | 3,629 | 2019 | 1,01,121 |
| 2003 | 30,459 | 2020 | 1,70,260 |
| 2004 | 38,965 | 2021 | 25,750 |
| 2005 | 47,180 | 2022 | -1,21,439 |
| 2006 | 36,540 | 2023 | 1,57,555 |
| 2007 | 71,486 | 2024 | 58,641 |
| 2008 | -52,987 | 2025 | -1,69,595 |
| 2009 | 89,588 | 2026 (YTD) | -2,97,834 |
NSDL-based totals in news reports differ slightly because of method and cut-off dates. For example, NSDL data cited by Business Standard puts 2025 FPI equity outflows at ₹1.66 lakh crore and 2026 outflows at ₹3.08 lakh crore up to 12 October 2026. The direction and scale are the same in both series.
The best FII buying years were 2020 at ₹1,70,260 crore and 2023 at ₹1,57,555 crore. The worst selling years are the two most recent ones. For the month-by-month picture inside each year, use our FII DII monthly data page. The red years in this table form a clear pattern, covered next.
Five Selling Cycles and What Followed Each One
Before 2025, FII DII data history recorded five calendar years of net FII selling. Each one was followed by a year of net buying, often a strong one.
| Selling year | FII net (₹ crore) | Next year | FII net (₹ crore) |
|---|---|---|---|
| 1998 | -740 | 1999 | 6,578 |
| 2008 | -52,987 | 2009 | 89,588 |
| 2011 | -2,715 | 2012 | 1,28,361 |
| 2018 | -33,013 | 2019 | 1,01,121 |
| 2022 | -1,21,439 | 2023 | 1,57,555 |
| 2025 | -1,69,595 | 2026 (YTD) | -2,97,834 |
The 2008 selling came with the global financial crisis. The 2022 selling came as US interest rates rose quickly. In both cases, foreign money returned the next year once the global trigger eased. The rebound was larger than the outflow each time.
Why 2026 broke the FII DII data history pattern
2026 is the first time in this series that a selling year has been followed by an even bigger selling year. Business Standard, as cited by the Free Press Journal on 13 October 2026, linked the outflows to high US bond yields and a global rally in AI-linked stocks that pulled money to other markets. Our FPI outflow 2026 report tracks the month-wise detail. History says selling cycles end, but it does not say when. That is where the DII side of the record matters.
The DII Side of the Record
For most of the 1990s and 2000s, foreign flows set the market’s direction because domestic institutions were small buyers. Monthly SIP (systematic investment plan) money into mutual funds changed that. DII buying has now outpaced FII selling in every selling year since 2022.
| Year | DII net buying (₹ lakh crore) | FII net (₹ lakh crore) |
|---|---|---|
| 2022 | 2.76 | -1.21 |
| 2023 | 1.82 | 1.58 |
| 2024 | 5.26 | 0.59 |
| 2025 | 7.88 | -1.70 |
| 2026 (to 12 Oct) | 6.83 | -3.08 (NSDL) |
Ownership tells the same story. According to Moneycontrol data from May 2026, DIIs held 20.9% of Indian listed equities in March 2026, an all-time high. FIIs held 17.1%, down from 18.9% a year earlier. Domestic institutions are now the larger owner of the market. Source figures differ a little, as Moneycontrol puts DII buying in 2025 at ₹7.75 lakh crore, but every series shows a record year.
This change explains why the Nifty has not fallen in line with the size of foreign selling. The next section turns these figures into a simple calculation.
Worked Example: Putting the Record in Numbers
Two simple sums show why the current cycle is unusual, and why it has not caused a crash.
Sum 1: how much of 32 years of buying has been reversed?
- Add every FII net figure from 1993 to 2024 in the table. The total is about ₹12.38 lakh crore of net buying.
- Add the 2025 and 2026 figures: ₹1,69,595 crore plus ₹2,97,834 crore equals about ₹4.67 lakh crore of net selling.
- Divide: 4.67 ÷ 12.38 = about 0.38. Roughly 38% of three decades of net foreign buying has gone out in under two years.
Sum 2: how well did DIIs cover the selling?
- In 2026 up to 12 October, DIIs bought ₹6.83 lakh crore and FPIs sold ₹3.08 lakh crore, both per data cited by the Free Press Journal.
- Divide: 6.83 ÷ 3.08 = about 2.2. DIIs bought roughly ₹2.2 for every ₹1 that FPIs sold.
- Run the same sum for 2025: ₹7.88 lakh crore of DII buying against Equitymaster’s ₹1.70 lakh crore of FII selling gives about 4.6. Domestic cover was even stronger last year.
The first sum says the foreign exit is historic in size. The second says domestic money has more than replaced it so far. Both are needed to read the market honestly. The checklist below turns this into a routine.
How to Use FII DII Data History: A 6-Point Checklist
History is most useful as a frame for today’s numbers, not as a forecast. Use these six checks when foreign selling is in the headlines.
- Size the selling against history. Compare the current year’s outflow with past selling years in the table. Is it ordinary or extreme?
- Name the trigger. Past cycles had a clear global cause, such as the 2008 crisis or the 2022 rate hikes. Note the current one and watch whether it is fading.
- Check DII cover. Divide DII buying by FII selling for the same period. A ratio above 1 means domestic money is absorbing the outflow.
- Match the sources. Compare NSDL with NSDL and NSE with NSE. Do not mix a provisional daily total with a final yearly one.
- Use the same calendar. Keep calendar-year and financial-year (April to March) figures apart.
- Watch for the turn. In past cycles, buying returned within a year. Track monthly flows for the first sustained run of net buying.
Our FII DII data dashboard updates the daily and monthly figures you need for checks 3 to 6. Even with a checklist, a few errors are common.
Common Mistakes When Reading Flow History
- Assuming history must repeat. Five selling years were followed by buying years. 2026 was not. A pattern is a guide, not a rule.
- Comparing rupee totals across decades without context. ₹50,000 crore of selling in 2008 was large for a much smaller market. Compare flows with market size or with DII buying, not only in absolute rupees.
- Ignoring the primary market. FPIs can sell on the exchange and buy heavily in IPOs at the same time. The Wire reported about ₹55,000 crore of FPI IPO buying in 2026 up to late September.
- Mixing provisional and final data. NSE daily figures and NSDL totals can differ by large amounts over a year.
- Reading flows without prices. Heavy selling with a stable Nifty means strong domestic demand. Heavy selling with a falling Nifty means it is not enough.
Avoid these and the long record becomes a reliable reference rather than a source of false signals. Below are the questions readers ask most often.
Frequently Asked Questions
How far back does FII DII data history go?
Year-wise FII equity flow data is available from 1993 in compiled series such as Equitymaster’s. A consistent DII series starts in 2007, when BSE began keeping DII records. NSE and NSDL publish current daily and monthly figures.
Which year saw the highest FII selling in India?
2026 is the record year. NSDL data cited by Business Standard shows FPI equity outflows of ₹3.08 lakh crore up to 12 October 2026, nearly double the ₹1.66 lakh crore of 2025, which was the previous record.
Which year had the highest FII buying in India?
According to Equitymaster’s yearly series, 2020 had the highest FII net buying at about ₹1,70,260 crore, followed by 2023 at about ₹1,57,555 crore.
Where can I find FII DII historical data?
Use NSE for daily provisional FII and DII cash figures, NSDL’s FPI reports for final monthly and yearly foreign flows, and BSE for DII history since 2007. Compiled yearly tables from sites such as Equitymaster help with the long view.
Do FIIs always return after a selling year?
Not always. In 1998, 2008, 2011, 2018 and 2022, a selling year was followed by a buying year. But 2025 was followed by even heavier selling in 2026, so the pattern is a guide rather than a rule.
The Bottom Line
Thirty-four years of FII DII data history show a market that foreign money has mostly bought, with short and sharp selling bursts that later reversed. The 2025 and 2026 outflows are the largest in the record and the first back-to-back selling years, reversing about 38% of the net foreign buying built up since 1993.
The other half of the record matters as much. Domestic institutions bought about ₹2.2 for every ₹1 FPIs sold in 2026 up to 12 October, and they now own more of the market than foreign investors do. As a next step, track the monthly flows for the first sustained turn in foreign buying, and compare it with the past cycles in the table above. More explainers are on the FIIAndDIIData.com blog.
Sources: Equitymaster, yearly FII investment data (accessed 28 Oct 2026); Free Press Journal, 13 Oct 2026 (NSDL and Business Standard data); Moneycontrol via TradingView, May 2026 (DII flows and ownership); Business Standard, 15 Oct 2025 (BSE DII records since 2007); The Wire, 26 Oct 2026 (FPI IPO buying).
Disclaimer: This article is for educational purposes only and is not investment advice. Please consult a SEBI-registered advisor before making investment decisions.