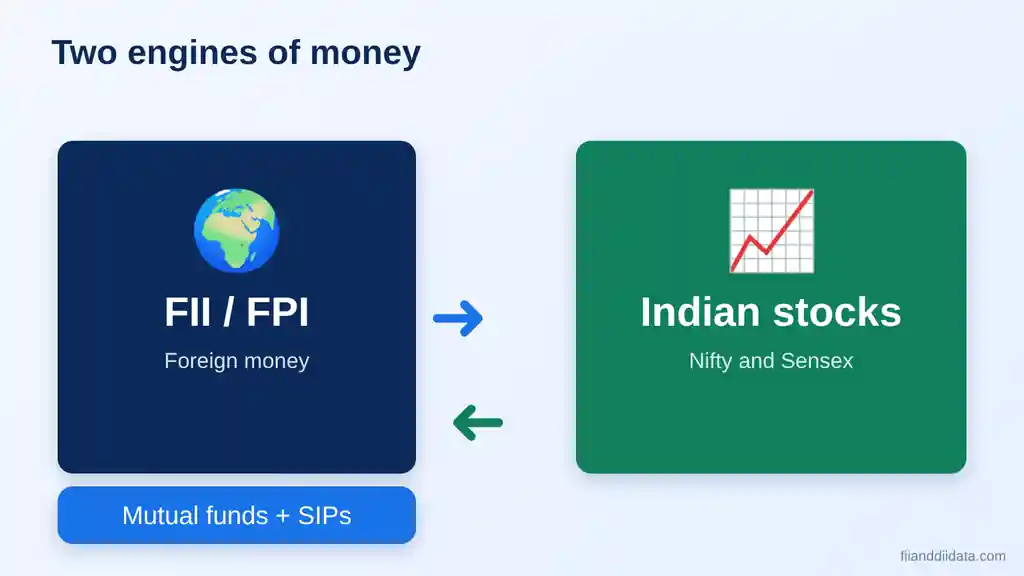
This FII DII weekly report covers the four trading sessions from 9 to 13 November 2026 (10 November was a market holiday). Foreign institutional investors (FIIs) were net buyers of ₹33,343 crore in the cash market, while domestic institutional investors (DIIs) were net sellers of ₹24,192 crore. All figures are NSE provisional data, published around 6 PM IST each day, and NSDL data remains the final record.
Key Takeaways
- FIIs bought a net ₹33,342.70 crore across four sessions, with buying on every day.
- DIIs sold a net ₹24,191.81 crore, so the combined institutional net was about +₹9,151 crore.
- The Nifty closed at 25,144.30 on 13 November, down 0.61% on the day, even though FIIs bought ₹5,736.55 crore.
- FII index futures stood at a net short of 49,719 contracts on 12 November, so cash buying was not a pure bullish signal.
- Daily flows for the week
- Cash buying versus the futures hedge
- Worked example: 13 November
- Five step checklist
- FAQ
FII DII Weekly Report: Daily Flows From 9 to 13 November 2026
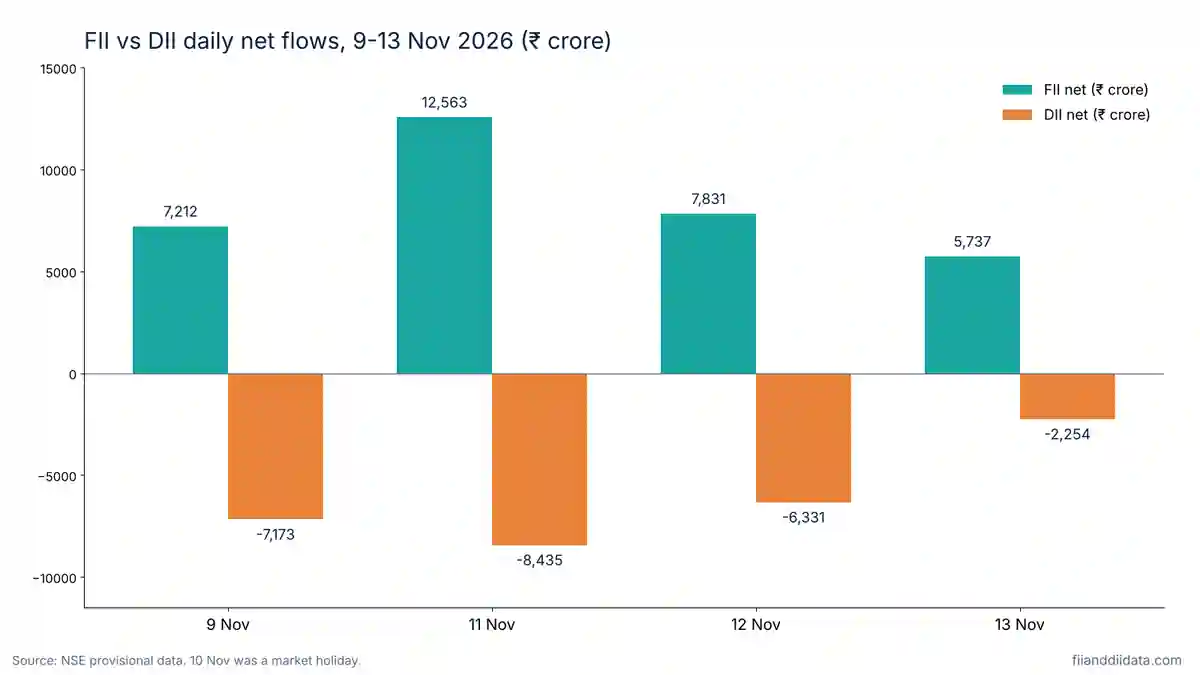
FII buying was strongest on Wednesday 11 November, when the net figure reached ₹12,563.33 crore. DIIs sold on every session, which is a common pattern when foreign money pushes prices up and domestic funds book profits. For the latest daily numbers, see our page on FII DII data today, and for the full dashboard visit FII and DII data.
| Date | FII net (₹ Cr) | DII net (₹ Cr) | Combined (₹ Cr) | Nifty close |
|---|---|---|---|---|
| 9 Nov | +7,212.22 | -7,172.53 | +39.69 | 25,044.65 |
| 11 Nov | +12,563.33 | -8,434.53 | +4,128.80 | 25,255.05 |
| 12 Nov | +7,830.60 | -6,331.17 | +1,499.43 | 25,299.35 |
| 13 Nov | +5,736.55 | -2,253.58 | +3,482.97 | 25,144.30 |
| Week | +33,342.70 | -24,191.81 | +9,150.89 |
The pattern is worth noting. The Nifty rose from 25,044.65 on 9 November to 25,299.35 on 12 November, then fell to 25,144.30 on 13 November. On that last day the Sensex ended at 81,592.45 and India VIX stood at 15.54. Heavy foreign buying did not stop the Friday dip, which shows that one day of cash flow does not decide the index direction. The previous week (2 to 6 November) saw FII net buying of about ₹45,960 crore, so this week was a slower pace of buying, not a reversal.
A weekly view matters because single sessions can swing on expiry days, index rebalancing and block deals. A four session total smooths out that noise. DII selling shrank from ₹8,434.53 crore on Wednesday to ₹2,253.58 crore on Friday, which hints at easing domestic profit booking, though one week is a small sample and should not be treated as a trend.
Why This FII DII Weekly Report Needs the Futures Hedge Check
Cash market flows tell only half the story. According to NSE participant-wise open interest for 12 November, FIIs held a net short of 49,719 index futures contracts. In index options their net position was 208,109 calls and 378,895 puts, as the participant-wise open interest page records. Large cash buying alongside a net short futures book can mean FIIs are hedging their cash holdings, not taking a one way bullish bet.
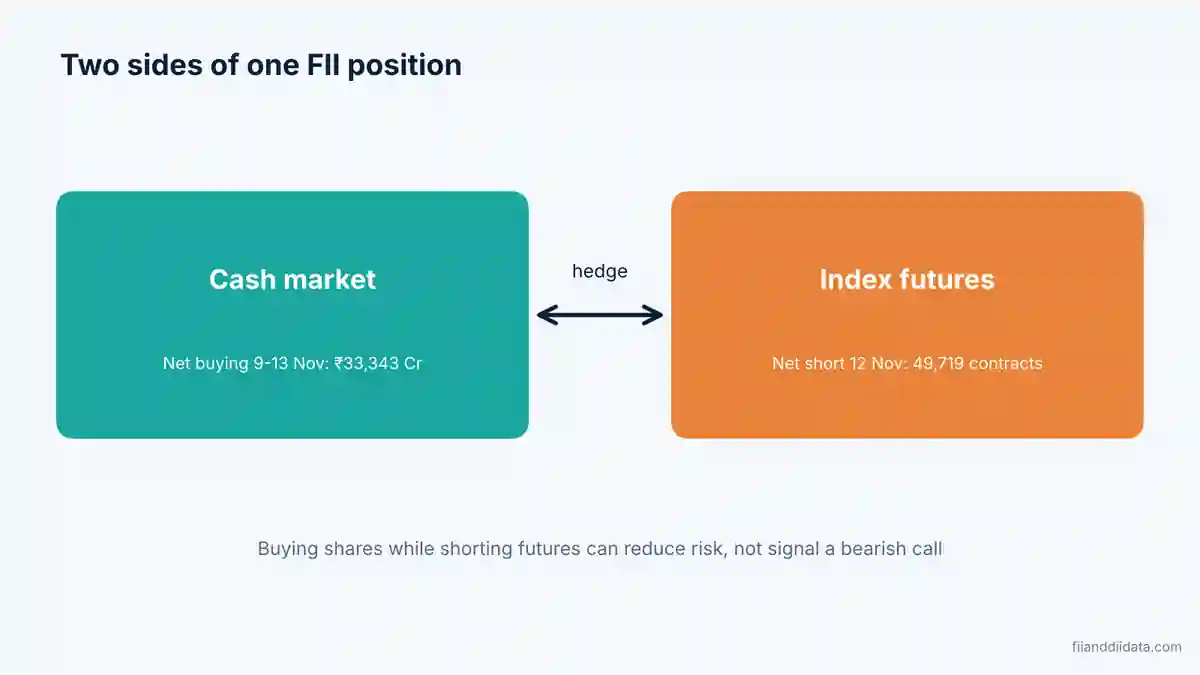
This is why we always compare the two datasets. Our guide on cash data versus participant-wise OI explains the gap, and the FII derivatives page and options activity tracker show the positions in detail. A hedge is a possible reading, not a certainty, because the data does not show intent.
Worked Example: Reading 13 November in the Weekly Report
On Friday 13 November, FIIs bought a net ₹5,736.55 crore and DIIs sold a net ₹2,253.58 crore. Add the two and the combined institutional net is +₹3,482.97 crore. That is a positive number, yet the Nifty fell 0.61%. The lesson is that institutional flows are one input among several, alongside global cues, derivatives positioning and retail activity. Read the combined figure first, then check whether DIIs are selling because of profit booking or because of weak sentiment. Our explainer on what DII selling means covers that distinction.
Five Step Checklist for Reading Any Weekly Flow Report
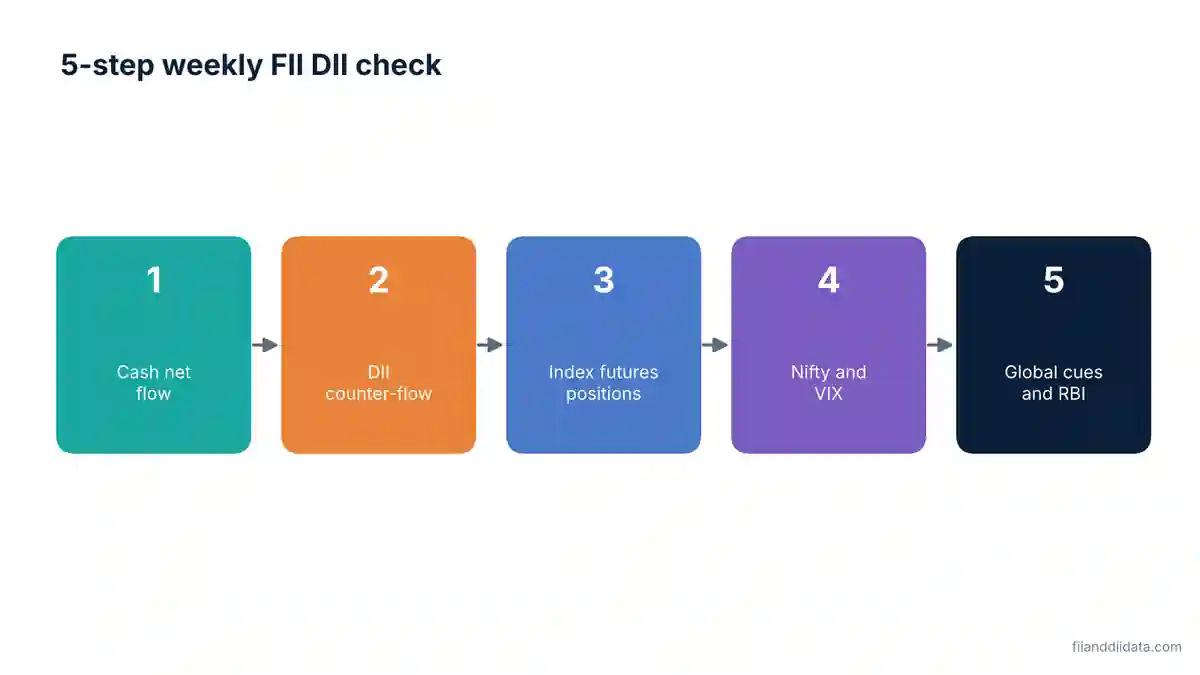
- Note the FII and DII net figures for each session, and add them for the week.
- Compute the combined net, so you see whether domestic selling absorbed foreign buying.
- Check FII index futures and options positions to see if cash buying is hedged.
- Compare flows with the index move, and look for days when they disagree.
- Add global cues and the calendar of events, such as those in our FII DII calendar, before drawing a conclusion.
Frequently Asked Questions
What did FIIs and DIIs do during 9 to 13 November 2026?
FIIs were net buyers of ₹33,342.70 crore and DIIs were net sellers of ₹24,191.81 crore across four sessions, based on NSE provisional data.
Why was there no data for 10 November?
10 November 2026 was a market holiday, so the week had four trading sessions.
Does FII buying always lift the Nifty?
No. On 13 November FIIs bought ₹5,736.55 crore, yet the Nifty fell 0.61% to 25,144.30. Flows are one input among several.
Which data is final, NSE or NSDL?
NSE publishes provisional FII and DII figures around 6 PM IST each day. NSDL data is the final record for FPI flows.
What does an FII net short in index futures mean?
It means FIIs hold more short than long index futures contracts. Alongside cash buying it can indicate hedging, though the data does not confirm intent.
The Bottom Line
FIIs bought and DIIs sold through the week, leaving a modest combined net inflow of about ₹9,151 crore. The futures short position and the Friday dip are reminders to read cash flows together with derivatives data. Next, watch whether FII buying holds up and whether DII selling keeps slowing.
Sources: NSE FII/DII statistics (provisional, 9 to 13 November 2026); NSDL FPI Monitor (final FPI data); NSE participant-wise open interest, 12 November 2026.
Disclaimer: This article is for information only and is not investment advice. Markets carry risk, so consult a SEBI registered adviser before acting.