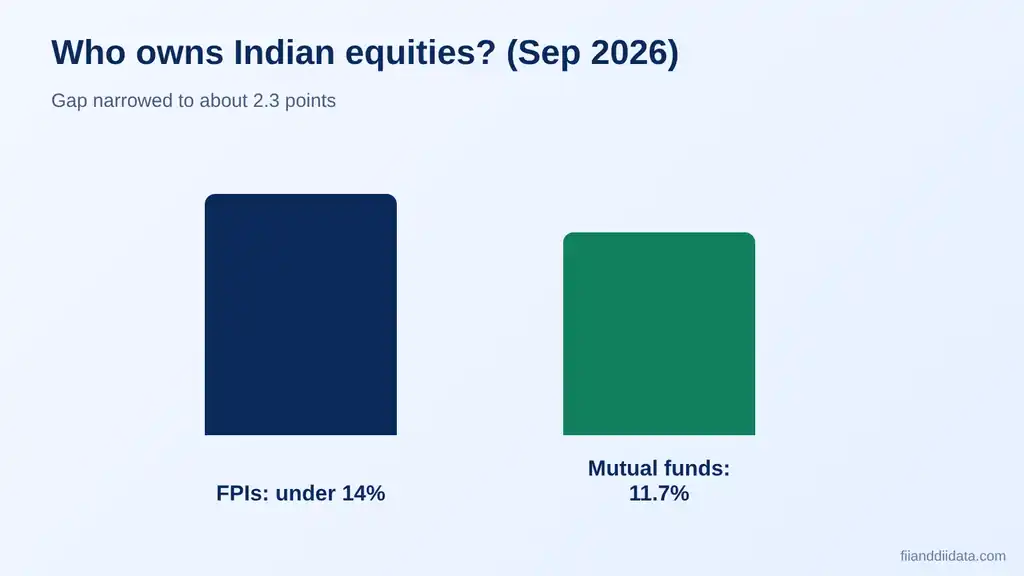
FII vs mutual funds is the biggest ownership question in Indian stocks in 2026. In September 2026, foreign portfolio investors held under 14% of listed Indian equities, while mutual funds held about 11.7%, according to NSDL data reported by Economic Times. The gap is now only a couple of points. This guide explains who moves the market, why, and how to read both flows together.
Key Takeaways
- FIIs (foreign institutional investors, now called FPIs) own under 14% of Indian listed equities; mutual funds own about 11.7% (Sep 2026).
- Foreign money moves with global rates, the dollar and risk appetite. Mutual fund money moves with monthly SIP inflows.
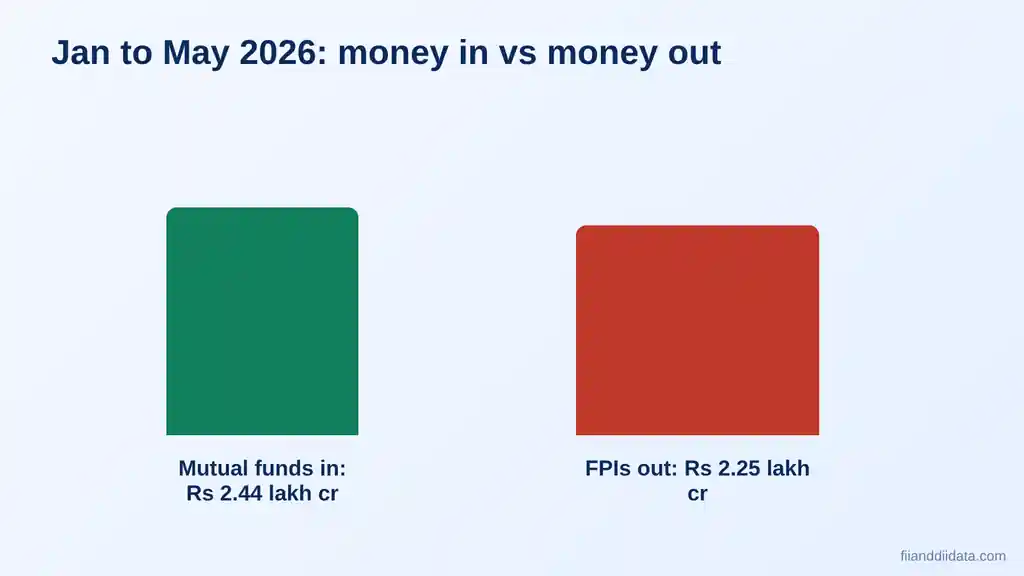
- From January to May 2026, mutual funds put in about Rs 2.44 lakh crore while FPIs pulled out about Rs 2.25 lakh crore.
- When the two flows point in opposite directions, the market often holds steady even on heavy foreign selling.
- Read both together: NSE provisional data after 6 PM IST, NSDL final FPI data the next working day.
Table of Contents
- What Are FIIs and Mutual Funds?
- Who Owns More of Indian Stocks?
- Where the Money Comes From
- Latest Data: Money In vs Money Out
- How the Two Flows Move Nifty
- How to Read Both Flows: A 4-Step Checklist
- Common Mistakes
- Pros and Cons of Each Type of Money
- FAQ
What Are FIIs and Mutual Funds?
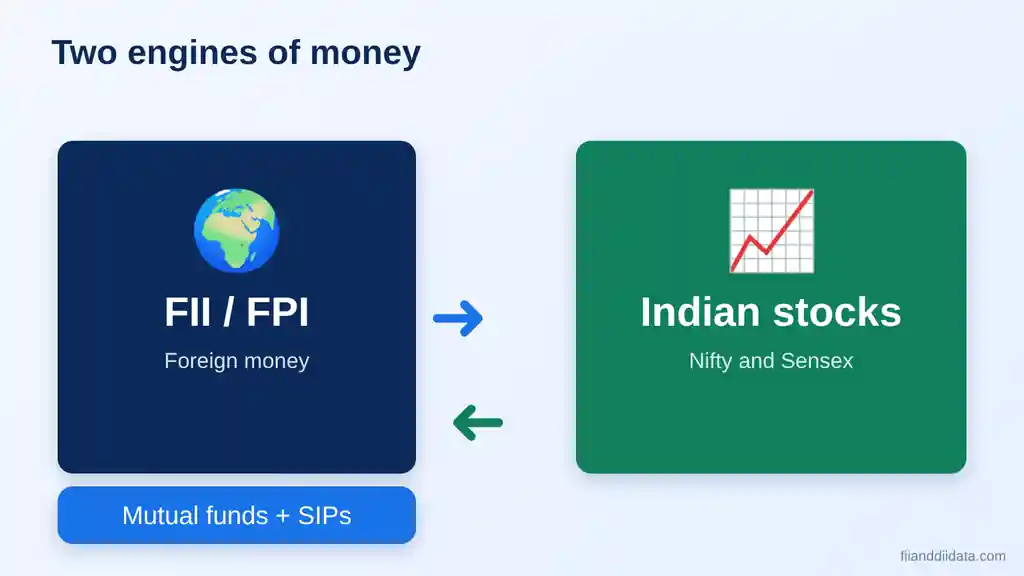
An FII, or foreign institutional investor, is an overseas fund that buys Indian shares and bonds. Think of pension funds, sovereign wealth funds and global asset managers. SEBI now groups them under the name foreign portfolio investor, or FPI, but most traders still say FII. Their daily numbers sit inside what we track as FII and DII data.
A mutual fund pools money from lakhs of Indian households and invests it in shares, bonds and other assets. Mutual funds are the largest part of the domestic institutional investor group, or DII. Insurance companies, banks and pension funds make up the rest of the DII bucket.
So the real contest is not just FII against DII. It is foreign money against the monthly savings of Indian families, which flows through SIPs (systematic investment plans). That difference shapes everything else in this article.
Who Owns More of Indian Stocks?
For years, FPIs were the clear number one owners of Indian equities. That is changing. In September 2026, ownership data compiled by Economic Times and 5paisa from NSDL figures showed FPIs below 14% and mutual funds at about 11.7%. NSE Market Pulse data put mutual funds at about 11.6% in June 2026.
If we treat the foreign figure as 14%, the gap is about 2.3 percentage points. Because the foreign share is a little below 14%, the true gap is slightly smaller. Different sources also report slightly different decimals, because they use different date cut-offs and company lists. Always read the date next to a number.
Why FII vs mutual funds ownership matters
Ownership tells you who can sell the most when sentiment turns. A market owned mostly by foreigners reacts sharply to US bond yields and the rupee. A market with a growing domestic base can absorb that selling better. This is why a falling foreign share is not automatically bad news for Nifty.
Where the Money Comes From
The two groups answer to very different forces. Understanding the source of the money helps you guess how long a trend will last.
Foreign money: global and fast
FIIs decide based on global conditions. US interest rates, the dollar index, crude oil prices and risk appetite all matter. If US yields rise, a fund in New York may sell Indian shares to buy safer bonds at home. That decision has little to do with how Indian companies are performing. Foreign flows can also reverse within days.
Mutual fund money: local and steady
Mutual funds receive money every month through SIPs, whether the market is up or down. That gives them a steady stream of cash to invest. AMFI publishes monthly industry data around the 10th to 12th of each month, so the picture arrives with a delay. Because SIP money is sticky, domestic buying tends to be smoother than foreign flows.
Latest Data: Money In vs Money Out
The best way to see the contest is to put the numbers side by side. The table below collects the figures we verified this week, each with its date.
| Measure | FPIs (FIIs) | Mutual funds |
|---|---|---|
| Share of listed Indian equities, Sep 2026 | Under 14% | About 11.7% |
| Share of listed Indian equities, Jun 2026 | Not compared here | About 11.6% (NSE Market Pulse) |
| Net flow into equities, Jan to May 2026 | Outflow of about Rs 2.25 lakh crore | Inflow of about Rs 2.44 lakh crore |
| Main driver | Global rates, dollar, risk appetite | Monthly SIP inflows |
The pattern is clear. Over the first five months of 2026, foreigners sold and Indian mutual funds bought, and the two amounts were close. That is one reason Nifty did not fall as far as foreign selling alone would suggest. For daily readings, check our FII DII data today page after the NSE provisional release at about 6 PM IST.
How the Two Flows Move Nifty
Index levels depend on the net result of buying and selling. When foreigners sell and mutual funds buy, the two partly cancel out. The size of each side decides the outcome.
Worked example (illustrative numbers)
The figures below are made up to show the logic. They are not real market data. Suppose on one trading day FIIs sell shares worth Rs 3,000 crore net, and mutual funds buy Rs 2,400 crore net. The combined institutional flow is Rs 600 crore of net selling. That is a small imbalance, and Nifty may move only slightly.
Now change one number. If mutual funds buy only Rs 800 crore, the net selling grows to Rs 2,200 crore. That is a much heavier push down. The lesson is simple: the foreign number alone never tells the story. You need the domestic number beside it. Our FII DII data archive lets you compare both on the same day.
The derivatives angle
Cash market flows are only half the picture. FIIs also take large positions in index futures and options, which shows their view on direction. You can follow this in our FII options activity tracker and in participant-wise open interest data. Mutual funds use derivatives mainly to hedge, so their footprint there is smaller.
How to Read Both Flows: A 4-Step Checklist
Use this routine after the market closes. It takes about five minutes.
- Check the foreign number first. Look at the NSE provisional FII net figure after 6 PM IST, and confirm with NSDL final data on the next working day.
- Check the domestic number. Look at the DII net figure on the same day. Mutual funds drive most of it.
- Compare the two. Add them. A large foreign sale with a matching domestic purchase is a muted signal. A foreign sale with weak domestic buying is a warning.
- Look at the trend, not one day. Review the last five to ten sessions and the monthly FII DII data before drawing a conclusion.

Common Mistakes
- Reading FII data alone. One side of the trade gives half a story.
- Treating provisional data as final. NSE provisional figures can differ from NSDL final numbers.
- Mixing up cash and derivatives flows. A big cash sale and a big futures buy can happen together.
- Judging by one day. A single large session says little. Trends over weeks matter more.
- Comparing different dates. An ownership figure from June and a flow figure from September are not directly comparable.
Pros and Cons of Each Type of Money
FIIs
- Pros: Deep pockets, global research, and strong influence on large-cap stocks and the index.
- Cons: Quick to reverse, sensitive to events outside India, and capable of sharp single-day selling.
Mutual funds
- Pros: Steady SIP inflows, a long-term view, and a cushion when foreigners sell.
- Cons: Inflows depend on retail confidence, so a long market fall can slow SIP growth and weaken the cushion.
What Happens When Foreign and Domestic Flows Disagree
The most useful days to study are the ones where FIIs and mutual funds act in opposite ways. These days show which side has more strength at that moment.
If FIIs sell heavily and DIIs buy an equal amount, large-cap shares such as banks and IT companies can still fall, because foreigners hold more of them. Mid-cap and small-cap shares often hold up better, since domestic funds own a bigger share of that part of the market. This split is why traders look at sector data along with the headline figure.
If both groups sell on the same day, the signal is stronger. There is no natural buyer to absorb the supply, and index falls can be sharper. If both buy together, the move up is usually broad and stable.
Keep one more point in mind. Mutual funds hold cash from investors who can redeem at any time. If a long fall makes small investors stop their SIPs or redeem units, the domestic cushion becomes thinner. This is why we track SIP trends and monthly flows alongside daily institutional numbers.
For a practical check, compare the net FII figure with the net DII figure on each of the last five sessions. Mark each day as foreign-led, domestic-led or mixed. Over a few weeks, you will see which side is setting the tone for Nifty and Bank Nifty.
FAQ
What is the difference between FII vs mutual funds?
FIIs are overseas investors who buy Indian shares based on global conditions. Mutual funds are Indian funds that invest money collected from households, mostly through SIPs. FIIs move faster; mutual funds invest more steadily.
Do mutual funds own more of Indian stocks than FIIs now?
Not yet, but the gap is small. In September 2026, FPIs held under 14% and mutual funds held about 11.7% of listed Indian equities, according to NSDL data reported by Economic Times.
Are mutual funds part of DII?
Yes. Mutual funds are the largest part of the domestic institutional investor group. Insurance companies, banks and pension funds are also DIIs.
When is FII and mutual fund data released?
NSE publishes provisional FII and DII cash market data at around 6 PM IST on trading days. NSDL releases final FPI data on the next working day. AMFI publishes monthly mutual fund data around the 10th to 12th of the following month.
Why does Nifty sometimes hold up when FIIs sell?
Domestic buying, mainly from mutual funds through SIPs, can offset foreign selling. When the two amounts are close, the net pressure on the index is small.
The Bottom Line
Foreign investors still own more of Indian stocks than mutual funds, but the lead is shrinking. Foreign money brings global swings; mutual fund money brings a steady domestic bid. Neither one tells the full story on its own.
The practical step is to read both numbers every evening and watch the trend over weeks. Start with the daily figures on our blog and data pages, and compare foreign and domestic flows side by side.
Sources: NSDL FPI Monitor; NSE India; AMFI; Economic Times and 5paisa reports on September 2026 ownership data. Disclaimer: This article is for educational purposes only and is not investment advice. Please consult a SEBI-registered advisor before making investment decisions.