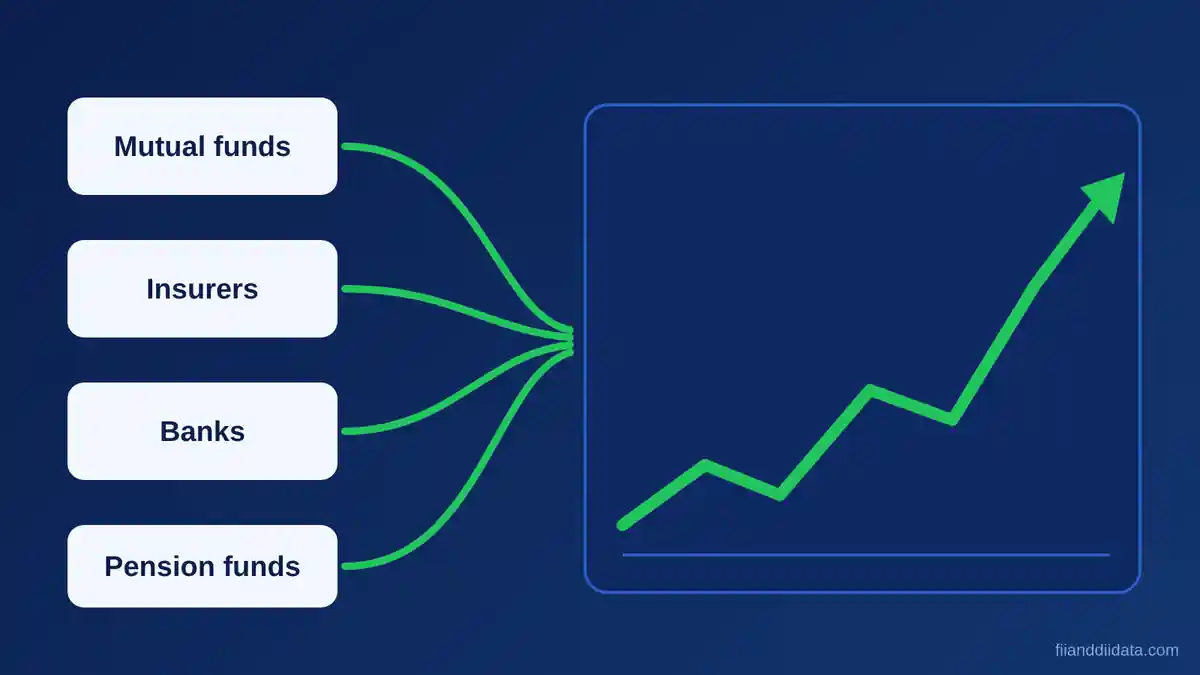
DII buying meaning: when domestic institutional investors (DIIs) buy more shares than they sell in a session, their net figure turns positive, and the market reads it as Indian money supporting prices. DIIs include mutual funds, insurers, banks and pension funds. Between 2 and 11 November 2026, FIIs were net buyers of about Rs 65,735 crore while DIIs were net sellers of about Rs 40,504 crore, so the sign of the number matters as much as its size.
Key Takeaways
- DII buying means Indian institutions bought more shares than they sold on a day, so the net figure is positive.
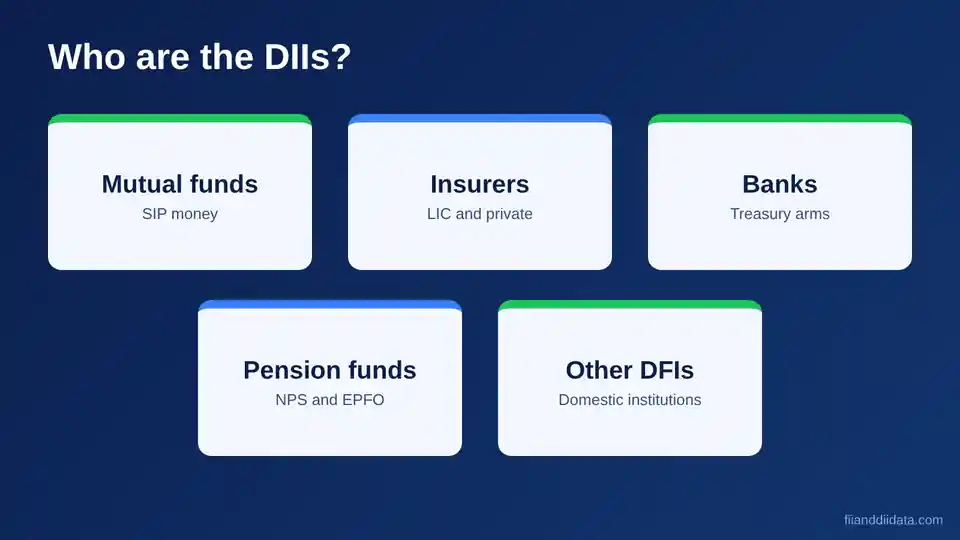
- DIIs are mutual funds, insurers, banks, pension funds and other domestic institutions.
- Read the net figure together with the FII figure and the Nifty move, never in isolation.
- In early November 2026, DIIs were net sellers on all eight sessions while FIIs bought heavily.
- NSE publishes provisional numbers after market close, so treat the first print as a guide, not a final figure.
- What Is the DII Buying Meaning in Simple Terms?
- Who Counts as a DII in India?
- Why Does DII Buying Matter for the Market?
- DII Buying in November 2026: What the Latest Data Shows
- How FIIs and DIIs Balance Each Other
- How to Read DII Buying: A 4-Step Worked Example
- What DII Buying Meaning Tells Traders: A Checklist
- Common Mistakes When Reading DII Buying
- Frequently Asked Questions About DII Buying
- The Bottom Line
What Is the DII Buying Meaning in Simple Terms?
DII stands for domestic institutional investor. These are large Indian institutions that invest other people’s money in shares, bonds and other assets. When market data says DIIs bought, it means the value of shares they purchased in the cash market was higher than the value they sold on that day.
The number in daily reports is a net figure. If DIIs bought Rs 12,000 crore of shares and sold Rs 9,000 crore, the DII net buying is Rs 3,000 crore. A positive figure is net buying. A negative figure is net selling. You can see the latest day-by-day numbers on our FII DII data today page.
Gross Buying vs Net Buying
Gross buying is the total purchase value in a session. Net buying is purchases minus sales. Headlines almost always quote the net figure, because it shows whether institutions are adding money to the market or taking it out. A large gross number with a small net number means heavy two-way trading with little change in overall stance.
The figures come from the exchange. NSE publishes provisional FII and DII cash-market data after market close, usually around 6 PM IST on trading days. Provisional numbers can be revised, so the first print is a good guide but not the final word.
Before reading the numbers, it helps to know exactly who sits inside the DII group.
Who Counts as a DII in India?
The DII group is made up of several kinds of domestic institutions. Each has a different source of money and a different style of investing, which is why the combined figure can move for very different reasons.
- Mutual funds: pool money from retail and other investors, including monthly SIPs, and are usually the biggest source of DII equity demand.
- Insurance companies: LIC and private life and general insurers invest premium income, mostly with a long holding period.
- Banks and financial institutions: invest from their own treasury funds within regulatory limits.
- Pension funds: retirement money, such as NPS-linked funds, which can put only a limited share into equities.
- Other domestic institutions: development finance institutions and similar bodies.
Mutual funds matter most for daily flows because SIP money arrives every month whatever the index level. Monthly fund-industry data is published by AMFI, and our note on the SIP stoppage ratio shows how steady that inflow has been. For named institutions, see our list of examples of DIIs.
Now that the players are clear, the next question is why their buying carries so much weight.
Why Does DII Buying Matter for the Market?
Every sale needs a buyer. When foreign investors sell Indian shares, the price only holds if someone else steps in, and DIIs are often that buyer. Their demand can soften a fall that would otherwise be steeper. Over time this has made domestic money a stabilising force in Indian equities, a point we cover in our guide to the role of DIIs in the Indian stock market.
Three features make DII money different from foreign money. First, much of it is steady: SIP and insurance premiums keep arriving. Second, many DIIs have long time horizons, so they react less to short-term global news. Third, domestic funds are less exposed to rupee and global interest-rate moves than overseas investors are.
DII Buying Meaning for a New Investor
For a beginner, the quick reading is simple. A positive DII number means Indian institutions added shares that day. A negative number means they reduced holdings. It is a clue about demand, not a promise about price, and it needs context from the FII side and the index itself.
That context is clearest when you look at a real stretch of data, so let us do that next.
DII Buying in November 2026: What the Latest Data Shows
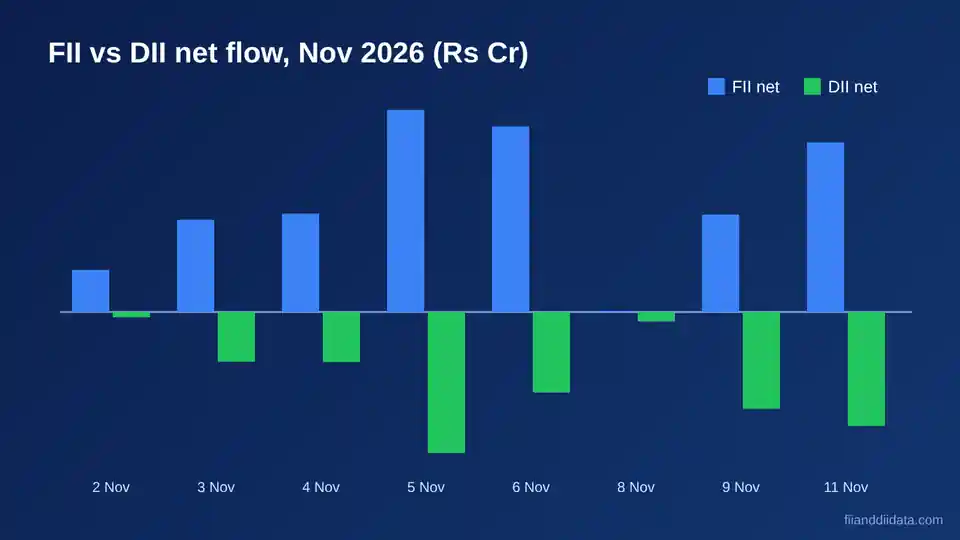
The first eight sessions of November 2026 (2 to 11 November, as compiled on 11 November) reversed what many readers expect. FIIs were net buyers on seven sessions and flat on 8 November. DIIs were net sellers on all eight sessions.
| Date (Nov 2026) | FII net (Rs crore) | DII net (Rs crore) |
|---|---|---|
| 2 Nov | +3,114.68 | -392.20 |
| 3 Nov | +6,836.81 | -3,678.85 |
| 4 Nov | +7,284.03 | -3,712.23 |
| 5 Nov | +14,974.68 | -10,444.54 |
| 6 Nov | +13,749.82 | -5,968.70 |
| 8 Nov | -0.25 | -700.31 |
| 9 Nov | +7,212.22 | -7,172.53 |
| 11 Nov | +12,563.33 | -8,434.53 |
| Total | +65,735.32 | -40,503.89 |
Over these sessions FIIs bought about Rs 65,735 crore net, while DIIs sold about Rs 40,504 crore net. The widest single-day gap came on 5 November, when FIIs bought Rs 14,974.68 crore and DIIs sold Rs 10,444.54 crore.
What does this mean? DII net selling during a burst of FII buying can happen after a rally, when domestic funds book profits into strength or rebalance portfolios while foreign money returns. It does not by itself signal a weak market. It also shows why a positive DII figure is never guaranteed, and why the phrase DII buying describes a direction on a given day, not a permanent trend.
For longer runs of data, our monthly FII DII data page shows how each month added up. Next, we look at how the two groups interact.
How FIIs and DIIs Balance Each Other
FIIs are foreign institutional investors, such as overseas funds and global asset managers. DIIs are their Indian counterparts. Because both groups trade in the same cash market, one side’s selling is the other side’s buying, along with retail investors, proprietary traders and others. The net figures for FIIs and DIIs therefore tend to pull in opposite directions, although they do not have to cancel out. Our explainer on the difference between FII and DII covers the basics.
When FIIs Sell and DIIs Buy
This is the pattern most traders know. Foreign selling pushes prices down, and domestic institutions buy the dip with SIP and premium inflows. The index falls less than it would without that support. If the selling continues for weeks, the question is whether domestic inflows can keep absorbing it.
When FIIs Buy and DIIs Sell
This is what the early November 2026 data shows. Foreign money leads the rally and domestic institutions take some profit. A market can keep rising in this phase, but the buying is led by overseas flows, which can reverse faster than SIP money.
When Both Groups Buy or Both Sell
Sometimes both groups are on the same side, with retail and other participants taking the opposite trade. A day when both FIIs and DIIs buy is a strong confirmation of demand. A day when both sell deserves more caution, since the usual cushion is missing.
With the relationship clear, let us turn it into a repeatable method with real arithmetic.
How to Read DII Buying: A 4-Step Worked Example
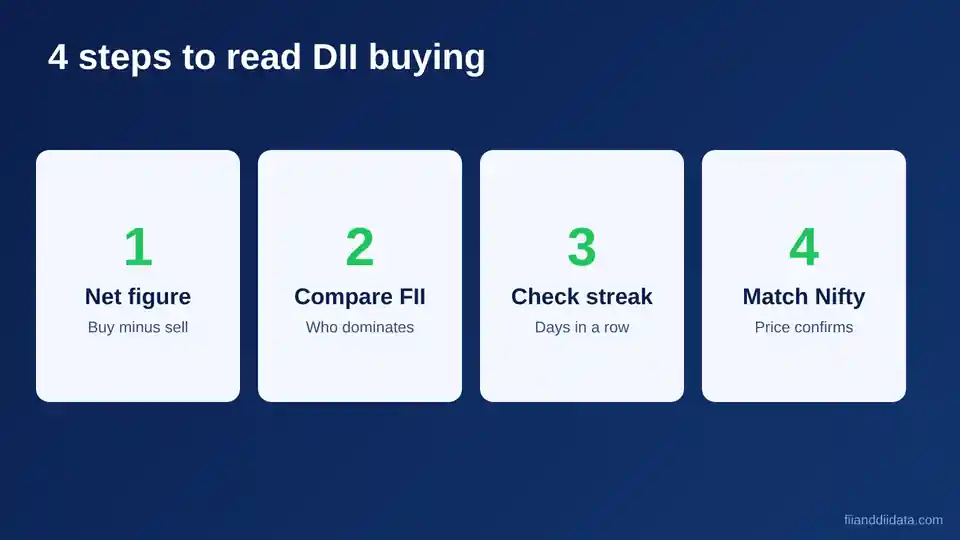
The numbers below are illustrative, not market data. They are chosen to make the arithmetic easy to follow.
- Find the net figure. Suppose DIIs bought Rs 14,000 crore and sold Rs 10,500 crore. Net buying is 14,000 minus 10,500, which is Rs 3,500 crore.
- Compare with FIIs. Suppose FIIs were net sellers of Rs 4,200 crore that day. DIIs absorbed 3,500 of the 4,200, or about 83 percent of the foreign selling.
- Check the streak. One day is noise. Look at three to five sessions in a row, then at the monthly total. A single large day can come from one big fund order.
- Match with the Nifty. If the Nifty fell only 0.3 percent on that day, domestic buying cushioned the fall. If the Nifty rose sharply while both groups bought, the move has broad support.
The 83 percent figure is plain division: 3,500 divided by 4,200. Nothing more complex is needed to judge how much of the selling pressure domestic money absorbed.
Once you can do this arithmetic, the data becomes a practical tool.
What DII Buying Meaning Tells Traders: A Checklist
Traders use DII flows as one input among several. They show who is supplying demand, but they do not time entries on their own. Our guide on how to use FII DII data for trading goes further. Use this short checklist each evening:
- Confirm the date and whether the figure is provisional (NSE, around 6 PM IST) or final (NSDL data for FPIs, next working day).
- Read the DII net figure, then the FII net figure next to it.
- Look at the last three to five sessions, not only today.
- Compare the flows with the Nifty’s move on the same days.
- Check the month-to-date total before drawing a conclusion.
- Remember that cash-market flows say little about positions in index futures and options.
Even a good checklist fails if the data is misread, so it is worth knowing the usual traps.
Common Mistakes When Reading DII Buying
- Treating one day as a trend. A single large figure can come from one fund’s order or a rebalancing day.
- Assuming DII buying guarantees a rally. Prices can still fall if selling from other participants is heavier.
- Ignoring the FII side. DII numbers only make sense next to the foreign flow and the index move.
- Reading provisional data as final. The first print after the close can be revised later.
- Expecting the figures during the session. Official FII and DII numbers are released after the market closes, not while trading is on.
- Mixing cash and derivatives. A positive DII cash figure tells you nothing about F&O positions.
Frequently Asked Questions About DII Buying
What is the DII buying meaning in the stock market?
DII buying means domestic institutional investors, such as mutual funds, insurers, banks and pension funds, bought more shares than they sold in the cash market on a given day. The reported figure is net, which is purchases minus sales.
Is DII buying good or bad for the Nifty?
It is generally supportive because it adds demand, especially when foreign investors are selling. It is not a guarantee of higher prices, so it should be read with the FII figure and the index move.
Why do DIIs buy when FIIs sell?
Domestic institutions receive steady inflows from SIPs, insurance premiums and pension contributions, and many take a long-term view. They often use foreign selling as a chance to add shares at lower prices.
Where can I check DII data and when is it released?
NSE publishes provisional FII and DII cash-market figures after market close, usually around 6 PM IST on trading days. NSDL publishes final FPI data on the next working day. Our FII DII data pages summarise the numbers.
Does DII buying always mean the market will rise?
No. DII buying shows demand from one group on one day. Prices depend on all participants, global cues and earnings, so a positive DII number can still come on a falling day.
The Bottom Line
DII buying is a simple idea: Indian institutions bought more than they sold. The value of the number comes from context. Read it next to the FII figure, over several sessions, and against the Nifty’s move. The first eight sessions of November 2026 are a good reminder that DIIs do not always buy, and that foreign money can lead a rally while domestic funds book profits.
A practical next step is to track the net figures for both groups every evening for two weeks and note how the Nifty reacted. You can start with the latest FII and DII data on our home page and build your own sense of the pattern.
Sources: NSE provisional FII/DII cash-market data (linked above); NSDL FPI data; AMFI (linked above); Tapetide FII DII flows, November 2026, as of 11 Nov 2026.
Disclaimer: This article is for educational purposes only and is not investment advice. Please consult a SEBI-registered advisor before making investment decisions.