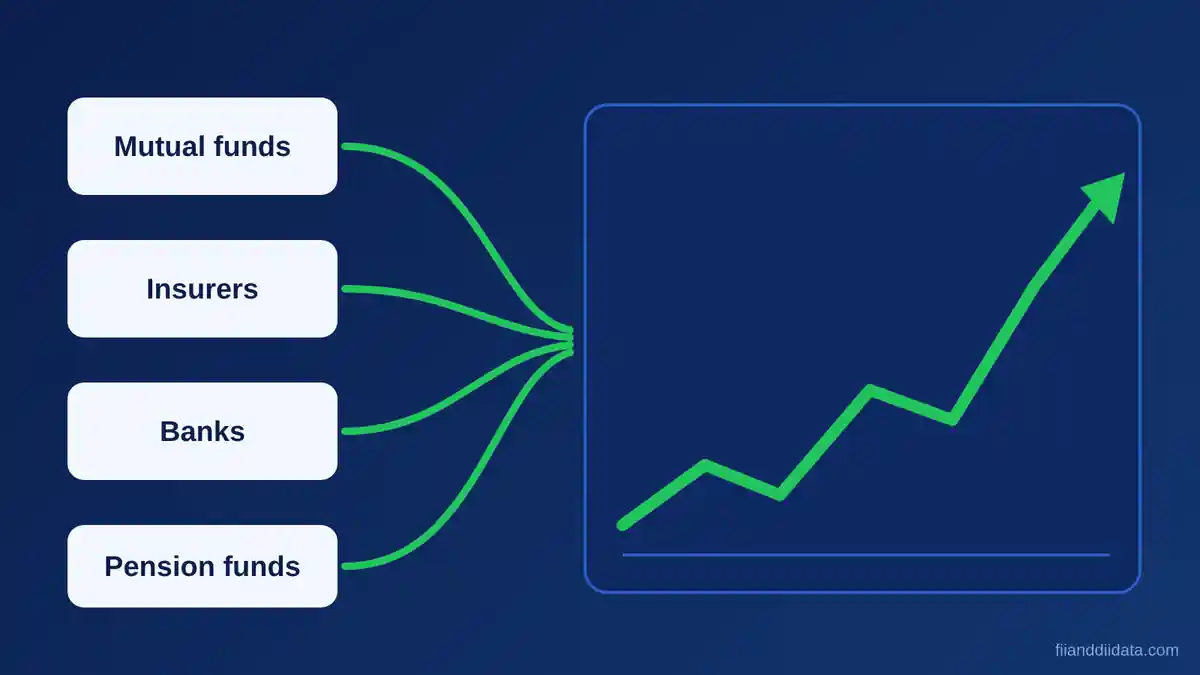
FII DII activity is the daily record of how much foreign and domestic institutions bought and sold in the Indian stock market, shown as buy, sell and net values. Reading it well tells you who is putting money into the market and who is taking it out. This guide explains where the figures come from, how to read them, and which mistakes to avoid, using clearly hypothetical numbers.
Key Takeaways
- FII DII activity reports buy value, sell value and net value for foreign and domestic institutions.
- A positive net value means buying exceeded selling; a negative net value means selling exceeded buying.
- Always read gross buy and gross sell, because a small net number can hide heavy two-way trading.
- Cash market flows and F&O positions tell different stories, so check both.
- One day is noise; a week or a month gives a better reading. This is education, not a trading signal.
Contents
- What is FII DII activity?
- Where the data comes from
- How to read FII DII activity
- Cash market and F&O positions
- Worked example
- Column guide table
- Common mistakes
- Pros and cons
- Daily checklist
- FAQs
- The Bottom Line
What Is FII DII Activity?
FII stands for Foreign Institutional Investor and DII stands for Domestic Institutional Investor. FIIs are overseas funds such as pension funds, sovereign funds and global asset managers. DIIs are Indian institutions such as mutual funds, insurance companies and banks. Under SEBI rules, foreign institutions are registered as Foreign Portfolio Investors (FPIs), so you will see both terms used for the same group.
FII DII activity simply adds up what these two groups did on a trading day. Each group has three numbers: how much it bought, how much it sold, and the difference between the two. Retail traders watch these figures because institutions move large sums, and their combined buying or selling can push index levels. For the latest numbers on this site, open our FII and DII data page, and read the FII data explainer for a closer look at the foreign side.
Where FII DII Activity Data Comes From
The primary source is the NSE report titled FII/FPI & DII trading activity on NSE, BSE and MSEI, which covers the capital market segment. You can open it on the NSE India reports page. NSE releases provisional figures after market close, usually around 6 PM IST on trading days. Provisional means the numbers can be revised.
For foreign investors there is a second source. The depositories publish FPI data, and the NSDL FPI Monitor carries it on the next working day. The two sources measure slightly different things, so small differences are normal. Exchange data is built from trades, while depository data is built from settlement and reporting. Always say which source you are quoting.
Remember that no official figure is available while the market is open. If a site shows an intraday number, treat it as an estimate and wait for the post-close release. Our FII DII data today summary is updated after the official release, and the monthly FII DII figures add up the days for you.

How to Read FII DII Activity Figures
The report lists FII/FPI and DII on separate rows. The unit is normally crore rupees, but check the header of the report each time, because the unit is printed there.
Buy, Sell and Net in FII DII Activity
Buy value is the total worth of shares an investor group bought during the day. Sell value is the total worth it sold. Net value is buy minus sell. If the net value is positive, the group was a net buyer. If it is negative, the group was a net seller. A net seller is not always bearish: it may be booking profit or rebalancing a portfolio.
Gross Versus Net Flows
Gross means buy plus sell, which shows how busy the group was. Net shows the direction. A group can trade a very large amount and still end with a small net figure.
Why Gross FII DII Activity Numbers Matter
Two days can show the same net sell but mean different things. On one day the group may have bought and sold small amounts. On another it may have traded heavily both ways. The second day shows more conviction on both sides, and the net figure alone hides that. Comparing net with gross, as a percentage, gives a simple measure of how one-sided the day was.
Cash Market and F&O: Two Sides of FII DII Activity
The headline FII DII activity table covers the cash market, which means shares bought and sold for delivery or intraday. Institutions also trade futures and options, and those positions are reported separately. A foreign fund can sell shares in the cash market and at the same time hold a different view in index futures. Reading only one side can mislead you.
FII DII Activity in the Cash Segment
Cash flows show actual money entering or leaving Indian shares. They are the cleaner signal for long-term allocation decisions, because a cash purchase is paid for in full. Heavy and repeated net selling by FIIs over weeks is usually discussed as an outflow trend. Domestic institutions often take the other side, which is why the two rows are best read together. Our DII data guide explains the domestic side in detail.
Index Futures and Options Positions
F&O data shows positions, not just trades. NSE publishes participant-wise open interest, which splits positions across client, DII, FII and proprietary categories. This tells you how many contracts each group holds, and whether the holding is long or short. See our page on participant-wise open interest for the daily view. A rise in FII short positions in index futures while cash flows are positive can mean hedging rather than a bearish call.

Worked Example: Reading One Day of FII DII Activity
Suppose on a hypothetical trading day the report shows these cash market figures, in crore rupees. These numbers are invented for practice and are not real data.
- FII buy is ₹12,400 crore and FII sell is ₹14,150 crore. Net = 12,400 − 14,150 = −₹1,750 crore, a net sell.
- DII buy is ₹11,900 crore and DII sell is ₹9,800 crore. Net = 11,900 − 9,800 = +₹2,100 crore, a net buy.
- Combined net = −1,750 + 2,100 = +₹350 crore. Domestic buying more than offset foreign selling.
- FII gross = 12,400 + 14,150 = ₹26,550 crore. The FII net sell is 1,750 ÷ 26,550 = 6.59% of gross, so the day was fairly balanced.
- DII gross = 11,900 + 9,800 = ₹21,700 crore. The DII net buy is 2,100 ÷ 21,700 = 9.68% of gross, a slightly more one-sided day.
Now extend the idea to five days. Suppose FII net values were −1,750, −900, +400, −2,300 and +600, and DII net values were +2,100, +1,500, −200, +2,600 and +300. The FII five-day total is −3,950 crore and the DII total is +6,300 crore, so the combined figure is +2,350 crore. One negative FII day was a small part of the picture; the five-day view shows foreign selling and domestic buying side by side. Real data will differ, so always use the official report for actual numbers.

Column Guide: What Each Part of the Report Means
Use this table as a quick reference when you open the NSE report. It explains the standard parts of a buy, sell and net layout.
| Term | What it shows | How to use it |
|---|---|---|
| Category | The investor group, FII/FPI or DII | Compare the two rows side by side |
| Buy value | Total worth of purchases in the day | Shows how much money came in |
| Sell value | Total worth of sales in the day | Shows how much money went out |
| Net value | Buy value minus sell value | Positive means net buying, negative means net selling |
| Gross value | Buy value plus sell value (you calculate this) | Shows how active the group was |
Common Mistakes When Reading FII DII Activity
The first mistake is treating one day as a trend. Flows swing from buying to selling quickly, and a single red number says little. The second is ignoring the other group. If DIIs are buying heavily, FII selling may not move the index much. The third is confusing provisional and final data. Check the source and the date before you quote a figure.
The fourth mistake is using FII DII activity as a buy or sell signal for a single stock. The report covers the whole market, not individual companies. For stock-level questions, look at shareholding patterns instead. The fifth is forgetting context such as the rupee, global yields and block deals, which can distort one day’s numbers. Our guide to using FII DII data for trading covers how to build that context.
Pros and Cons of FII DII Activity
FII DII activity is a useful input, but it has limits. Here is an honest summary.
| Pros | Cons |
|---|---|
| Comes from an official exchange report | Provisional figures can be revised later |
| Shows who is supplying money to the market | Covers the whole market, not single stocks |
| Easy to compare foreign and domestic groups | Net numbers can hide heavy two-way trading |
| Helps you see multi-week trends | One day is noisy and easy to misread |
| Free to check after every trading day | Does not explain why institutions traded |
Daily Checklist for FII DII Activity
- Open the NSE report after the post-close release and note the date.
- Write down net values for FII and DII, then calculate gross for each.
- Compute net as a percentage of gross to see how one-sided the day was.
- Compare the day with the previous five trading days.
- Check participant-wise open interest before drawing any view.
- Confirm important numbers against NSDL data when precision matters.
For more explainers like this one, browse the blog category.
FAQs on FII DII Activity
What is FII DII activity?
FII DII activity is the daily record of buy, sell and net values for foreign and domestic institutions in the Indian stock market, published by NSE after market close.
Where can I check FII DII activity?
The NSE publishes the FII/FPI and DII trading activity report after market close, and the NSDL FPI Monitor carries depository data for foreign investors on the next working day.
What does a negative net value mean?
A negative net value means the group sold more than it bought on that day. It does not by itself predict where the market will go.
Is FII DII activity a buy or sell signal?
No. It is a record of past trades. Use it as context alongside other information, and consult a SEBI-registered advisor before making investment decisions.
Why do FIIs and DIIs often move in opposite directions?
Foreign funds respond to global conditions such as currency and interest rates, while domestic institutions receive steady inflows from Indian savers, so the two groups can take opposite sides on the same day.
The Bottom Line
FII DII activity is best read as a set of three numbers per group, buy, sell and net, with gross used to judge how one-sided a day was. Check cash flows and F&O positions together, compare foreign and domestic rows, and look at a week or a month before forming a view.
A practical next step: after tomorrow’s post-close release, run the five-step arithmetic from the worked example on the real numbers and keep a short log. Patterns become clear after a few weeks of notes.
Sources: NSE India, FII/FPI & DII trading activity report; NSDL FPI Monitor; SEBI FPI regulations. Release timing and units may vary; check the official site.
Disclaimer: This article is for educational purposes only and is not investment advice. Worked examples use hypothetical numbers. Please consult a SEBI-registered advisor before making investment decisions.