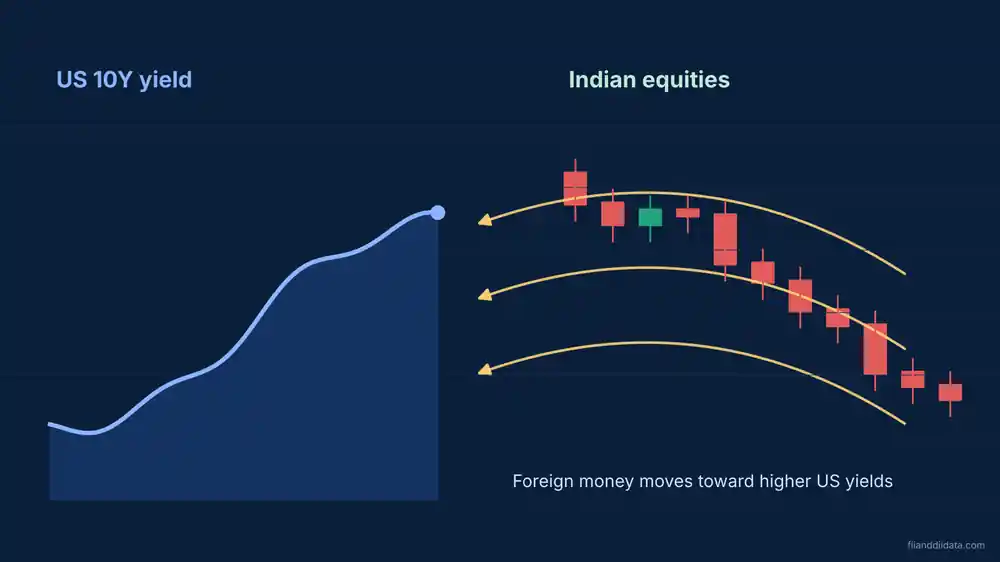
The US bond yield impact on Indian market works through one simple idea: when safe US government bonds pay more, global funds need a bigger reason to hold riskier Indian stocks. That pressure is live right now. The US 10-year Treasury yield touched 5.00% on 23 October 2026, while Nifty closed at 22,600 the same day, below its September close after the index’s steepest monthly fall since 2018.
Key Takeaways
- Higher US yields raise the risk-free return that every foreign fund compares India against.
- The effect travels through five links: US yield, dollar, FPI flows, rupee and Nifty valuations.
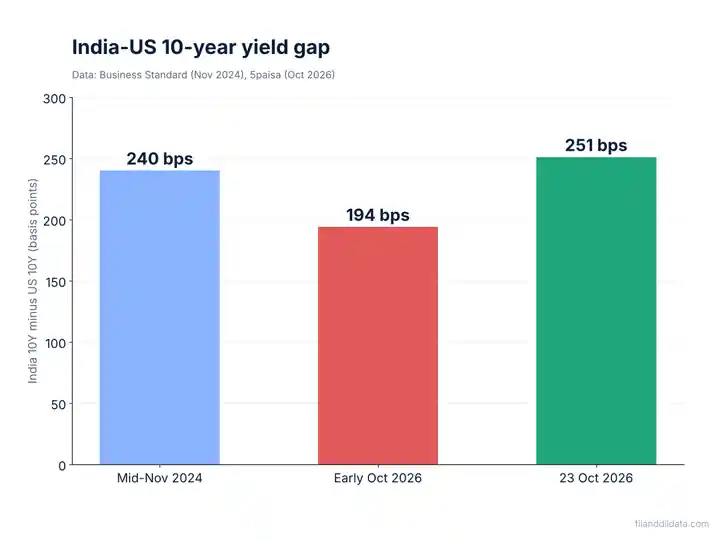
- The India-US 10-year yield gap fell to about 194 basis points in early October 2026, near a 22-year low, before widening to 251 bps on 23 October.
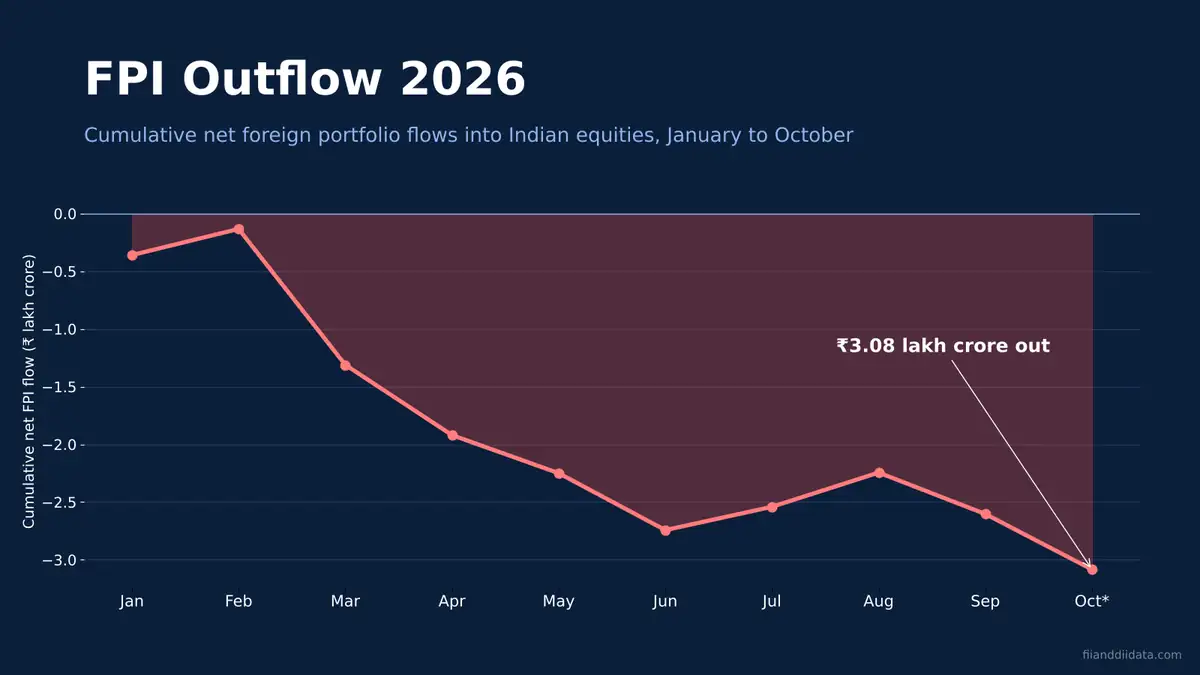
- FPIs pulled a record ₹3.08 lakh crore from Indian equities between 1 January and 12 October 2026.
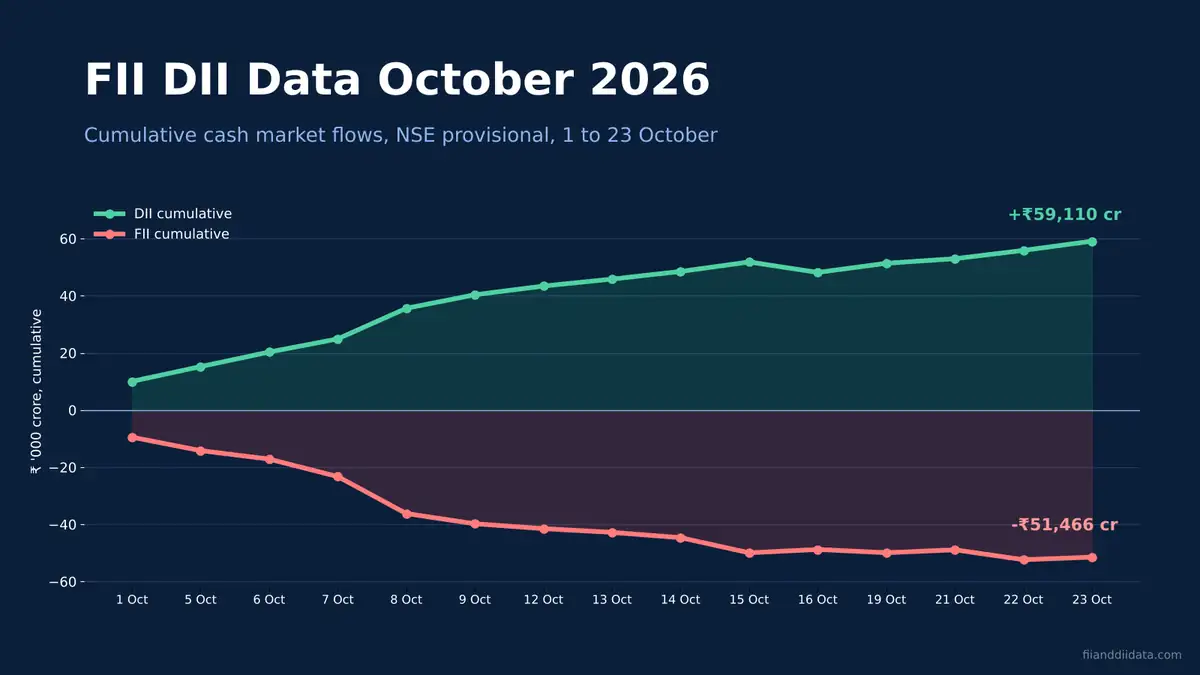
- Strong DII buying has softened the blow, but it has not stopped the rupee or Nifty from falling.
Table of contents
- What Is the US 10-Year Bond Yield and Why India Watches It
- How US Bond Yield Impact on Indian Market Works: 5 Channels
- The India-US Yield Gap: The Number FPIs Really Track
- US Bond Yield Impact on Indian Market: Lessons From 2013, 2022, 2023 and 2024
- Where Things Stand in October 2026
- Which Sectors Feel It Most
- How Traders Can Track It: A 5-Step Checklist
- Common Mistakes When Reading US Yields
- FAQs
- The Bottom Line
What Is the US 10-Year Bond Yield and Why India Watches It
A bond yield is the annual return an investor earns by buying a bond at today’s price and holding it. The US 10-year Treasury yield is the return on a 10-year loan to the US government. Because the US government is seen as the safest borrower in the world, this yield works as the global “risk-free rate”, the base return every other asset is measured against.
Bond prices and yields move in opposite directions. Yields usually climb when markets expect the US Federal Reserve to keep rates high, when inflation stays sticky, or when the US government has to borrow more.
This number matters to India because foreign portfolio investors (FPIs) own a large slice of Indian large caps. Outlook Money noted on 9 September 2026 that a large share of FPI assets tracking Indian equities is US-domiciled, so flows can react quickly to US yield moves.
So how does a number set in New York reach Dalal Street? Through five linked channels.
How US Bond Yield Impact on Indian Market Works: 5 Channels
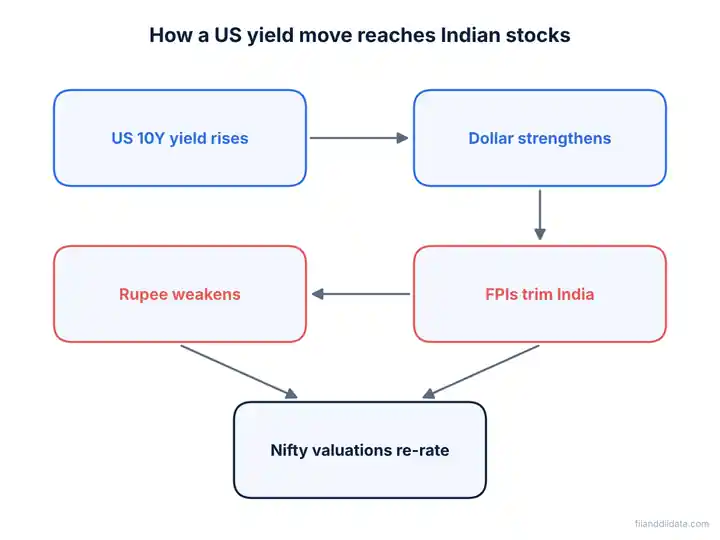
1. The return benchmark moves up
If a US Treasury pays 5% with almost no risk, Indian equities must promise clearly more than that after currency costs. When they cannot, some money moves back to US bonds.
2. The dollar strengthens
Higher US yields pull global money into dollar assets. Demand for dollars rises, and emerging market currencies such as the rupee tend to weaken. A falling rupee cuts the dollar value of every Indian share an FPI holds.
3. FPIs trim their India holdings
This is the channel you see first in the daily numbers. Persistent FPI net selling in the cash market is the clearest sign that the yield pull is working. You can follow it every evening on our daily FII DII cash market summary.
4. The rupee weakens further
FPI selling itself adds to rupee pressure, because funds convert rupees back into dollars when they exit. A weaker rupee raises the cost of imported crude oil, which feeds inflation and leaves the RBI less room to cut rates.
5. Nifty valuations re-rate
When the risk-free rate rises, the present value of future company profits falls. Stocks with rich valuations, where most of the value sits in distant future earnings, lose the most.
These channels do not act alone. The size of the effect depends on how much extra yield India still offers, which brings us to the yield gap.
The India-US Yield Gap: The Number FPIs Really Track
The yield gap, or spread, is India’s 10-year government bond yield minus the US 10-year yield. It shows how much extra a foreign investor earns for taking India risk and rupee risk. According to 5paisa, the spread stood at 251 basis points (bps) on 23 October 2026, with India’s 10-year yield at 7.47% and the US yield near 4.96%. In early October 2026, the same gap had shrunk to about 194 bps, which it described as close to a 22-year low.
For comparison, Business Standard reported a spread of about 240 bps in mid-November 2024, when the US 10-year yield was near 4.40% and India’s near 6.80%. A narrow gap means India offers little extra pay for its extra risk, which is exactly when foreign selling tends to speed up.
Worked example: why a 5% US yield beats a Nifty gain
Here is a simple hypothetical case using round numbers. An FPI invests $1 million in Nifty stocks when USD/INR is 90. That buys ₹9 crore of shares. Over the year, Nifty rises 8%, so the holding grows to ₹9.72 crore. But the rupee weakens to 95 per dollar.
- Value in rupees: ₹9.72 crore
- Value in dollars: ₹9.72 crore ÷ 95 = about $1.023 million
- Dollar return: about 2.3%
- Return from a US 10-year Treasury at 5%: $1.05 million, with far lower risk
An 8% gain in Indian stocks turned into a 2.3% gain in dollars, less than half the safe US return. The same logic applies to bonds: if the yield gap is 2.51 percentage points and the rupee falls more than about 2.5% in a year, the extra yield is wiped out. This is the arithmetic behind every FPI exit during a yield spike.
Theory is useful, but history shows how strong the effect can be. Four past episodes stand out.
US Bond Yield Impact on Indian Market: Lessons From 2013, 2022, 2023 and 2024
| Episode | What happened to US rates | Impact on India |
|---|---|---|
| 2013 taper tantrum | Fed chair Ben Bernanke hinted at tapering bond purchases | FIIs pulled ₹31,341 crore from Indian debt in June 2013 alone; rupee hit a record low of 68.84 on 28 Aug 2013 |
| 2022 Fed hiking cycle | Fed raised rates by 425 bps from March 2022 | FPIs pulled about ₹1.21 trillion from Indian equities in 2022 |
| October 2023 | US 10-year yield touched 5%, highest since 2007 | Indian bond yields rose about 40 bps from their lows |
| Oct-Nov 2024 | US 10-year near 4.40%, spread about 240 bps | FPIs sold ₹91,983 crore of equities in Oct 2024; rupee hit 84.41 on 14 Nov 2024 |
The 2013 episode was the harshest because India was fragile. Business Standard noted that India’s current account deficit was about 5% of GDP in June 2013, against 1.07% in June 2023, and that forex reserves then covered under 7 months of imports, against about 11 months in 2023. India in 2026 is far better placed to absorb shocks than it was in 2013.
The 2022 episode shows the other side. FPIs sold heavily, yet domestic institutions bought a record $40 billion that year, according to 5paisa, and the market avoided a crash. Domestic money has become the shock absorber, a pattern we track on our FII DII monthly data page.
With that history in mind, here is where the numbers stand today.
Where Things Stand in October 2026
The US 10-year yield rose to 4.80% on 9 September 2026, its highest since November 2023, as per Outlook Money. That day USD/INR climbed to 95.16 and Brent crude rose above $99 a barrel. Around the end of September, Business Today reported the US 10-year above 5.1%. Trading Economics data shows the yield at 5.00% on 23 October and 4.97% on 26 October 2026, about 28 bps lower than a month earlier but nearly one percentage point higher than a year ago.
The Fed is the main driver. Forbes reported on 19 October 2026 that the fed funds range is 3.75% to 4%, after a hike on 16 September. CME FedWatch showed about an 80% chance of a hold at the 28 October meeting, with markets expecting another hike on 9 December. Rate hikes in the US, not cuts, are what keep yields near 5%.
India has felt it. Nifty fell 6.1% in September 2026 to close at 22,620.45, its steepest monthly fall since 2018, according to Business Today. FPIs sold ₹25,662 crore in the secondary market that month while DIIs bought ₹52,617 crore. On a year-to-date basis, NSDL data reported by Business Standard showed a record FPI outflow of ₹3.08 lakh crore between 1 January and 12 October 2026. We break down the month-wise numbers in our FPI outflow 2026 report and the latest daily flows in FII DII data for October 2026.
US yields are not the only reason. Crude oil, the rupee and stretched valuations all play a part, as we explain in our analysis of why rising US bond yields and other factors are driving FII selling. But yields set the backdrop. The damage is not spread evenly, though, and some sectors take far more of the hit.
Which Sectors Feel It Most
| Sector type | Likely effect of higher US yields | Why |
|---|---|---|
| Banks and financials with high FPI ownership | Negative | Large FPI holdings mean heavy selling; higher bond yields can cut treasury gains |
| Richly valued growth stocks | Negative | Value depends on distant earnings, which a higher discount rate shrinks |
| Oil marketing, aviation, paints | Negative | A weaker rupee raises the cost of imported crude and raw materials |
| Debt-heavy infrastructure firms | Negative | Higher borrowing costs, especially on foreign currency loans |
| IT services and pharma exporters | Mixed | A weaker rupee lifts rupee earnings, but a US slowdown can hurt demand |
Exporters are not always safe: Nifty IT dropped nearly 12% in September 2026, according to Business Today, despite a weak rupee. You still need a routine to read the signals as they change.
How Traders Can Track It: A 5-Step Checklist
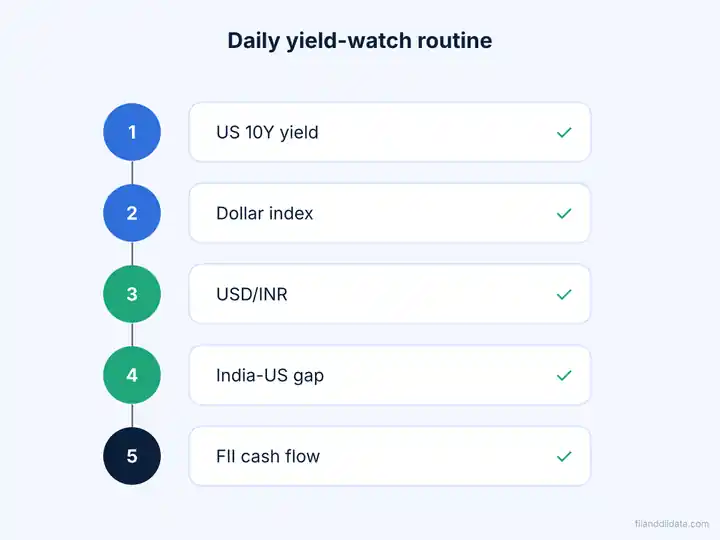
- Check the US 10-year yield each morning. Note the level and the overnight change. A move of 10 bps or more in a day is worth attention.
- Look at the dollar index. A rising dollar confirms the yield move is pulling money into US assets.
- Watch USD/INR. A rupee falling with rising US yields is the classic warning sign for FPI selling.
- Calculate the India-US yield gap. Subtract the US 10-year yield from India’s 10-year yield. A narrow gap, like the roughly 194 bps seen in early October 2026, means thin support for foreign flows.
- Confirm with FII data after 6 PM. NSE releases provisional FII/DII cash data around 6 PM IST on trading days, and NSDL publishes final FPI data the next working day. Also check how FIIs are positioned in index futures using our FII long short ratio page.
When all five line up in the same direction, the yield signal is strong. When they disagree, for example yields rise but FPIs keep buying, the market is telling you something else matters more. Knowing what to watch is half the job; avoiding the usual errors is the other half.
Common Mistakes When Reading US Yields
- Reacting to one day’s move. A single-day jump often reverses. The trend over weeks matters more than one session.
- Ignoring the speed of the move. Religare’s Ajit Mishra told Outlook Money that a gradual rise toward 5% may not rattle markets, but a sudden jump could.
- Looking at the US yield alone. The India-US gap, not the US level by itself, decides how attractive Indian bonds look.
- Forgetting domestic flows. SIP money and DII buying can absorb a large part of FPI selling, as 2022 and 2026 both show.
- Treating it as a timing tool. Yields explain the pressure on flows. They do not tell you the exact day Nifty will bottom.
The questions below cover what readers ask most often about this topic.
FAQs
What is the US bond yield impact on Indian market?
When US bond yields rise, the safe return on US government debt goes up. Foreign investors then demand more from Indian stocks, often sell Indian equities, and move money to dollar assets. This weakens the rupee and puts pressure on Nifty, especially on stocks with high FPI ownership.
Why do FIIs sell Indian stocks when US yields rise?
FIIs compare every market with the near risk-free US Treasury return. If a 10-year Treasury pays about 5%, Indian equities must offer a clearly higher return after currency losses. When the rupee is also weakening, the dollar return from India can fall below the safe US yield, so funds cut exposure.
Which sectors are most affected by rising US bond yields?
Banks and financials with heavy FPI ownership, richly valued growth stocks, debt-heavy companies and businesses that import crude or raw materials tend to suffer most. IT and pharma exporters can gain from a weaker rupee, but the benefit is not guaranteed if US demand slows.
Does a rise in US yields always make Nifty fall?
No. The effect depends on the speed of the rise, the India-US yield gap, the rupee, crude oil and domestic flows. Strong SIP inflows and DII buying have often absorbed FPI selling, so Nifty can hold up even when US yields climb.
What is the India-US bond yield spread?
It is India’s 10-year government bond yield minus the US 10-year Treasury yield. It shows the extra return a foreign investor earns for taking India and rupee risk. It was about 251 basis points on 23 October 2026, after falling to about 194 basis points in early October.
The Bottom Line
The US bond yield impact on Indian market is real but not mechanical. A US 10-year yield near 5% raises the bar for foreign money, weakens the rupee and pressures richly valued stocks. That is a big part of why FPIs have pulled a record amount from Indian equities in 2026.
India’s defences are also stronger than in 2013. A smaller current account deficit, larger reserves and steady domestic buying mean a yield spike now tends to cause a slow grind rather than a crash. The practical step: add the US 10-year yield and the India-US gap to your daily routine, then confirm with the evening FII DII numbers on our FII DII data dashboard. More analysis is on the FIIAndDIIData.com blog.
Sources: Outlook Money (9 Sep 2026); 5paisa (Oct 2026); Business Standard (16 Nov 2024); Forbes (19 Oct 2026); Business Standard (3 Jan 2014, 29 Oct 2023, 13 Oct 2026); Business Today (1 Oct 2026); Trading Economics (26 Oct 2026); Kotak Neo (23 Oct 2026); NSDL; NSE.
Disclaimer: This article is for educational purposes only and is not investment advice. Please consult a SEBI-registered advisor before making investment decisions.